July 13, 2026
The Hidden Architecture of Oil Price Shocks: Why Chokepoints Define Market Psychology
Every commodity market operates on two simultaneous pricing tracks: one rooted in physical supply and demand fundamentals, the other in the collective fear and confidence of global traders. Nowhere is this duality more visible than in crude oil markets when tension surfaces around the Strait of Hormuz. The waterway connecting the Persian Gulf to the Gulf of Oman is not merely a geographical feature — it is a psychological lever for global energy pricing, capable of moving billions of dollars in futures contracts based on perception alone, even before a single barrel is withheld from the market.
Understanding how oil prices after US Iran strikes behave requires looking beyond the immediate news cycle and into the structural mechanics of how energy markets assign and withdraw risk premiums in real time.
When big ASX news breaks, our subscribers know first
Why the Strait of Hormuz Remains the World's Most Consequential Energy Chokepoint
The Geography of Global Oil Dependency
Approximately 20% of the world's total daily oil supply moves through the Strait of Hormuz, a passage that narrows to roughly 33 kilometres at its most constricted point. The producer nations that depend on this corridor for export access include Saudi Arabia, the UAE, Iraq, Kuwait, and Iran itself — collectively representing the backbone of global hydrocarbon supply.
What makes Hormuz uniquely consequential is the absence of a credible, full-scale alternative. While pipelines such as Saudi Arabia's East-West Pipeline and the Abu Dhabi Crude Oil Pipeline provide partial bypass capacity, neither can absorb the full throughput volume that transits the strait daily. Any disruption — even a partial or perceived one — therefore carries systemic implications that reverberate across every oil-importing economy on the planet.
How Chokepoint Disruptions Translate Into Immediate Price Signals
The mechanics of geopolitical risk pricing in crude futures markets operate on a probability-weighted basis. Traders do not wait for a confirmed blockage to act; they reprice based on the likelihood that a disruption could materialise. This distinction is critical for understanding why oil prices after US Iran strikes respond so quickly and so sharply. The oil geopolitical risks at play extend far beyond immediate military exchanges, shaping how markets interpret every new development.
Historical precedents reinforce this pattern:
-
During the 1980s Tanker War, Iranian and Iraqi forces targeted oil tankers in the Persian Gulf, causing significant freight cost increases and market volatility even when overall throughput volumes remained partially sustained.
-
The 2019 tanker attacks near the Gulf of Oman, attributed to Iran, produced an immediate ~4% single-session spike in Brent crude prices despite no confirmed supply disruption of meaningful volume.
-
The 2019 Abqaiq drone attack on Saudi Aramco facilities demonstrated that a single event targeting production infrastructure could generate a ~15% single-day price surge, the largest in decades.
Key Market Insight: The geopolitical risk premium in oil is not a rational calculation of lost barrels — it is a fear-weighted forecast of possible futures. Markets price the credible threat, not the confirmed outcome. This means price spikes often precede any real supply disruption and can partially retrace once the worst-case scenario fails to materialise.
What Happened to Oil Prices After US Strikes on Iran: A Market Data Breakdown
Immediate Price Response: The First Wave of Volatility
The market's response to the latest escalation cycle unfolded in two distinct waves. The first came when news of US strikes on Iran reached trading desks: Brent crude rose approximately +1.1% to $78.88 per barrel, while WTI climbed +1.2% to $74.37 per barrel. These were measured moves — reflecting a market that had partially anticipated renewed tension without fully pricing a catastrophic scenario. For broader context on oil price volatility trends in this environment, historical patterns suggest such initial responses are rarely the full story.
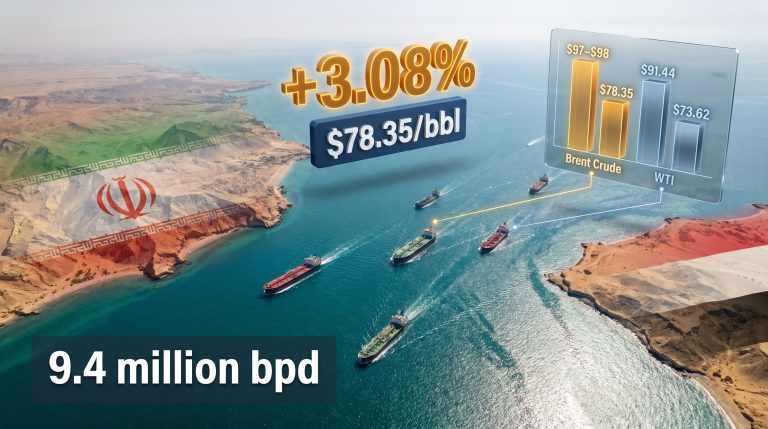
The second and more significant wave arrived after Iran expanded its counter-strikes to include targets in Qatar and the UAE over the weekend. Monday's opening gap reflected this compounded risk, with Brent surging a further $2.34, or +3.08%, to $78.35, and WTI advancing $2.21, or +3.09%, to $73.62. The expansion of Iranian military action to Gulf Cooperation Council (GCC) territories fundamentally changed the risk calculus from a bilateral US-Iran exchange to a potential regional conflict with direct implications for energy infrastructure.
Price Movement Summary Table
| Market Event | Brent Crude Change | WTI Change | Key Driver |
|---|---|---|---|
| Initial US strikes on Iran | +$0.86 (+1.1%) to $78.88 | +$0.85 (+1.2%) to $74.37 | Ceasefire confidence erosion |
| Iran counter-strikes on Qatar and UAE | +$2.34 (+3.08%) to $78.35 | +$2.21 (+3.09%) to $73.62 | Strait of Hormuz closure risk |
| Post-spike partial retracement | Approx. -1% from session highs | Approx. -1% from session highs | Market reassesses closure probability |
| Pre-war baseline (early 2026) | Approx. $70/barrel | Approx. $65/barrel | Ceasefire optimism, supply recovery |
| Peak war pricing (earlier 2026) | Approx. $120/barrel | Not specified | Full Hormuz disruption fears |
Why Did Prices Partially Retreat After the Initial Spike?
The partial retracement from session highs revealed something important about trader sentiment: the market was interpreting the weekend's events as an intensification within an existing conflict framework rather than a complete diplomatic rupture. IG Market Analyst Tony Sycamore articulated this distinction clearly, noting that the relatively contained price response suggested traders viewed the flare-up as an escalation inside a fragile truce rather than a total ceasefire collapse — while also cautioning that the accuracy of this interpretation remained to be tested.
Reinforcing this cautious-but-not-panicked reading was a key data point from vessel-tracking firm Kpler: only 6 ships transited the Strait of Hormuz on the Sunday in question, the lowest five-week count recorded. This figure did not indicate a complete closure, but it signalled a functioning constraint — enough to confirm risk without confirming catastrophe. Al Jazeera's reporting on the price surge following the US strikes provides further detail on how markets interpreted these early signals.
How Fragile Was the US-Iran Ceasefire Agreement Before This Escalation?
The Architecture of the Interim Agreement
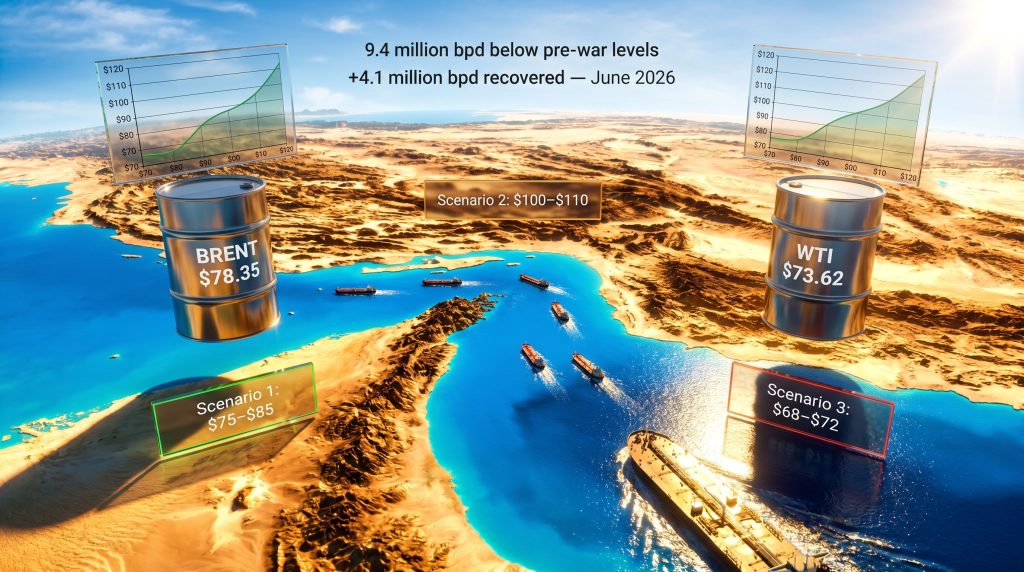
The interim accord reached between the US and Iran in the preceding month was designed with two interlocking objectives: reopening the Strait of Hormuz to commercial traffic and establishing a 60-day negotiation window aimed at producing a more permanent resolution to hostilities. On the supply side, the agreement delivered measurable results — global oil supply rose by 4.1 million barrels per day in June 2026, according to the IEA's monthly report.
However, this recovery was built on a fragile foundation. Even with the ceasefire-driven supply rebound, global production remained 9.4 million barrels per day below pre-war levels. This structural deficit meant that any renewed disruption would not simply freeze supply at current levels — it would push markets back toward the acute scarcity conditions that drove Brent crude toward $120 per barrel at the height of the conflict.
What the Sanctions Waiver Revocation Signals
Beyond the military dimension, the US decision to revoke a 60-day sanctions waiver on Iranian oil exports introduced a separate and compounding pressure mechanism. Sanctions enforcement and military escalation function as twin levers on Iranian output capacity, operating independently but with reinforcing effects. Furthermore, even in a scenario where military tensions were to de-escalate, the sanctions revocation tightens the market's supply outlook by constraining how quickly Iranian crude can re-enter global export channels under any future diplomatic arrangement.
ANZ Research analysts assessed the situation directly, concluding that the prospects for a prompt resolution to the conflict appeared increasingly uncertain following the weekend's expanded military exchanges — a view that aligned with the broader market's reassessment of its optimistic timeline assumptions.
Scenario Modelling: Three Trajectories for Oil Prices Under Continued US-Iran Tensions
Scenario 1: Managed Escalation (Base Case)
Definition: Military exchanges persist at moderate intensity; the Strait remains functionally open but at reduced traffic volumes.
- Brent price range: $75 to $85 per barrel
- Key assumption: Neither party takes deliberate action to mine or formally close the Strait
- Supply trajectory: Gradual recovery, though the IEA's projected 2027 global oil surplus faces growing risk of delay
- Tanker market dynamic: Rerouting adds cost and insurance premiums without causing net volume loss
Scenario 2: Ceasefire Collapse and Extended Strait Closure
Definition: Diplomatic framework fully disintegrates; Iran enforces an effective Strait closure for two to four weeks.
- Brent price range: $100 to $110 per barrel within 30 days
- Historical analog: The 2019 Abqaiq attack produced a single-day spike of approximately 15%; a sustained closure would generate structurally deeper and more persistent price pressure
- Mitigating factor: Strategic Petroleum Reserve (SPR) releases by the US and coordinated IEA member drawdowns could cap the upper bound of any sustained spike, though these mechanisms have finite duration
Scenario 3: Rapid De-escalation and Diplomatic Re-engagement
Definition: Back-channel negotiations resume; Iran reopens the Strait under monitored conditions.
- Brent price range: $68 to $72 per barrel as supply recovery accelerates
- Catalyst requirements: A credible third-party guarantor — historically, Oman has served as a trusted back-channel mediator between Washington and Tehran — combined with verifiable Iranian compliance
- Investor risk: Markets may withhold full de-escalation pricing until physical supply data confirms a recovery trend, creating a lag between diplomatic progress and price retracement
Scenario Framework Insight: The variable separating Scenario 1 from Scenario 2 is not the frequency of military strikes but whether either party moves to actively interrupt commercial vessel transit. As long as tankers continue moving through the Strait, even at reduced volumes, the market's base case assumption holds. The six-vessel transit count on Sunday sits dangerously close to the threshold where that assumption begins to break down.
What Does the Supply Gap Tell Us About Structural Oil Market Vulnerability?
The 9.4 Million BPD Deficit: Context and Consequences
The 9.4 million barrels per day shortfall relative to pre-war production levels represents cumulative supply destruction across multiple producer nations and export terminals. This is not a temporary pricing anomaly — it reflects physical infrastructure damage, workforce displacement, and export terminal disruptions that cannot be reversed quickly even under optimal diplomatic conditions.
This structural baseline tightness means the market's tolerance for additional disruption is considerably lower than it would be during a period of supply abundance. Consequently, each new military exchange carries a higher marginal price impact than it would under normal conditions.
The IEA's 2027 Surplus Projection Under Threat
Under pre-conflict supply growth trajectories, the IEA had projected that global oil production would build toward a surplus position by 2027, driven by non-OPEC+ output growth and normalising demand patterns. Continued US-Iran escalation directly threatens this timeline by delaying the production recovery needed across Middle Eastern export nations. OPEC's market influence over spare capacity deployment adds another layer of complexity, as internal alliance tensions over quota discipline may limit how effectively any production shortfall can be compensated.
Tanker Market Stress Indicators
The tanker market functions as a real-time barometer of physical supply risk, often signalling disruption before futures markets fully reprice. Key stress indicators include:
-
War risk insurance premiums on vessels transiting the Persian Gulf, which have spiked materially during previous tension episodes and directly translate into higher effective delivered costs for crude importers
-
Vessel rerouting decisions, where shipowners choose longer Cape of Good Hope routes rather than transit through Hormuz, adding 10 to 15 days of voyage time and compressing effective tanker supply availability
-
LNG market exposure, a dimension often overlooked in crude-focused analysis: Qatar, one of the world's largest LNG exporters, transits the Strait for a significant portion of its seaborne gas shipments. The global LNG supply outlook is therefore directly implicated, as Hormuz disruption cascades into European and Asian natural gas markets
The next major ASX story will hit our subscribers first
How Should Energy Investors Interpret Geopolitical Risk Premiums in Oil?
Decomposing the Risk Premium: What Is Actually Priced In?
A +3% price move on news of Iranian counter-strikes expanding to GCC territory is, in historical context, a relatively restrained market response. This restraint carries analytical meaning: it suggests that professional traders are assigning a low-to-moderate probability to a full Strait closure scenario, rather than treating it as the base case. The market is effectively pricing a risk distribution skewed toward managed escalation, not toward catastrophic disruption.
This creates an asymmetric risk profile for energy investors. The upside for oil prices in a de-escalation scenario is limited — perhaps a $6 to $8 per barrel retracement toward $68 to $72 — while the downside risk (from the oil price perspective) in a full ceasefire collapse scenario could be a $25 to $35 per barrel spike toward $100 to $110. The expected value calculation therefore favours holding rather than shorting oil exposure until diplomatic clarity emerges.
Key Variables Energy Investors Should Monitor
| Indicator | Bullish Signal for Oil Prices | Bearish Signal for Oil Prices |
|---|---|---|
| Strait of Hormuz daily vessel transits | Consistently below 10 per day | Return to 20+ vessels per day |
| US sanctions enforcement posture | New designations, waiver revocations | Sanctions relief or extended waivers |
| IEA monthly supply data | Continued deficit vs. pre-war levels | Accelerating production recovery |
| Diplomatic back-channel activity | No confirmed negotiations | Oman or EU-mediated resumption |
| Iranian military posture | Expanded GCC state targeting | Withdrawal from forward positions |
| War risk insurance premiums | Sustained elevation above baseline | Normalisation toward pre-conflict rates |
The Broader Market Ripple: Beyond Crude Oil
Gold, Currencies, and Cross-Asset Implications
One of the less-discussed dynamics of this conflict cycle is the unusual behaviour of gold. Traditionally, Hormuz-related escalation drives simultaneous buying in crude and gold as investors seek both inflation hedges and safe-haven assets. However, reporting from Zawya indicates that gold has faced downward pressure during this period, with Gulf state military strikes reinforcing rate-hike expectations among bond markets — pushing real yields higher and making non-yielding gold less attractive. This divergence from gold's conventional safe-haven role reflects how inflation-fighting monetary policy frameworks complicate traditional crisis-asset correlations.
Regional Economic Exposure: GCC Nations in the Crossfire
The expansion of Iranian strikes to Qatar and the UAE introduces a dimension of risk that extends well beyond oil pricing. In addition, S&P has assessed that geopolitical uncertainty and the Middle East war are likely to constrain growth among GCC banking institutions, reflecting the broader economic disruption that sustained conflict introduces into regional financial systems.
Fujairah's role as a critical oil storage, bunkering, and refined products hub amplifies the strategic significance of Gulf state targeting. Any degradation of Fujairah's operational capacity would directly impact the region's ability to serve as an alternative distribution node if Hormuz traffic volumes continue declining.
For downstream Asian energy importers — particularly China, Japan, and South Korea, which collectively represent the largest block of Middle Eastern crude consumers — each day of constrained Strait transit translates into tighter near-term supply availability and elevated procurement costs. These nations hold limited domestic production buffers and depend on Middle Eastern crude to a degree that European importers, with greater access to Atlantic Basin and North Sea alternatives, do not. Furthermore, the trade war impact on oil adds yet another variable for Asian importers already navigating complex procurement environments.
Frequently Asked Questions: Oil Prices and the US-Iran Conflict
How much did oil prices rise after the US struck Iran?
Brent crude initially gained +1.1% to $78.88 per barrel on the first strike news, before a second escalation wave driven by Iranian counter-strikes on Qatar and the UAE pushed prices a further +3.08% to $78.35 per barrel — two compounding risk events within a single trading week.
Is the Strait of Hormuz currently open or closed?
As of the reporting period, the Strait remained technically open to commercial traffic, with US President Donald Trump publicly asserting passage rights for commercial vessels. However, Iran declared a closure following a vessel incident involving an unapproved route, and transit volumes measured by Kpler fell to just 6 ships on Sunday, a five-week low — a figure that reflects a constrained but not fully closed passage.
What was the oil price before the US-Iran war began?
Prior to the conflict's outbreak, Brent crude was trading near $70 per barrel. At the peak of hostilities earlier in 2026, prices escalated to approximately $120 per barrel before retreating as ceasefire hopes materialised and the interim agreement temporarily reopened the Strait.
Could oil prices return to $100 per barrel?
Under a scenario involving a sustained Strait closure or full ceasefire collapse, a retest of the $100 to $110 per barrel range is analytically plausible within a 30-day window. However, the market's current pricing reflects a trader consensus assigning relatively low probability to this outcome. SPR releases and coordinated IEA drawdowns would likely cap any sustained spike above this range.
How much oil supply was lost during the conflict?
According to the IEA, global oil supply remained 9.4 million barrels per day below pre-war production levels as of June 2026, despite a +4.1 million bpd recovery following the interim ceasefire agreement's signing. CNBC Africa's coverage of how oil prices eased after spiking provides useful context on how markets digested this supply data in real time.
What happens to oil prices if a diplomatic deal is reached?
A credible, verified diplomatic resolution would likely see Brent retrace toward the $68 to $72 per barrel range as the supply recovery accelerates and the geopolitical risk premium embedded in futures pricing is progressively unwound. The pace of retracement would depend on how quickly physical vessel transit data confirmed a return to normalised Strait throughput.
Reading the Oil Market Through a Geopolitical Lens: What the Next 60 Days Will Determine
The original ceasefire framework's 60-day negotiation window is now under direct pressure from the latest escalation cycle. Whether that window survives depends on three observable milestones:
-
Strait transit volume trends over the coming two weeks: a sustained recovery toward 15 or more vessels per day would signal that the functional opening of the passage is holding, even under political stress.
-
The US sanctions posture: whether the revocation of the 60-day waiver on Iranian oil exports is followed by additional enforcement actions or whether it is held as a negotiating card to be returned in a future settlement.
-
Third-party diplomatic engagement: whether Oman, historically the most effective back-channel mediator between Washington and Tehran, re-activates its facilitation role in response to the weekend's escalation.
The current episode, despite its dramatic headlines, has produced a measured market response relative to the severity of the military exchanges involved. That measured response reflects a collective trader judgment that the ceasefire architecture, while damaged, has not yet been destroyed. If Strait transit volumes stabilise and diplomatic back-channels re-engage, the 60-day window may survive in altered form. If they do not, the market's relatively calm pricing will prove to have been the last interval of underpriced risk before a far more disruptive repricing event.
Further Reading: Readers seeking ongoing coverage of Middle East energy markets, oil price developments, and Gulf geopolitical dynamics can access Zawya's Energy and Commodities reporting at zawya.com, which provides regional market intelligence from across the GCC and broader MENA energy sector.
Disclaimer: This article is intended for informational and analytical purposes only. It does not constitute financial or investment advice. All price figures, supply data, and scenario projections referenced are drawn from publicly reported sources and analytical frameworks; actual market outcomes may differ materially. Readers should conduct independent research before making any investment decisions.
Want To Stay Ahead of the Market Moves That Matter in Energy and Beyond?
Discovery Alert's proprietary Discovery IQ model delivers real-time alerts on significant ASX mineral discoveries the moment they hit the exchange, translating complex market data into actionable opportunities for both traders and long-term investors — explore historic discovery returns to understand the magnitude of what early positioning can mean, then begin your 14-day free trial at Discovery Alert to secure your market-leading edge.