August 2, 2026
The Chokepoint Economy: How a Single Waterway Is Holding Global Energy Markets Hostage
Every few decades, the global energy system is forced to confront a structural vulnerability it had quietly chosen to ignore. The late 1970s exposed the fragility of dependence on Iranian crude. The early 1990s demonstrated how quickly Gulf supply routes could be threatened by regional conflict. Today, a new chapter is being written, and once again the Persian Gulf sits at its centre, with oil prices and US-Iran talks now operating as two sides of the same volatile equation.
What makes the current moment distinct from prior crises is not simply the scale of supply disruption, but the speed at which diplomatic signals are now translated into price movements. Markets are no longer waiting for physical supply data to react. They are moving on social media posts, state broadcaster reports, and conflicting press briefings, often within minutes of publication. Understanding this dynamic is essential for anyone trying to interpret crude oil price trends in mid-2026.
When big ASX news breaks, our subscribers know first
The Strait of Hormuz: A 33-Kilometre Passage That Prices the World's Energy
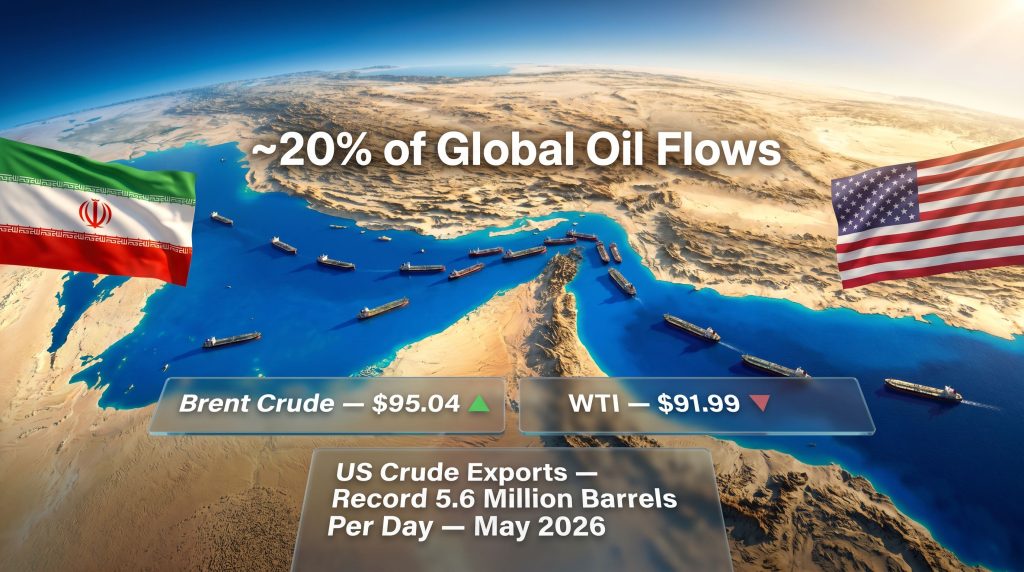
The Strait of Hormuz is, at its narrowest point, roughly 33 kilometres wide. Yet this compressed maritime corridor functions as the single most consequential energy chokepoint on the planet. Approximately one-fifth of all globally traded oil flows through it, alongside a comparable share of liquefied natural gas exports, much of which originates from Qatar and is destined for energy-hungry markets across Asia and Europe.
Since the escalation of the US-Iran conflict prompted Iran to effectively halt non-Iranian commercial shipping through the Gulf, the downstream consequences have been severe and wide-ranging.
| Metric | Data Point |
|---|---|
| Share of global oil flows through the strait | ~20% |
| Share of global LNG flows affected | ~20% |
| Estimated oil price increase since disruption began | 50%+ |
| US crude export record reached in May 2026 | 5.6 million barrels per day |
| Expected US crude inventory draw (week ending May 29) | ~3.6 million barrels |
The disruption has forced Asian and European refiners to scramble for alternative supply, with American crude filling a growing portion of that gap. US crude exports climbed to a record 5.6 million barrels per day in May 2026, according to ship-tracking data, as buyers who had historically relied on Middle Eastern grades pivoted toward Atlantic Basin alternatives. This is a remarkable shift in global trade flows, one that would have seemed implausible just a few years ago when US shale production was still constrained by export infrastructure limitations.
Why This Disruption Is Structurally Different From Historical Precedents
Placing the current situation in historical context reveals both the severity and the unique character of what is unfolding. Previous Middle East oil crises targeted production infrastructure. The 1973 Arab Oil Embargo reduced physical output. The Iranian Revolution of 1979 took Iranian barrels off the market entirely. The Gulf War threatened Iraqi and Kuwaiti production capacity.
| Event | Supply Impact | Peak Price Response | Resolution Timeline |
|---|---|---|---|
| 1973 Arab Oil Embargo | ~7% of global supply | Prices quadrupled | ~6 months |
| 1979 Iranian Revolution | ~4% of global supply | Prices doubled | ~2 years |
| 1990 Gulf War | ~4.3% of global supply | Prices doubled temporarily | ~6 months |
| Current Hormuz Disruption | ~20% of global oil + LNG transit | 50%+ price increase | Ongoing |
The current disruption targets a transit corridor rather than production capacity itself. This distinction carries a counterintuitive implication: the situation is simultaneously more reversible and more unpredictable than a production shutdown. A diplomatic agreement could theoretically restore normal shipping flows within days. Conversely, any escalation that results in physical damage to the waterway's navigability would create a far longer-duration crisis. Markets are pricing both possibilities concurrently, which explains the extreme intraday volatility that has characterised crude benchmarks throughout the conflict.
How Oil Prices and US-Iran Talks Are Moving in Lockstep
The relationship between oil prices and US-Iran talks has become one of the most direct geopolitical-commodity linkages in modern market history. Brent crude futures were trading at approximately $95.04 per barrel in early June 2026 trading, while West Texas Intermediate (WTI) sat at around $91.99 per barrel, with both benchmarks having registered gains exceeding 5% in the prior session before partially retracing. Furthermore, WTI and Brent futures have continued to reflect these sharp diplomatic swings in real time.
| Benchmark | Price Level | Movement |
|---|---|---|
| Brent Crude Futures | ~$95.04 per barrel | +0.06% in early trade |
| West Texas Intermediate (WTI) | ~$91.99 per barrel | -0.18% in early trade |
| Prior session gain (both benchmarks) | 5%+ intraday | Partially reversed |
| WTI intraday peak gain | Up to 8% | Before pullback |
The partial pullback in prices followed a sequence of conflicting signals from Washington. Initial gains were driven by reports from Iran's Tasnim news agency indicating that Tehran had suspended indirect negotiations with Washington. Prices then retraced after President Trump publicly stated that talks were still ongoing, subsequently indicating he expected a ceasefire extension and Strait of Hormuz reopening agreement within approximately one week.
This pattern illustrates a key dynamic that energy traders are navigating in real time: the trajectory of negotiations, not just their outcome, is driving price discovery. A rumoured suspension triggers a spike. A denial triggers a partial reversal. The gap between the two price points represents the market's attempt to assign probability weights to each scenario.
Tim Waterer, chief market analyst at KCM Trade, has noted that the market is simultaneously tracking whether concrete progress or setbacks are occurring in US-Iran negotiations, the tone of official statements from both parties particularly regarding Hormuz access threats, and actual physical tanker movements through the waterway. He has also noted that the status of negotiations at any given point will ultimately determine whether the current risk premium remains embedded in oil prices or begins to unwind. (Source: Reuters, June 2, 2026)
Understanding the Geopolitical Risk Premium in Crude Oil
A geopolitical risk premium is the additional cost embedded in crude oil prices above what supply-demand fundamentals would otherwise justify. It functions as a market-priced insurance mechanism, reflecting the probability that supply will be disrupted and that buyers will need to pay more to secure alternative volumes.
In the current environment, the premium is directly tied to the perceived likelihood of extended Strait of Hormuz interference. Key characteristics of how this premium behaves:
- Risk premiums form rapidly on headline risk and can dissolve just as quickly when credible diplomatic progress is signalled
- The premium is not static, it fluctuates intraday as new information enters the market
- Premiums are typically larger when the threatened supply represents a higher proportion of globally traded volumes, which is why the Hormuz situation has generated a more severe premium than most prior crises
- Premiums can become self-reinforcing if they persist long enough to alter physical trade flows, as buyers begin restructuring procurement strategies rather than waiting for resolution
A lesser-understood dynamic in the current situation is that the risk premium is also being sustained by structural factors beyond pure diplomacy. The war-risk insurance premiums that tanker operators now face when transiting anywhere near the Persian Gulf have added a real, quantifiable cost layer to regional energy commerce. Even if a ceasefire is announced, insurers are unlikely to immediately remove these surcharges, meaning some degree of cost elevation will persist in global energy supply chains even after a formal agreement.
The Diplomatic Architecture: Why These Talks Are So Difficult to Read
One reason oil prices and US-Iran talks remain so tightly coupled is that the negotiations themselves are structurally opaque. The discussions have proceeded through intermediaries rather than direct diplomatic engagement, making each communication more susceptible to misinterpretation, deliberate distortion, or selective disclosure by either side. Geopolitical trade tensions of this nature consistently amplify market uncertainty well beyond what the underlying supply data would otherwise justify.
Several overlapping complexities are shaping the negotiation landscape:
- Indirect format: The absence of direct dialogue means that every reported development is filtered through at least one additional party, creating scope for miscommunication that is then amplified by markets
- Iranian domestic politics: State media reports that talks were suspended may reflect internal political signalling within Tehran rather than an authoritative policy position, a distinction that matters enormously for price interpretation but is nearly impossible for markets to assess in real time
- The Hezbollah dimension: Lebanon's announcement of a partial ceasefire between Hezbollah and Israeli forces adds a related but distinct conflict thread that interacts with the broader Iran-US dynamic in ways that are not always predictable
- Trump administration ambiguity: Public statements from Washington have included indications of both continued engagement and apparent indifference to the outcome, creating an additional layer of uncertainty that operates independently of the actual negotiation status
This multi-dimensional complexity means that traditional geopolitical risk frameworks, which typically assign a single probability to a binary outcome, are poorly suited to the current environment. Traders and analysts are instead operating with scenario trees rather than point forecasts.
Scenario Mapping: What Comes Next for Oil Prices?
Rather than treating the situation as a simple on-off switch, energy market analysts are working through a range of potential outcomes with distinct price implications.
| Scenario | Probability Signal | Brent Price Implication |
|---|---|---|
| Full ceasefire deal and Strait reopened | Moderate, Trump suggests one-week timeline | Risk premium unwinds; prices decline materially |
| Talks collapse and hostilities escalate | Lower, market still pricing in deal possibility | Prices surge well above current levels |
| Prolonged ambiguity with partial restrictions | Elevated, current base case | Prices range-bound with high volatility |
| Partial deal with limited Hormuz access | Possible | Moderate price decline, uncertainty persists |
A critical and underappreciated point is that a partial or vague agreement may not be sufficient to restore normal shipping operations. Shipping executives who gathered in Athens made clear that any peace deal must include explicit, enforceable provisions governing the right of commercial vessels to resume normal transit through the strait. A ceasefire declaration that does not directly address maritime access is unlikely to satisfy tanker operators or the insurance markets that underpin their operations.
This means the bar for a meaningful oil price reduction is actually higher than the bar for a formal ceasefire announcement, a distinction that markets may not fully discount in the initial reaction to any deal news.
Tony Sycamore, market analyst at IG, has observed that oil price volatility is expected to persist until there is clear, verifiable evidence of meaningful progress toward a comprehensive peace agreement, rather than simply headline-level diplomatic activity. (Source: Reuters, June 2, 2026)
The next major ASX story will hit our subscribers first
Beyond Crude Oil: The Cascading Effects Across Energy and Industrial Systems
The Strait of Hormuz disruption is not a crude oil story alone. Its effects are radiating across multiple commodity and industrial systems in ways that compound the macro impact. In addition, the trade war economic impact layered atop this crisis is further complicating supply chain decisions for importers already under pressure.
LNG market dislocation is particularly significant. Approximately one-fifth of global LNG supply passes through the strait, primarily from Qatar. Asian buyers, who have built their energy infrastructure around reliable Gulf LNG supplies, are now competing for alternative spot cargoes from Australia, the United States, and other Atlantic Basin producers. This competition is driving LNG spot prices higher in parallel with crude benchmarks, adding a second energy price shock to importing economies already absorbing elevated oil costs.
US domestic inventory dynamics are also shifting in ways that matter for price direction. Preliminary data indicated that US crude stockpiles were expected to have fallen by approximately 3.6 million barrels in the week ending May 29, with distillate and gasoline inventories also likely to have declined. A tightening domestic supply picture reduces the buffer available to absorb further disruptions and provides additional upward price support even if diplomatic progress is made.
Freight and logistics costs represent a third transmission channel. War-risk insurance premiums for tankers operating anywhere near the Persian Gulf have risen sharply, adding a structural cost increment to every cargo that transits or bypasses the region. These elevated freight costs feed into the landed cost of crude for importing refineries, widening the price differential between grades that require Persian Gulf routing and those that do not.
The Macro Economic Transmission: From Crude Prices to Consumer Inflation
Elevated oil prices do not remain contained within commodity trading floors. They transmit through the broader economy via multiple channels, each of which carries its own inflationary and growth implications.
Key transmission pathways include:
- Consumer fuel prices: Retail gasoline and diesel costs rise in direct correlation with crude benchmarks, compressing household discretionary spending across major importing economies
- Central bank policy tension: Energy-driven inflation complicates monetary policy decisions, particularly for central banks that have already navigated difficult rate environments over recent years
- Industrial input costs: Energy-intensive manufacturing, chemical production, and logistics operations face rising cost structures that can translate into broader corporate earnings pressure
- Emerging market vulnerability: Oil-importing developing economies face the sharpest relative impact, as rising import bills widen current account deficits while limited currency buffers constrain the policy response
A 50%-plus increase in crude prices since the disruption began represents a significant and sustained inflationary impulse, one that is not easily absorbed by the demand destruction mechanisms that typically moderate commodity price spikes. When supply is restricted by a chokepoint rather than by economic conditions, the usual self-correcting mechanisms are bypassed entirely.
What Traders Are Watching: The Three-Variable Framework
For market participants attempting to position around the ongoing uncertainty, the information environment can be distilled into three primary monitoring categories:
- Diplomatic statement quality: The substantive content of communications from both Washington and Tehran, including social media posts, press briefings, and state media reports, is being parsed in near real-time. The key distinction is between statements that reflect actual negotiating progress and those that represent domestic political signalling by either party
- Physical tanker movement data: Vessel tracking through the Strait of Hormuz provides ground-truth evidence that is independent of diplomatic narratives. Resumption of normal commercial transit patterns would represent the most credible confirmation that a deal is functioning in practice, not just on paper
- US Energy Information Administration inventory data: Weekly crude stockpile figures provide a supply-side anchor for price direction during periods when diplomatic signals are ambiguous or contradictory. Continued inventory draws support higher prices regardless of negotiation status
The sophistication required to navigate this environment illustrates why the current situation represents one of the more technically demanding trading environments in recent energy market history. Participants need to simultaneously assess geopolitical credibility, physical commodity flows, and macroeconomic data, weighting each in real time as new information arrives.
Key Takeaways for Energy Market Participants
The structural conclusions that emerge from the current environment carry implications extending well beyond the immediate negotiation timeline. Analysts tracking the collapse of US-Iran talks have noted that each breakdown carries outsized consequences for global energy pricing, reinforcing why oil prices and US-Iran talks remain the central variable for market participants in 2026.
- Diplomatic signal velocity now rivals physical supply data as a price driver, with markets moving on statements within minutes of publication
- The Strait of Hormuz represents the single most important variable in global energy pricing until a credible and enforceable agreement is reached
- A price increase exceeding 50% since the disruption began reflects sustained structural supply route restriction, not a transient shock
- Record US crude exports of 5.6 million barrels per day demonstrate the adaptability of global supply systems, but cannot fully substitute for the volume and variety of Middle East flows at equivalent cost
- Any resolution must include explicit maritime access provisions to be credible enough to meaningfully unwind the embedded risk premium
- War-risk insurance surcharges will likely persist even after a formal ceasefire, meaning energy cost elevated above pre-conflict levels is probable regardless of the diplomatic outcome
Until physical tanker movements through the Strait of Hormuz independently confirm restored access, oil prices are likely to remain structurally elevated and acutely reactive to any shift in the negotiation landscape. The interplay between oil prices and US-Iran talks has created a market environment where geopolitical literacy is no longer optional for energy investors. It has become the primary analytical skill required to interpret price behaviour.
Disclaimer: This article is intended for informational purposes only and does not constitute financial or investment advice. Price levels, forecasts, and scenario projections referenced in this article are based on publicly available data and analyst commentary as of early June 2026 and are subject to rapid change. Readers should conduct their own due diligence before making any investment decisions.
Want to Stay Ahead of the Next Major Commodity Discovery Amid Global Market Volatility?
When geopolitical disruptions send energy markets into turmoil, identifying the next significant mineral discovery on the ASX can offer a compelling counterpoint for informed investors — and Discovery Alert's proprietary Discovery IQ model delivers real-time alerts the moment significant discoveries are announced, turning complex data across 30+ commodities into clear, actionable insights. Explore how historic discoveries have generated substantial returns on Discovery Alert's discoveries page, and begin your 14-day free trial today to position yourself ahead of the broader market.