July 17, 2026
The Mechanics Behind an Energy Market in Crisis
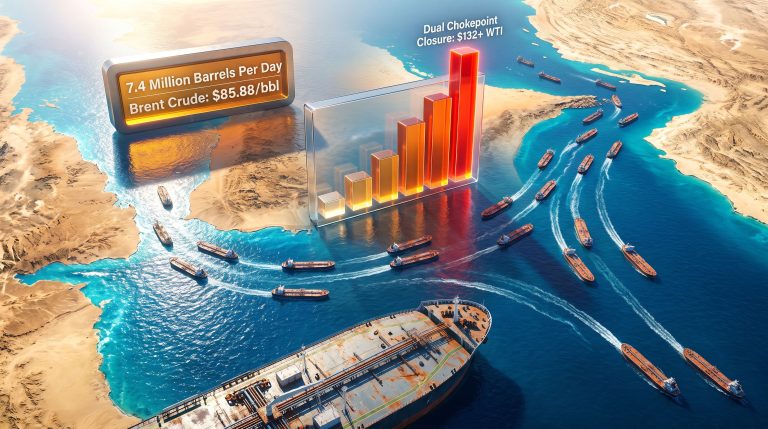
Every few decades, a geopolitical rupture forces global energy markets to reprice risk from the ground up. The 2026 US-Iran conflict is one of those rare inflection points. Unlike the gradual policy friction or diplomatic standoffs that typically produce modest price adjustments, this confrontation has struck at the physical infrastructure that underpins the movement of roughly one-fifth of the world's daily oil and liquefied natural gas supply. Understanding how oil prices on US-Iran tensions and Strait of Hormuz closure dynamics interact requires moving beyond headline figures and examining the layered mechanics of how a chokepoint crisis propagates through global energy systems.
When big ASX news breaks, our subscribers know first
Why the Strait of Hormuz Concentrates More Risk Than Any Other Maritime Passage
The Strait of Hormuz sits between the Omani coastline and Iran, measuring roughly 21 nautical miles at its narrowest navigable point. Within that corridor, two two-mile-wide shipping lanes carry a volume of energy that no pipeline network, no alternative sea route, and no combination of strategic reserves can fully replace on short notice. Under normal conditions, approximately 20% of the world's combined oil and LNG supply transits this passage daily, serving importers across Asia, Europe, and South Asia.
What makes the Strait categorically different from other chokepoints is the absence of viable alternatives at scale. The Suez Canal handles a significant share of global trade, but its energy exposure is far more diverse. The Strait of Hormuz, by contrast, is the exclusive exit point for the bulk of Gulf state oil exports. Saudi Arabia has developed the East-West Pipeline as a partial bypass, with a capacity of approximately 5 million barrels per day, but total Gulf production significantly exceeds what that single pipeline can absorb. The result is structural dependency at a level that makes any serious disruption a systemic, rather than regional, energy event.
From Closure to Crisis: How the Supply Shock Transmitted Through Global Markets
The near-total closure of the Strait beginning in late February 2026 did not immediately produce chaos. Initial inventory buffers, strategic petroleum reserve drawdowns, and the lag between physical supply loss and market repricing created a brief window of apparent stability. What followed across subsequent weeks, however, was a textbook supply shock transmission with some historically unprecedented features.
The step-by-step propagation worked as follows:
- Chokepoint restriction reduced tanker throughput dramatically, with an estimated ~1 billion barrels of oil lost from global trade flows since the closure began.
- Spot market repricing accelerated as forward supply uncertainty drove futures markets to embed a growing geopolitical risk premium above fundamental supply-demand valuations.
- Refinery feedstock constraints emerged across Asian and European refining complexes that depend heavily on Gulf sour crude grades, grades that cannot be seamlessly substituted with West African or North American alternatives due to differing sulphur content and API gravity specifications.
- Refined product tightening cascaded downstream, with diesel and jet fuel markets tightening independently of crude benchmarks as Middle East refinery output declined.
- Strategic reserve decisions forced governments in the US, China, India, and IEA member states to weigh politically sensitive release volumes against the risk of depleting buffers needed for a prolonged conflict.
One aspect rarely discussed in mainstream coverage is the crude grade substitution problem. Gulf producers export predominantly medium-sour and heavy-sour crudes. Refineries configured to process these grades cannot simply switch to light-sweet alternatives from the US or West Africa without capital expenditure on refinery modifications. This means the supply shock has a quality dimension on top of a volume dimension, making the effective disruption larger than raw barrel counts suggest. Our crude oil volatility guide explores these pricing mechanics in greater depth.
Oil Price Timeline: Escalation, Relief, and Renewed Volatility
The price trajectory across 2026 has been one of sharp escalation spikes punctuated by brief diplomatic relief rallies and subsequent re-pricing as military activity resumed. The table below maps key benchmark movements against the geopolitical triggers driving them.
| Time Period | Key Trigger | Brent Crude | WTI Crude |
|---|---|---|---|
| Late February 2026 | Strait near-total closure begins | Sharp upward trajectory | Sharp upward trajectory |
| Early March 2026 | Full supply shock materialises | Peaked at $126/bbl | Surged ~90% year-to-date, ~$100 |
| Late May 2026 | Ceasefire breakdown fears | Day peak $103.70, settled $101.12 | ~$94 |
| Late June 2026 | Peace deal; Strait partially reopens | Fell to ~$82 | ~$73 |
| July 8-9, 2026 | US ends truce; strikes resume | Jumped 5.2% to $78.02 | Up 4.9% to $73.89 |
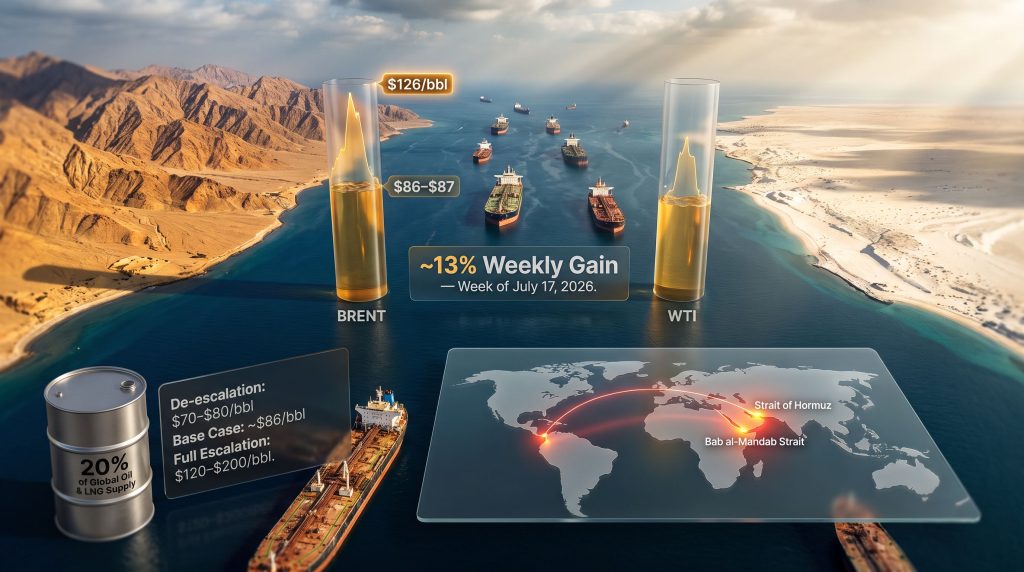
| July 17, 2026 | Dual-route threat intensifies | Trading $86-$87 range | ~$80-$81 |
Both Brent and WTI recorded weekly gains of approximately 13% in the week ending July 17, 2026. A weekly gain of this magnitude is not merely a supply-concern signal. It reflects a fundamental repricing of geopolitical risk in which market participants are revising their probability-weighted scenarios toward more severe disruption outcomes. Brent was tracking toward a third consecutive weekly gain, while WTI was positioned for its second straight weekly advance.
The June peace deal price collapse is instructive in its own right. Brent shed more than $20 per barrel within days of the announcement, falling sharply from above $100 to approximately $82. Yet energy economists cautioned consistently that restoring pre-crisis supply levels would require months of uninterrupted Strait operations, meaning the price decline reflected a compression of the tail-risk premium rather than any restoration of physical supply fundamentals. The subsequent re-escalation in July validated that assessment. This oil market disruption pattern mirrors dynamics seen in prior geopolitical flashpoints.
The Hidden Crisis: Record Diesel Margins and Downstream Market Stress
Crude oil benchmark movements command most media attention, but the more structurally revealing signal from this crisis has emerged in refined products markets. Low-sulphur gasoil futures reached a record spread of $66.25 over Brent crude as of July 17, 2026. This figure deserves careful unpacking because it signals something beyond a crude supply disruption.
Several compounding factors are driving this record margin:
- The Middle East is a primary global diesel exporter. Conflict-related disruptions to refinery infrastructure across the Gulf have removed significant processing capacity from the market, tightening refined product supply independently of crude availability.
- Direct attacks on oil refinery infrastructure have reduced throughput at facilities that would normally convert Gulf crude into diesel destined for Asian and European markets.
- Rerouted Saudi crude exports, previously flowing through Hormuz and now redirected through Red Sea corridors, have increased tanker traffic density in the Red Sea, elevating exposure to Houthi interdiction risk along that alternative route simultaneously.
What this means for consumers: A diesel margin of this magnitude transmits through virtually every cost structure in a modern economy. Road freight, agricultural machinery, construction equipment, and industrial logistics all run on diesel. When refining margins expand to record levels, the cost shock does not remain contained in energy markets. It migrates into food prices, manufactured goods, and logistics costs across multiple sectors simultaneously. Furthermore, this broader market volatility reset is affecting asset classes well beyond energy.
The Red Sea Compounding Threat: When the Backup Route Is Also Blocked
The strategic logic behind the reported Iranian pressure on Houthi forces to close the Bab al-Mandab Strait is straightforward. Saudi Arabia and other Gulf producers developed Red Sea routing through the East-West Pipeline precisely as an alternative to Hormuz transit. If both chokepoints are restricted concurrently, the bypass mechanism that has partially cushioned the Hormuz closure is eliminated.
As Commerzbank analysts assessed in their market commentary, a blockade of the Bab al-Mandab Strait in the context of further escalation would be expected to drive oil prices materially higher from already-elevated levels. The arithmetic of that scenario is stark: Saudi rerouted export volumes that have been sustaining partial supply to Asian buyers would lose their alternative pathway, and the global diesel tightening already observed would accelerate further.
Transit through the Red Sea increased substantially from the onset of the Iran conflict precisely because of this rerouting dynamic. That increased traffic density has itself elevated the strategic value of Houthi interdiction capacity in the corridor, creating a feedback loop between the two chokepoint threats.
The next major ASX story will hit our subscribers first
Gulf State Infrastructure Damage: A Dimension Beyond Tanker Traffic
The conflict's impact on energy markets extends beyond tanker interdiction into direct attacks on physical energy and utility infrastructure:
- Kuwait sustained an Iranian strike on a power generation and water desalination facility, demonstrating that the conflict's energy consequences include domestic power security in Gulf states, not just export disruption.
- Qatar saw its defence forces intercept an Iranian missile, with civilian injury reported from interception debris, placing LNG export infrastructure proximity to active conflict in sharp focus.
- Syria became the site of the first Iranian direct strike on US facilities in that territory, expanding the geographic footprint of the conflict beyond Gulf waters.
Qatar's particular exposure carries outsized global significance. As the world's largest LNG exporter, any sustained threat to Qatari infrastructure or transit routes would cascade beyond oil markets. In addition, disruptions to global LNG supply chains would ripple into European gas import security, Asian spot LNG pricing, and electricity generation cost structures across multiple continents.
Decomposing the Oil Price: What Is Fundamentals vs. What Is Fear
Energy economists assessing the current oil prices on US-Iran tensions and Strait of Hormuz closure dynamics, with Brent around $86-$87, have been working to decompose how much of that level reflects genuine physical supply loss versus uncertainty premium. A useful analytical framework breaks the current price into three components:
| Price Component | Estimated Contribution | Driver |
|---|---|---|
| Fundamental supply-demand value | ~$65-$70/bbl | Pre-conflict demand and non-Gulf supply baseline |
| Logistics disruption premium | ~$10-$15/bbl | Physical supply shortfalls and rerouting costs |
| Geopolitical uncertainty premium | ~$5-$10/bbl | Tail-risk pricing for further escalation scenarios |
This decomposition explains a critical market dynamic: even during periods of partial diplomatic progress, prices remain elevated. The uncertainty premium does not compress to zero until the underlying conflict is resolved, not merely paused. This is why the June peace deal produced a $20 decline rather than a return to pre-war baselines, and why the subsequent re-escalation in July drove prices back toward the $86-$87 range rather than to March's $126 peak.
The IEA's Executive Director Fatih Birol stated publicly at a Council on Foreign Relations event in Washington that oil security remains a critical concern, and that the situation warrants serious worry if conditions do not improve over the following weeks. Institutional-level concern of this nature from the world's foremost energy security watchdog is a meaningful signal, not routine commentary.
2026 vs. Historical Hormuz Crises: Why This One Is Structurally Different
Historical comparisons provide useful context but carry important limitations. The 2026 disruption differs from prior Hormuz crisis events in its combination of kinetic intensity, duration, and physical supply loss volume.
| Crisis Event | Duration | Supply Impact | Peak Price Response |
|---|---|---|---|
| 1973 Arab Oil Embargo | ~6 months | ~4-5 mb/d reduction | Prices roughly quadrupled |
| 1980-1988 Iran-Iraq Tanker War | Years | Periodic disruptions | Volatile but managed |
| 2019 Strait Tensions | Weeks | Minimal physical disruption | ~4-5% spike |
| 2026 US-Iran Conflict | Feb-Jul 2026 (ongoing) | ~1 billion barrels lost from trade | Brent peaked at $126/bbl |
The 1973 embargo is frequently cited as the closest historical analogue, but the structural differences are significant. The 1973 event was a politically coordinated export restriction by producing nations with full control over their own output decisions. The 2026 disruption is a kinetic military conflict affecting physical infrastructure, tanker navigation safety, and refinery operations simultaneously. Worst-case scenario modelling has placed potential price ceilings at $200 per barrel under a sustained dual-chokepoint closure, representing a disruption estimated at up to three times the severity of the 1970s embargo by some analyst frameworks.
Forward Price Scenarios: Three Pathways Through 2026-2027
| Scenario | Conditions Required | Brent Outlook |
|---|---|---|
| De-escalation / Resolution | Ceasefire restored; Strait fully reopened | Stabilises at $70-$80/bbl by Q4 2026 |
| Base Case (Current Trajectory) | Intermittent hostilities; partial Strait access | Averages ~$86/bbl through 2026; ~$70/bbl in 2027 |
| Full Escalation | Bab al-Mandab closure + sustained Hormuz blockade | Potential spike toward $120-$200/bbl |
The variables most likely to determine which pathway materialises include:
- Whether Iranian pressure successfully closes Red Sea routing through the Bab al-Mandab Strait
- The pace and scope of continued US military operations targeting Iranian military capacity
- Whether Qatari LNG infrastructure sustains direct damage, triggering a parallel gas market crisis
- The scale and coordination of strategic petroleum reserve releases among the US, China, and IEA member states
- OPEC market influence and production response capacity from non-affected members including Saudi Arabia, the UAE, and Iraq
Frequently Asked Questions
What percentage of global oil flows through the Strait of Hormuz?
Approximately 20% of the world's combined daily oil and LNG supply transits the Strait of Hormuz under normal conditions, making it the single most strategically significant energy chokepoint on the planet.
Why didn't prices return to pre-war levels after the June 2026 peace deal?
Even after the Strait partially reopened, analysts noted that restoring pre-crisis supply chains would require months of uninterrupted operations. The June price decline reflected a reduction in tail-risk pricing, not a restoration of physical supply. When the US resumed strikes in early July, the uncertainty premium re-expanded rapidly.
What is a geopolitical risk premium and how large is it currently?
A geopolitical risk premium is the price increment above fundamental supply-demand value that markets assign to reflect conflict-related supply uncertainty. In the current crisis, this premium is estimated at approximately $5-$10 per barrel above the physical disruption premium already embedded in prices.
Why do diesel margins matter more than crude prices in some respects?
Diesel margin expansion to record levels signals that the supply shock has penetrated the refined products market, not just crude. This matters because diesel price increases transmit inflation through road freight, agriculture, and manufacturing in ways that crude benchmark movements alone do not fully capture. The Energy Information Administration provides ongoing data tracking these downstream market movements for those monitoring the situation closely.
How does the Bab al-Mandab threat compound the Hormuz crisis?
Saudi Arabia and other Gulf producers rerouted crude through Red Sea corridors via the East-West Pipeline after Hormuz restrictions began. If Iranian pressure succeeds in closing the Bab al-Mandab Strait, this alternative routing is eliminated, removing the primary bypass mechanism and significantly intensifying the oil prices on US-Iran tensions and Strait of Hormuz closure impact on global supply constraints.
Disclaimer: This article contains forward-looking analysis, scenario projections, and price forecasts sourced from publicly available institutional and analyst commentary. These projections involve significant uncertainty and should not be construed as investment advice. Commodity markets are subject to rapid change based on geopolitical, policy, and macroeconomic developments. Readers should conduct their own research and consult qualified financial advisors before making investment decisions.
Want to Position Yourself Ahead of the Next Major Resource Discovery?
While geopolitical shocks like the US-Iran conflict reshape global energy markets, significant mineral discoveries on the ASX can offer compelling opportunities for investors seeking exposure beyond traditional commodities — Discovery Alert's proprietary Discovery IQ model delivers real-time alerts the moment significant ASX mineral discoveries are announced, turning complex data across 30-plus commodities into clear, actionable insights. Explore historic discovery returns on Discovery Alert's dedicated discoveries page and begin your 14-day free trial to ensure you're positioned ahead of the broader market.