
July 13, 2026
Crude Oil Markets at a Crossroads: Understanding the Forces Pushing Prices Higher in 2026
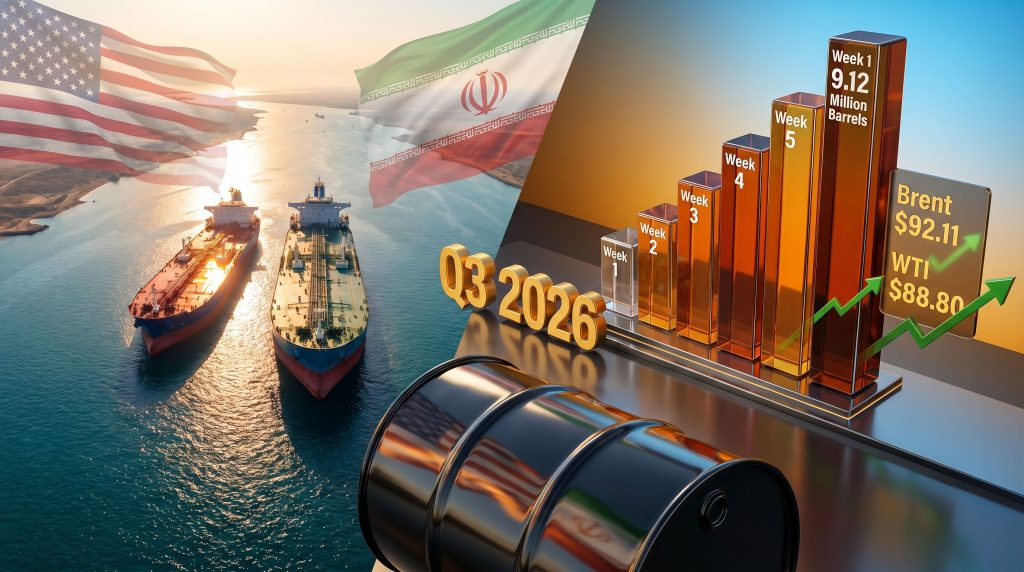
Global commodity markets rarely move in straight lines, but when multiple independent risk factors converge simultaneously, the directional pressure they generate can be both powerful and self-reinforcing. That is precisely the dynamic playing out in crude oil markets as of June 2026. Two distinct forces, each capable of driving prices higher on its own, are now operating in parallel: an active military conflict threatening one of the world's most critical shipping corridors, and a sustained depletion of physical crude oil inventories inside the United States. Together, they are reshaping the near-term trajectory of oil prices on US-Iran tensions and shrinking US crude stockpiles in ways that deserve careful, layered analysis.
When big ASX news breaks, our subscribers know first
The Dual-Catalyst Structure: When Geopolitical Risk Meets Physical Tightness
Most oil price rallies are driven by a single dominant theme. A production cut from OPEC+, a demand surge from recovering economies, or a geopolitical flashpoint will typically move prices for a defined period before the market rebalances. What makes the current environment unusual is that two structurally different forces are operating at the same time, each amplifying the other's effect.
The first force is a geopolitical risk premium: the additional price component that traders embed into futures contracts when there is a credible probability of conflict-related supply disruption. The second force is physical inventory depletion: a measurable reduction in the actual barrels stored in US commercial crude facilities, which signals that the real-world balance between supply and demand is tightening.
In isolation, either factor produces moderate upward pressure. When they coincide, however, the market response is non-linear. Tight physical supply removes the buffer that would normally absorb a geopolitical shock, while elevated conflict risk raises the probability that an already-tight market gets materially tighter. The result is a feedback loop: hedging demand increases, speculative positioning tilts bullish, and prices overshoot what either factor alone would justify.
Where Prices Stand as of June 10, 2026
The numbers themselves tell a clear story. Brent crude futures reached $92.11 per barrel during early Asian trading on June 10, 2026, representing a 0.7% intraday gain of 66 cents. WTI crude tracked the same trajectory, reaching $88.80 per barrel, also up 0.7% on the session. Critically, this recovery followed a seven-week low touched in the prior trading session, meaning the market had briefly sold off before the latest escalation news reversed the move.
Commodity strategists at ING flagged that upside risk to prices is elevated, particularly heading into Q3 2026, which historically represents a period of stronger seasonal oil demand driven by Northern Hemisphere summer consumption patterns. For a broader picture of how these figures fit into longer-term patterns, crude oil price trends provide useful context for understanding where markets may be headed.
"The oil market is not just pricing in today's supply reality. It is pricing in the probability distribution of what supply could look like across multiple conflict scenarios, weighted by how little buffer currently exists to absorb a negative outcome."
The Strait of Hormuz: Why One Waterway Holds the World's Energy System Hostage
To understand why US-Iran tensions are so consequential for global oil markets, it is necessary to understand the physical geography of crude oil trade. The Strait of Hormuz is a narrow passage connecting the Persian Gulf to the Gulf of Oman, and it is the single most important maritime chokepoint in the global energy system.
| Metric | Data Point |
|---|---|
| Share of global crude oil transiting Hormuz | Approximately 20% of world supply |
| LNG volumes transiting Hormuz | Significant share of global liquefied natural gas trade |
| Current status (June 2026) | Partial blockade maintained by Tehran |
| US countermeasure | Blockade imposed on Iranian ports |
| US Energy Secretary assessment | Ship traffic and oil exports through Hormuz described as rising despite the ongoing conflict |
The critical detail here is the word partial. Tehran has maintained a partial blockade of Hormuz shipping, not a full closure. That distinction matters enormously for pricing. A full Hormuz closure, blocking roughly one-fifth of global crude supply simultaneously, would represent one of the most severe supply shocks in modern energy market history, with price implications well above current levels.
What traders are pricing is not the current partial disruption in isolation. They are pricing in the tail risk of escalation to a full closure, weighted by how unstable the existing situation appears. Even a relatively low probability of full closure, applied to the scale of supply it would affect, generates a meaningful risk premium. Furthermore, the geopolitical oil price risks surrounding this region extend well beyond the immediate conflict timeline.
The Escalation Sequence That Reset Trader Sentiment
The sequence of events driving the latest risk premium repricing unfolded rapidly:
- A US Apache attack helicopter was downed, with the incident attributed to Iranian forces.
- US President Trump publicly committed to retaliatory action on June 9, 2026.
- US military strikes on Iranian targets were executed on June 10, 2026.
- Tehran issued a conditional threat to resume full hostilities, linking its posture to Israeli military operations against Hezbollah in Lebanon.
That fourth point adds a secondary escalation dimension that many market participants may underestimate. The conflict is not a bilateral US-Iran dispute operating in isolation. It is entangled with Israel's ongoing campaign against Hezbollah, which means the ceasefire framework has multiple failure modes. Tehran's position essentially creates a tripwire: continued Israeli operations in Lebanon could trigger Iranian re-escalation regardless of progress in US-Iran diplomatic negotiations.
Phillip Nova senior market analyst Priyanka Sachdeva noted that despite ongoing diplomatic engagement, the latest military exchanges had reintroduced a geopolitical risk premium that had partially unwound during the brief ceasefire period. That partial unwinding and re-pricing dynamic is itself instructive: it shows how quickly risk premiums can evaporate when tensions cool, and equally how quickly they return when fresh escalation occurs.
Scenario Framework: Three Conflict Pathways and Their Price Implications
| Scenario | Description | Estimated Brent Price Impact |
|---|---|---|
| De-escalation | Ceasefire holds; diplomatic framework advances | Risk premium fades; prices pull back toward $85-$87 range |
| Contained Conflict | Sporadic strikes continue; Hormuz remains partially open | Risk premium persists; Brent holds $90-$95 range |
| Full Escalation | Hormuz fully closed; regional conflict widens materially | Severe supply shock; prices with potential to significantly exceed $100 |
Eight Consecutive Weeks: What the US Inventory Drawdown Is Really Signalling
While geopolitical events dominate headlines, the sustained depletion of US crude stockpiles represents an equally important market force. Weekly inventory data from the American Petroleum Institute is one of the most closely watched leading indicators in global commodity markets, because US storage levels function as a real-time proxy for the broader global supply-demand balance.
The data for the week ended June 5, 2026 showed that US crude oil inventories fell by 9.12 million barrels, according to sources citing API figures. Gasoline inventories declined by an additional 1.19 million barrels in the same reporting period. Most significantly, this marked the eighth consecutive weekly decline in US crude stockpiles, a pattern that is statistically rare and operationally meaningful. According to EIA global oil market data, such sustained drawdown periods carry significant implications for the broader supply outlook.
"Eight consecutive weeks of inventory draws does not happen by coincidence. It reflects a structural imbalance between the rate at which crude is entering the US supply system and the rate at which it is being consumed or exported. The physical market is sending a sustained signal."
Adding further weight to this trend, separate research data indicates that one individual weekly draw during this period reached approximately 17.8 million barrels, described as among the largest single-week inventory declines recorded in over four decades. Single-week draws of that magnitude are genuinely rare events in the historical EIA dataset and, when they occur, they tend to produce outsized reactions in futures markets.
The US as a Marginal Global Supplier: An Underappreciated Feedback Loop
One aspect of the current inventory story that receives less attention than it deserves is the role the United States has been playing as a marginal supplier of crude and petroleum products to global markets during the US-Iran conflict period. With Middle Eastern supply routes constrained, US exports to both Asia and Europe have increased, helping to partially offset the tighter regional supply picture.
The problem is that this export role is not sustainable if domestic inventories keep declining. Lower US stockpiles constrain export capacity, which removes one of the key buffers that has been moderating global supply tightness. The feedback loop runs as follows:
- US crude inventories fall for eight consecutive weeks.
- Export capacity from the US becomes constrained as domestic supply tightens.
- Global buyers reliant on US crude face reduced availability.
- Tighter global supply pushes international benchmark prices higher.
- Higher prices further incentivise US producers to prioritise domestic margins over export volume.
This dynamic is compounded by the strategic reality that US Strategic Petroleum Reserve levels have been drawn down in prior years, limiting the government's capacity to buffer against external supply shocks through emergency releases.
Inventory Drawdown in Historical Context
| Metric | Current Period (2026) | Historical Context |
|---|---|---|
| Consecutive weekly draws | 8 weeks | Rare; signals sustained demand/supply imbalance |
| Single-week peak draw | ~17.8 million barrels | Among the largest in 40+ years |
| Gasoline inventory trend | Also declining | Reinforces demand-side consumption strength |
| SPR buffer availability | Reduced from prior drawdowns | Diminished shock-absorption capacity |
The Q3 2026 Problem: Why Timing Amplifies Everything
There is a seasonal dimension to this story that transforms a serious situation into a potentially critical one. ING commodity strategists specifically highlighted Q3 2026 as a period of seasonally stronger oil demand, driven primarily by Northern Hemisphere summer driving patterns and elevated industrial activity. Historically, Q3 represents the peak consumption quarter for gasoline and distillate fuels across the US, Europe, and parts of Asia.
When markets enter a high-demand seasonal window carrying already-low inventories and an active geopolitical risk premium, the conditions for price spikes are structurally present. Seasonal demand increases the rate of inventory drawdown, which further tightens the physical market, and consequently amplifies the impact of any additional supply disruption from the geopolitical side.
For global consumers, this timing creates a straightforward but uncomfortable arithmetic: fuel price pressures are likely to intensify through mid-to-late 2026 unless either the diplomatic situation resolves or a meaningful inventory rebuild occurs. Neither appears imminent based on current data.
Regional Exposure: Who Bears the Highest Cost of This Oil Price Environment
The consequences of elevated crude prices are not distributed evenly across the global economy. The oil market trade war impact adds yet another layer of complexity to how different regions are absorbing these pressures.
- Europe is navigating compounding energy security pressures following earlier supply disruptions linked to Russian energy. Higher oil import costs add a new layer of inflationary pressure to economies already managing elevated energy expenditure.
- Asian importers including China, India, Japan, and South Korea collectively represent some of the world's largest crude import volumes. A sustained move higher in Brent directly increases their import bills, with knock-on effects for trade balances and domestic inflation.
- Middle Eastern producers outside Iran occupy an ambiguous position: they benefit from elevated prices as exporters but face real exposure to regional instability that could affect their own production and export infrastructure.
- The United States presents a split picture: domestic consumers face higher fuel costs at a time when inflation sensitivity remains elevated, while upstream producers operating at higher price points see improved margins and cash flows.
The next major ASX story will hit our subscribers first
Five Variables That Will Determine Where Oil Prices Go Next
The forward trajectory of crude prices hinges on a small number of critical market variables, each of which could shift the balance materially in either direction.
- Ceasefire durability: Whether the fragile US-Iran military pause holds or deteriorates into renewed sustained conflict will be the single largest determinant of the risk premium component.
- Hormuz shipping volumes: Real-time tanker transit data through the Strait provides the most direct leading indicator of whether the partial blockade is tightening or easing.
- Weekly EIA inventory reports: The official US Energy Information Administration figures, released each Wednesday, will confirm or challenge whether the eight-week drawdown trend is continuing.
- OPEC+ production response: OPEC's market influence remains a pivotal variable, as major producing nations retain the capacity to increase output in response to tighter market conditions, though their willingness and available spare capacity vary.
- Q3 demand materialisation: Whether actual summer consumption data matches or exceeds seasonal forecasts will determine how quickly inventory levels recover, or how much further they fall.
Conditions Required for a Price Reversal
For oil prices to move meaningfully lower from current levels, at least one of the following would need to materialise:
- A credible and verifiable diplomatic breakthrough between Washington and Tehran that removes the Hormuz disruption risk.
- Normalisation of tanker transit volumes through the Strait, demonstrating physical supply flows recovering.
- A surprise positive inventory build in weekly US crude data, signalling the drawdown trend has reversed.
- Evidence of demand destruction, where sustained high prices begin feeding back into reduced consumption, particularly in price-sensitive emerging market economies.
Key Market Drivers: Current Status Summary
| Driver | Current Status | Price Direction |
|---|---|---|
| US-Iran military tensions | Active escalation confirmed June 2026 | Bullish |
| Strait of Hormuz disruption | Partial blockade in place | Bullish |
| US crude inventory trend | 8 consecutive weekly draws | Bullish |
| Seasonal demand outlook (Q3) | Historically strong period approaching | Bullish |
| Diplomatic progress | No imminent deal visible | Bullish |
| Potential ceasefire resolution | Fragile; conditional on Lebanon/Hezbollah dynamics | Bearish if achieved |
"The convergence of active conflict risk, sustained inventory depletion, and approaching peak seasonal demand creates a structural environment where the path of least resistance for crude prices remains upward. The key question is not whether prices will face upward pressure, but how much additional capacity for escalation or tightening exists before that pressure becomes a genuinely disruptive supply shock."
Analysts reviewing the current crude oil market broadly agree that the oil prices on US-Iran tensions and shrinking US crude stockpiles dynamic is among the most complex multi-variable environments seen in recent years. As reported by CNN, the intersection of military escalation, SPR considerations, and the broader supply picture is placing decision-makers under considerable pressure. The oil prices on US-Iran tensions and shrinking US crude stockpiles narrative is therefore not merely a short-term trading story — it carries meaningful implications for energy policy and macroeconomic stability well into the second half of 2026.
Frequently Asked Questions: Oil Prices, US-Iran Tensions, and US Crude Inventories
Why did oil prices rise following US military strikes on Iran?
Markets repriced supply disruption probability higher following the confirmed military exchange. The primary concern is interference with Middle Eastern crude flows through the Strait of Hormuz, which handles approximately one-fifth of global oil supply. When the probability of disruption to that volume increases, futures traders embed a higher risk premium into prices immediately.
What would a full Strait of Hormuz blockade do to oil prices?
A partial disruption, as currently exists, supports prices in the $90-$95 Brent range. A full closure removing 20% of global supply simultaneously would represent an extreme supply shock with potential to push prices well above $100 per barrel, with the severity depending on how quickly alternative routes and emergency reserves could be mobilised.
How large was the most recent US crude inventory drawdown?
API data for the week ended June 5, 2026 recorded a decline of 9.12 million barrels, marking the eighth consecutive weekly draw. Separate data indicates a single-week draw of approximately 17.8 million barrels was recorded during this stretch, one of the largest in over four decades.
What is a geopolitical risk premium and how is it measured?
It is the additional price component embedded in crude futures contracts that reflects traders' collective assessment of conflict-related supply disruption probability. It manifests in options market skew, futures positioning data, and the spread between spot prices and longer-dated contracts. It is not directly observable as a single number but can be inferred from price behaviour during and after conflict events.
Will oil prices continue rising through the rest of 2026?
This depends heavily on whether the US-Iran ceasefire framework stabilises or deteriorates further, whether Hormuz shipping volumes normalise, and whether US inventories begin recovering. The Q3 seasonal demand window represents the highest-risk period for further price acceleration. Readers should treat any forward price projections as conditional scenarios rather than forecasts, as geopolitical outcomes remain deeply uncertain.
Disclaimer: This article is intended for informational purposes only and does not constitute financial or investment advice. Oil price projections, scenario analyses, and forward-looking statements involve significant uncertainty. Readers should conduct independent research before making any investment decisions related to energy commodities or related equities.
Want to Capitalise on the Next Major Commodity Discovery Before the Market Moves?
While crude oil markets navigate the complex interplay of geopolitical risk and physical supply tightness, Discovery Alert's proprietary Discovery IQ model delivers real-time alerts on significant ASX mineral discoveries across more than 30 commodities, turning complex market data into actionable investment insights. Explore how historic discoveries have generated extraordinary returns on Discovery Alert's dedicated discoveries page, and begin your 14-day free trial today to position yourself ahead of the broader market.