July 24, 2026
Oil Prices on US-Iran War Escalation: How a Four-Year High Is Reshaping Global Energy Markets
Energy markets have always absorbed geopolitical shocks, but not all shocks are equal. Some produce sharp, temporary dislocations that resolve within days or weeks. Others introduce something far more durable: a structural repricing of risk that rewrites the assumptions embedded in every futures contract, every hedging strategy, and every sovereign energy budget. The latter is what the world is witnessing in 2026, as oil prices on US-Iran war escalation continue to reshape the global energy landscape.
When big ASX news breaks, our subscribers know first
A Conflict That Changed the Risk Calculus Overnight
When hostilities between the United States and Iran commenced on February 28, 2026, energy markets did not simply react to an event. They began reassessing a foundational assumption that had underpinned crude oil pricing for decades: that Persian Gulf supply, however strained by regional tensions, would ultimately flow. That assumption no longer holds with the same confidence it once did.
What separates this conflict from prior Middle East disruptions is its multi-node character. The 2019 Aramco drone strikes temporarily removed approximately 5% of global supply from a single site and were resolved within weeks. The current conflict, however, has exposed production and export infrastructure across Saudi Arabia, the UAE, Qatar, and Iraq to intermittent disruption simultaneously. When multiple nodes within the same supply corridor face stress at once, the market cannot rely on internal redistribution within the region to buffer the impact.
Furthermore, futures curves extending far beyond spot delivery now reflect something traders read as a structural signal: physical tightness persisting over the medium term. When forward contracts embed supply constraint expectations rather than speculative sentiment, the market is telling participants that the problem is real and that resolution is not imminent. Oil trade and geopolitics has rarely produced such a pronounced and simultaneous multi-node disruption in the modern era.
The Price Journey: From $63 to $126 in Two Months
The speed and scale of oil price movement since late February 2026 is among the most compressed escalations in recent energy market history. The table below illustrates the trajectory across both major benchmarks.
| Benchmark | Pre-Conflict Baseline (Feb 2026) | Peak Price (Apr 30, 2026) | Approximate Change |
|---|---|---|---|
| Brent Crude | ~$63–65/bbl | $126.41/bbl | ~+95% |
| WTI Crude | ~$58–60/bbl | $110.93/bbl | ~+90% |
| WTI (Mar 6 surge) | ~$66.76/bbl | $90.13/bbl | +35% (7-day move) |
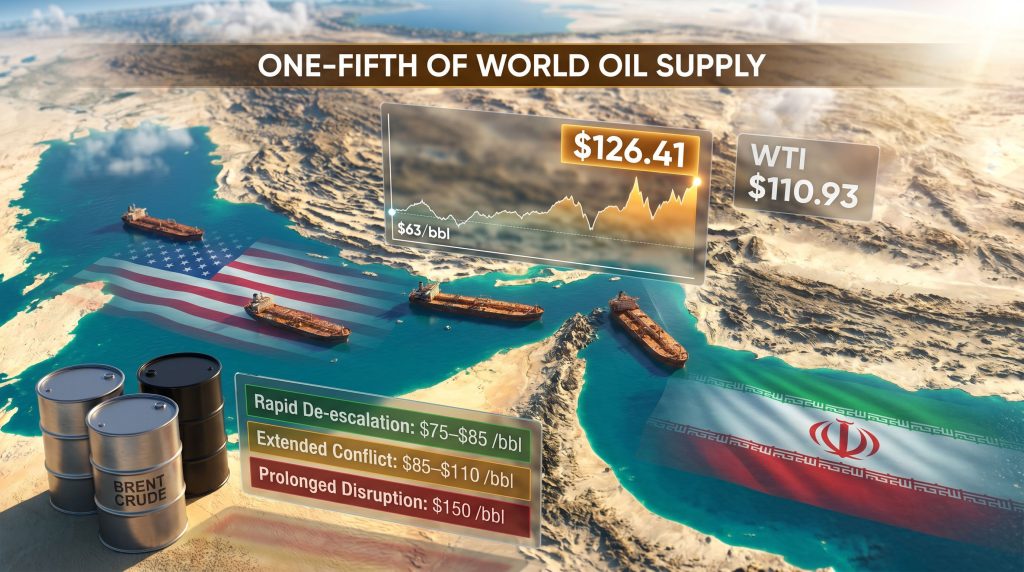
On April 30, 2026, Brent crude touched an intraday high of $126.41 per barrel, the highest level recorded since March 9, 2022. That four-year record was not driven by surging demand or an inventory draw. It was driven almost entirely by the fear of sustained physical supply loss from the world's most critical energy corridor.
What followed within hours was equally instructive. Brent retreated to $116.50 per barrel by 1:47 p.m. Saudi time, a swing of nearly $10 within a single trading session. Two large sell orders for June Brent contracts were executed shortly before 11:30 a.m. Saudi time, according to trader reports and LSEG data cited by Reuters. The reversal was amplified by the technical reality that the June Brent contract was expiring that same day, meaning position unwinding accelerated the downward momentum.
Iran's supreme leader issued a statement suggesting that the new management of the Strait of Hormuz would produce stability and economic benefit for Gulf nations, which partially steadied sentiment following the spike. However, prices later dropped without any single obvious catalyst prior to this statement, suggesting that institutional profit-taking played an independent role in the intraday reversal.
"The April 30 price action offers a precise illustration of how geopolitical intelligence and technical market mechanics can interact to produce extreme intraday volatility, independent of any change in the physical supply situation."
Why the Strait of Hormuz Is the Fulcrum of Global Oil Pricing
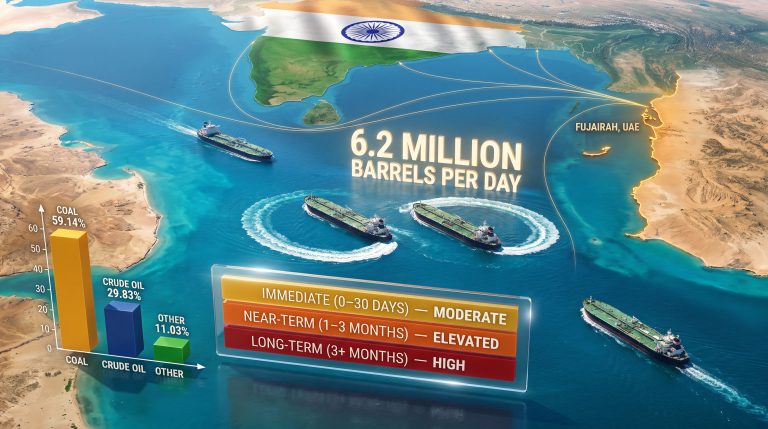
No piece of geography carries more weight in global energy markets than the Strait of Hormuz. This narrow waterway connecting the Persian Gulf to the Gulf of Oman serves as the sole maritime export route for five of the world's largest oil and gas producers: Saudi Arabia, Iraq, the UAE, Kuwait, and Qatar. Approximately one-fifth of the world's combined oil and liquefied natural gas supply transits through this passage annually.
The critical distinction between a Hormuz disruption and most other supply shocks is the absence of realistic short-term alternatives. When a pipeline is damaged, production can often be rerouted. When a terminal is struck, tankers can be redirected. But when the Strait itself is effectively constrained, there is no parallel corridor that can absorb the volume loss quickly enough to prevent price escalation. Disruptions to global LNG supply are consequently amplified far beyond what any single production outage would ordinarily produce.
The current disruption is operating through three simultaneous channels:
- Direct production losses resulting from damage to or operational restriction of regional production and processing facilities
- Transportation interruptions preventing tanker transit through affected zones
- Insurance and war-risk premium escalation making passage economically prohibitive for a subset of operators, effectively removing capacity from the market even without physical interdiction
Each mechanism independently constrains throughput. Together, they are estimated to be affecting somewhere between 15% and 20% of global oil supply at present levels of disruption. No strategic petroleum reserve release programme in any major consuming nation has the scale to offset a supply gap of this magnitude for more than a matter of weeks.
Beyond crude oil, the Strait of Hormuz crisis has created cascading disruptions across supply chains that most observers would not immediately associate with Middle East conflict. Global sugar supplies, helium production critical for semiconductor fabrication and medical imaging equipment, and aluminium supply chains dependent on energy-intensive smelting have all been disrupted. The ongoing helium supply crisis adds a further layer of complexity to industries that had little reason to monitor Middle East geopolitics previously. The economic damage is therefore not confined to fuel prices — it is threading through manufacturing, healthcare, electronics, and food logistics simultaneously.
The Intelligence-Market Feedback Loop on April 30
How Unverified Reports Move Markets
One of the more consequential dynamics to emerge from the April 30 price spike involves the relationship between unverified intelligence reporting and immediate market response. Late on April 29, 2026, a report from Axios, citing unidentified sources, indicated that President Donald Trump was scheduled to receive a briefing on potential military strike options against Iran, designed to pressure Tehran toward renewed nuclear negotiations.
This single unconfirmed report was sufficient to drive Brent crude toward its $126.41 intraday peak. No confirmed military action occurred. No official statement was released. Yet the market treated the intelligence report as a material risk event, repricing contracts across the curve within hours.
This episode illustrates a structural feature of conflict-era oil markets that is rarely articulated clearly: in an environment where physical supply is already constrained and upside price risk is asymmetric, unverified intelligence reports carry near-equivalent market weight to confirmed events. The threshold for a bullish reaction drops dramatically when the baseline supply situation is already precarious.
The institutional sell orders that followed shortly before 11:30 a.m. Saudi time on April 30 suggest that sophisticated participants used the intelligence-driven spike to exit long positions at or near peak valuations — a pattern consistent with profit-taking during volatility rather than a fundamental reassessment of conflict risk.
Three Scenarios: Where Oil Prices Go From Here
Analyst projections for the path of crude oil prices are organised around three conflict resolution scenarios, each with meaningfully different price implications.
Scenario 1: Rapid De-escalation (2 to 4 Weeks)
- Projected Brent range: $75 to $85 per barrel
- Conditions required: Ceasefire agreement, resumption of full Hormuz transit, diplomatic re-engagement on Iran's nuclear programme
- Market implication: Sharp downside correction as geopolitical risk premium unwinds; OPEC+ spare capacity re-enters the demand calculus
Scenario 2: Extended Regional Conflict (6 to 12 Weeks)
- Projected Brent range: $85 to $110 per barrel
- Conditions: Continued military operations without full Hormuz closure; partial supply restoration from non-Gulf producers
- Market implication: Sustained elevated prices with periodic volatility spikes; oil-importing central banks face stagflationary pressure combining slow growth with accelerating energy-driven inflation
Scenario 3: Prolonged Conflict with Full Supply Disruption
- Projected Brent ceiling: $150 per barrel
- Conditions: Conflict duration exceeding three months; Hormuz remains effectively closed; strategic petroleum reserves in consuming nations approach depletion
- Market implication: Global recession risk escalates materially; coordinated emergency releases from the International Energy Agency become the likely policy response
"Energy market analysts have noted that forward contracts in the current environment reflect genuine physical tightness rather than speculative momentum, suggesting that price pressure may persist for longer than initial market consensus anticipated."
The risk distribution across these scenarios is asymmetric. The downside under rapid de-escalation is approximately 33% to 40% from the April 30 peak. The upside under prolonged disruption is a further 29% from that same level. This asymmetry reflects a fundamental characteristic of supply-shock driven oil markets: the cost of being wrong on the bearish side is substantially greater than the cost of being wrong on the bullish side. Consequently, oil market disruption risks of this scale demand careful scenario planning from both market participants and policymakers alike.
The next major ASX story will hit our subscribers first
Economic Transmission: Beyond the Fuel Pump
The most visible consumer-level impact of rising oil prices on US-Iran war escalation dynamics has been at the fuel pump. US gasoline prices have risen approximately 10% in recent weeks, with average prices in affected markets reaching around $4.39 per gallon. However, the economic transmission of this shock extends far beyond retail fuel costs.
| Sector | Primary Impact | Secondary Effect |
|---|---|---|
| Transportation & Logistics | Diesel and jet fuel cost surge | Consumer goods price inflation across all categories |
| Manufacturing | Energy input cost escalation | Margin compression, capital expenditure deferral |
| Semiconductors | Helium supply disruption | Production bottlenecks affecting consumer electronics |
| Medical Equipment | Helium and aluminium shortages | Healthcare cost pressure and procurement delays |
| Food & Retail | Logistics cost pass-through | Broad acceleration in consumer price indices |
| Aviation | Jet fuel surcharge reintroduction | Higher air travel and air freight costs |
Aviation carriers are reintroducing fuel surcharges that had been withdrawn during lower-price periods, raising the cost of both passenger travel and air cargo. Diesel price escalation is flowing directly into trucking, last-mile delivery, and cold-chain logistics, creating a secondary inflation layer across consumer goods categories that extends well beyond anything visible at the petrol station.
The helium disruption deserves particular attention because it is not widely understood as an oil-war consequence. Helium, primarily sourced from natural gas processing in the Persian Gulf region, is non-substitutable in semiconductor manufacturing and medical MRI operations. Production bottlenecks in this area carry downstream consequences for industries that most observers would not associate with Middle East geopolitics.
Benchmarking 2026 Against History's Most Severe Oil Shocks
Context matters when assessing the severity of the current disruption. The table below places the 2026 US-Iran conflict alongside the most significant oil supply shocks of the past five decades.
| Event | Duration | Peak Price Impact | Estimated Supply Disruption |
|---|---|---|---|
| 1973 Arab Oil Embargo | ~6 months | ~+300% | ~7% of global supply |
| 1990 Gulf War | ~7 months | ~+100% | ~9% of global supply |
| 2019 Aramco Drone Strike | Days | ~+15% (temporary) | ~5% (temporary) |
| 2022 Russia-Ukraine Conflict | Ongoing | ~+60% (peak) | ~10–12% of global supply |
| 2026 US-Iran Conflict | Ongoing (Feb to Apr) | ~+95% (Brent) | ~15–20% of global supply |
By the measure of proportional global supply disruption, the 2026 conflict is tracking as the most severe event since the 1973 Arab Oil Embargo. The 15% to 20% supply impact exceeds the Gulf War, the Russian supply shock of 2022, and the 2019 Aramco drone strikes by a significant margin. What distinguishes 2026 further is the speed of escalation: the near-doubling of Brent crude within two months compresses a price trajectory that took many months to develop during prior crises.
The 2022 Russia-Ukraine conflict offers the most recent comparable reference point. Brent peaked approximately 60% above pre-conflict levels following Russia's February 24, 2022 invasion, with prices touching multi-year highs in early March 2022 — the same period that represents the previous high-water mark now surpassed on April 30, 2026. OPEC's market influence during prior disruptions provided a meaningful buffer; in the current environment, that buffer is considerably thinner given the scale of affected production nodes.
The Vulnerability Map: Which Economies Face the Greatest Exposure
Asia-Pacific: The Most Exposed Region
Not all economies absorb an oil shock equally. The structure of energy import dependency, currency denomination of energy contracts, and available fiscal headroom determine which nations are most exposed to sustained crude price elevation.
The highest structural vulnerability sits with Asia-Pacific importing nations: Japan, South Korea, India, and China collectively depend on Persian Gulf crude for a disproportionate share of their energy inputs. Their geographic distance from the disruption zone means they cannot substitute alternative supply without significant cost and logistical delay.
European and Emerging Market Pressures
European economies, still navigating the energy infrastructure transition accelerated by the 2022 Russian gas supply disruption, face renewed pressure from a different direction. Having reduced Russian pipeline dependency, European importers are now more reliant on LNG and Middle Eastern crude precisely when Middle Eastern supply is under strain.
Emerging market economies face the most compounded vulnerability. Higher oil prices mean larger USD-denominated import bills. For nations with weaker currencies, this translates into domestic inflation that is both imported and currency-amplified, simultaneously.
Central banks across oil-importing nations face a policy dilemma with no clean resolution. Raising interest rates to combat energy-driven inflation risks suppressing already-fragile economic growth. Deploying fiscal stimulus to offset consumer energy costs risks expanding deficits in nations that entered 2026 with elevated debt levels. Strategic petroleum reserve releases — the emergency tool deployed during the 2022 Russian conflict — offer only weeks of meaningful relief against a disruption operating at 15% to 20% of global supply.
In addition, the Exxon CEO has publicly cautioned that a sustained Hormuz closure would produce consequences far exceeding anything the industry has previously managed through reserve releases alone. The path forward for oil prices on US-Iran war escalation will ultimately be determined not by market mechanics but by the diplomatic and military decisions made in the coming weeks. What the market is pricing with unusual clarity is that resolution is neither imminent nor guaranteed.
Disclaimer: This article contains forward-looking projections, analyst scenario estimates, and commodity price forecasts sourced from publicly available reporting. These should not be construed as financial advice. Commodity prices are inherently volatile and subject to rapid change based on geopolitical developments, policy decisions, and market dynamics beyond the scope of any single analytical framework. Readers making investment or commercial decisions related to energy markets should consult qualified financial advisors.
Want to Stay Ahead of the Next Major Resource Discovery Triggered by Shifting Commodity Markets?
While oil price shocks reshape global energy markets and ripple across commodities, Discovery Alert's proprietary Discovery IQ model instantly identifies significant ASX mineral discoveries — delivering real-time alerts that translate complex market shifts into actionable investment opportunities before the broader market catches on. Explore how historic mineral discoveries have generated substantial returns and begin your 14-day free trial today to position yourself ahead of the next major find.