August 5, 2026
The Geopolitical Risk Premium Embedded in Every Barrel of Oil
Global energy markets have never been purely rational systems. For decades, economists and traders have recognised that crude oil pricing contains a layer that sits entirely outside the mechanics of supply and demand. That layer is geopolitical risk, and no conflict in recent memory has stretched it further than the ongoing confrontation between the United States and Iran in 2026. Understanding how oil prices and the US-Iran war interact requires looking beyond the daily price ticker and examining the structural forces reshaping how energy flows around the planet.
The concept of a geopolitical risk premium is not new, but its magnitude during the current conflict is exceptional. When armed conflict involves actors capable of disrupting critical infrastructure, markets price in not just what has already happened but every plausible escalation scenario simultaneously. Importantly, research into how energy markets behave during armed conflict consistently demonstrates that the threat of a supply disruption carries almost the same pricing weight as an actual disruption. The market does not wait for a tanker to be sunk before pricing in the possibility.
Historical parallels reinforce this behavioural pattern. The 1973 Arab oil embargo resulted in a crude price increase of more than 300% in a matter of months. The Iraqi invasion of Kuwait in 1990 caused Brent to nearly double within weeks, even though most Gulf producers continued shipping. The September 2019 drone strikes on Saudi Arabia's Abqaiq facility temporarily removed approximately 5% of global oil supply and triggered single-session price spikes of close to 15%. Each of those events involved a different threat mechanism, yet all shared one feature: markets overweighted catastrophic scenarios relative to probable outcomes.
The US-Iran conflict differs from those historical episodes in one structurally significant way. Previous Iran-related disruptions involved proxy engagements, sanctions regimes, or infrastructure incidents. The current conflict involves direct military confrontation between state actors, a threshold not crossed in the Persian Gulf since the Iran-Iraq War of the 1980s. That distinction alone justifies a structurally higher baseline premium than most historical models anticipated. Furthermore, the geopolitical oil price drivers at play extend well beyond the immediate theatre of conflict.
When big ASX news breaks, our subscribers know first
The Strait of Hormuz: Where Geography Becomes Geopolitics
No single physical location does more to explain the current oil price environment than a narrow waterway separating the Omani and Iranian coastlines. The Strait of Hormuz, at its narrowest point spanning roughly 21 nautical miles, functions as the world's most consequential energy chokepoint. Before the current conflict, approximately 20% of all global crude oil and LNG shipments transited this passage under normal operating conditions.
To appreciate the systemic risk this creates, consider that the strait's throughput, even at partial operational capacity, exceeds the total oil export capacity of most OPEC member nations. A full closure would not merely reduce global supply — it would trigger simultaneous price shocks across crude, refined products, and natural gas markets worldwide. The global LNG supply outlook has consequently become inseparable from the trajectory of this conflict.
Key Insight: The Strait of Hormuz is not simply an important shipping lane. It is the single point through which the oil production of Saudi Arabia, the UAE, Kuwait, Iraq, and Qatar reaches global markets. Losing it entirely, even temporarily, would represent the largest supply shock to energy markets since the 1973 embargo.
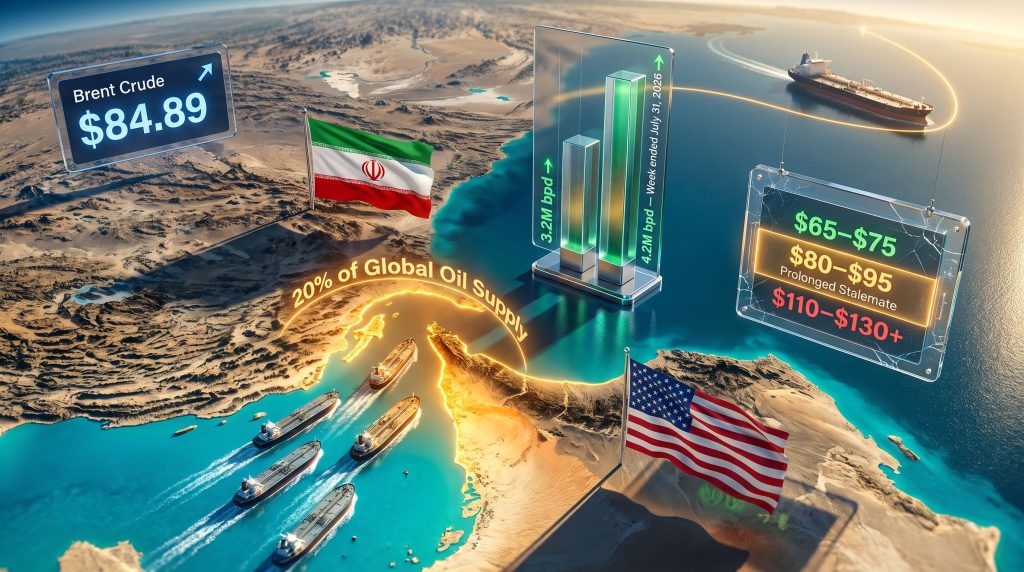
Data from Barclays analysts tracking chokepoint flows provides a revealing signal of pre-emptive market behaviour. Crude oil and refined product net exports through the Strait of Hormuz averaged 3.2 million barrels per day in the week prior to the most recent escalation phase, then surged to 4.2 million barrels per day in the week ended July 31, 2026. That one-week increase of 1 million barrels per day represents surge shipping, a historically reliable precursor to supply anxiety. When producers and shippers fear imminent disruption, they accelerate exports while the window remains open.
The Bab el-Mandeb Factor: A Secondary Chokepoint Compounding Risk
While most attention has focused on Hormuz, the Bab el-Mandeb Strait — the narrow southern gateway to the Red Sea connecting Gulf producers to European markets via the Suez Canal — has emerged as a parallel vulnerability. Reports confirmed that six Saudi-flagged supertankers diverted through the Gulf of Aden toward southern Africa in recent weeks, adding thousands of nautical miles and multiple additional days to their voyage times. Two additional Saudi oil tankers were confirmed crossing the Bab el-Mandeb Strait itself, indicating that some traffic was still willing to accept that risk.
KCM Trade chief market analyst Tim Waterer has described the combined effect in structural terms: the Saudi-Houthi conflict has not fully halted energy flows, but it has imposed longer voyage times, significantly elevated insurance costs, and periodic diversions. The simultaneous pressure on both Hormuz and Bab el-Mandeb creates what market participants have begun calling a dual-chokepoint risk framework — a configuration where two of the world's most critical energy passages face concurrent stress.
This dynamic prevents oil markets from fully unwinding their geopolitical premium even during temporary de-escalation signals, because the risk at one chokepoint tends to persist regardless of the status of the other.
| Chokepoint | Daily Oil Flow (Pre-War) | Current Status | Diversion Route | Added Voyage Time |
|---|---|---|---|---|
| Strait of Hormuz | ~20% of global supply | Partially operational, high risk | Cape of Good Hope | 14-21 days |
| Bab el-Mandeb | ~10% of global supply | Active diversions reported | Cape of Good Hope | 7-12 days |
| Suez Canal | ~12% of global trade | Reduced traffic | Cape of Good Hope | 10-14 days |
Beyond the headline barrel price, shipping disruptions generate cascading costs that rarely appear in standard oil price analysis. War risk insurance surcharges from specialist marine underwriters now apply to any vessel transiting the designated conflict zone, with Lloyd's of London and similar markets applying premiums that can add hundreds of thousands of dollars per voyage for large crude tankers. The cost differential between a Hormuz-routed tanker and a Cape of Good Hope alternative is not merely the insurance surcharge — it includes the additional fuel consumption, crew time, and charter rate premium for the extended voyage, collectively representing a hidden inflationary tax on every barrel that successfully reaches its destination.
Oil Price Trajectory: A Volatility Framework for the US-Iran War
Understanding the price movements that have accompanied oil prices and the US-Iran war requires abandoning the expectation of a clean directional trend. Conflict-era oil pricing operates in cycles of escalation spikes, partial de-escalation retreats, and renewed premium rebuilding. The oil market trade war impact from broader geopolitical tensions has further complicated this already volatile environment.
The trajectory across the conflict's key phases looks broadly like this:
- Pre-war baseline: Brent crude trading in the $70-$73 per barrel range before active hostilities commenced.
- Initial escalation spike: Prices surged into the $80s and $90s as the conflict intensified and Hormuz shipping risk materialised.
- Peak conflict pricing: At maximum escalation moments, Brent reportedly traded above $120 per barrel, reflecting the market's pricing of a potential full-closure scenario.
- Ceasefire and de-escalation dips: Prices retreated toward near-$70 levels during announced pauses and truce-style agreements.
- Current positioning (August 4, 2026): Brent front-month futures at $84.89 per barrel, recovering 1.3% (or $1.12) after a prior session decline of 7% to a three-week low. WTI crude at $81.11 per barrel, up 1% (77 cents) after a decline exceeding 5% in the previous session.
The prior session's sharp selloff was directly triggered by US President Trump's announcement on Sunday that he was pausing new strikes on Iran pending diplomatic talks aimed at ending the war and resolving the Strait of Hormuz control dispute. Markets initially interpreted this as a meaningful step toward resolution and repriced accordingly.
What followed illustrates a critically important dynamic in conflict-era oil markets. Iran's Foreign Ministry spokesperson Esmail Baghaei publicly and directly rejected the premise of Trump's statement, confirming that no negotiations with the US were taking place and that no meetings were scheduled. The rebuttal removed the basis for the selloff within hours, and prices began recovering.
ING analysts assessed that the magnitude of the selloff appeared disproportionate to the actual change in risk, noting that the market had been in similar positions before where apparent de-escalation quickly unravelled. With Iran denying any active talks and Washington issuing conditional warnings about what would follow if no agreement materialised, the conditions for renewed escalation remained intact.
The Diplomatic Contradiction Sustaining the Premium
The Hormuz interpretive dispute sits at the core of the stalemate. The US position holds that the June memorandum of understanding between the two parties required Iran to reopen the waterway. Tehran's position is that the same document explicitly preserved Iran's sovereign authority over the strait. Both parties are citing the same agreement to justify contradictory actions.
This is structurally more damaging to oil market stability than a straightforward disagreement. When both sides interpret a foundational agreement differently, there is no shared framework for resolution. Markets cannot price in a diplomatic outcome when the parties themselves cannot agree on what an outcome would look like. The uncertainty premium therefore becomes self-sustaining.
Supply Chain Vulnerabilities: Who Bears the Most Risk?
The exposure to Hormuz disruption is not evenly distributed across global oil consumers. Gulf Cooperation Council producers including Saudi Arabia, the UAE, Kuwait, and Iraq collectively depend on the strait for virtually all of their export volumes. Iraq faces the most acute exposure: close to 100% of Iraqi crude exports transit Hormuz, leaving Baghdad with essentially no alternative routing option in the event of a sustained closure.
Qatar's situation introduces a dimension beyond crude oil. As one of the world's largest LNG exporters, Qatar routes all of its liquefied natural gas shipments through the same waterway, meaning a Hormuz disruption simultaneously threatens global natural gas supply chains. This interconnection is frequently underappreciated in oil-focused coverage but represents a material risk for European and Asian gas markets that depend on Qatari LNG to balance seasonal demand fluctuations.
The maritime incident risk is not theoretical. On August 5, 2026, UK Maritime Trade Operations (UKMTO) flagged an active incident involving a cargo vessel located 20 nautical miles northeast of Oman's Al Khasab, which broadcast over emergency radio that it had been struck by an unknown projectile. Single incidents of this type, regardless of the broader diplomatic context, can reprice oil markets overnight by confirming that physical shipping risk is active rather than speculative.
Scenario Analysis: Three Price Pathways Forward
The range of plausible outcomes for oil prices given the current conflict trajectory spans more than $60 per barrel between the most optimistic and most pessimistic scenarios. Investors and energy planners operating in this environment need a structured framework rather than a single price forecast.
| Scenario | Trigger Conditions | Brent Price Range | Probability Assessment |
|---|---|---|---|
| Diplomatic Resolution | Verified ceasefire, Hormuz reopened, sanctions framework agreed | $65-$75/barrel | Low-to-moderate near-term |
| Prolonged Stalemate | No resolution, partial shipping, ongoing volatility | $80-$95/barrel | Most likely current trajectory |
| Full Hormuz Closure | Naval blockade or major infrastructure strike | $110-$130+/barrel | Tail risk, non-negligible |
The prolonged stalemate scenario is currently the most probable trajectory. Partial shipping continues, insurance markets remain elevated but functional, and diplomatic signals oscillate between apparent progress and outright denial. In this environment, Brent is likely to trade in a structurally elevated range with periodic spikes toward the upper end of the $80-$95 band whenever escalation signals emerge.
The full Hormuz closure scenario, while assigned lower probability, represents a tail risk that cannot be dismissed. OPEC market influence and spare capacity estimates suggest OPEC+ holds an estimated 3 to 4 million barrels per day in reserve — meaningful, but significantly short of what would be required to compensate for a full closure scenario.
How the US-Iran War Reaches the Petrol Pump
The transmission mechanism from Brent crude prices to retail fuel costs operates through several distinct channels. A $10 per barrel increase in Brent crude typically translates into retail petrol and diesel price increases across major consuming economies, with the exact magnitude varying depending on local taxation structures, refinery margins, and currency exchange rates.
The impact is not uniform across geographies:
- United States: Domestic WTI crude production provides partial insulation through reduced import dependency, but the integration of US refined product markets with global pricing means consumers still face higher pump prices. WTI's current discount to Brent narrows the buffer somewhat.
- European Union: Heavily dependent on seaborne crude imports with limited domestic production, Europe faces compounded risk if both Hormuz and Bab el-Mandeb remain simultaneously disrupted, as Cape of Good Hope rerouting adds significant cost to every barrel.
- India and China: As the two largest Asian crude importers with significant Gulf supplier relationships, both nations face higher prices and elevated rerouting logistics costs. For India specifically, Gulf crudes represent a substantial share of total import volumes, making the conflict a material economic headwind.
- Emerging market economies: Least insulated from the shock, these markets face a double burden where dollar-denominated crude prices rise simultaneously with currency depreciation against the US dollar, amplifying the local-currency cost of every imported barrel.
Surging oil prices are already affecting consumers across multiple dimensions, from fuel costs at the pump through to elevated prices for goods transported by road and sea. Sustained crude prices above the $100-$110 per barrel threshold have historically coincided with economic slowdowns in major importing economies.
The crude oil trade geopolitics underlying this conflict make a rapid resolution unlikely, as the structural disagreements between Washington and Tehran extend well beyond the immediate question of Hormuz access. A full Hormuz closure scenario generating prices above that level would constrain central bank policy flexibility globally, as policymakers would face the difficult choice between fighting inflation and supporting growth simultaneously.
The next major ASX story will hit our subscribers first
Frequently Asked Questions
Why did oil prices fall sharply and then recover so quickly?
President Trump's Sunday announcement of a pause in US strikes created a resolution expectation that markets priced in immediately. When Iran's Foreign Ministry publicly denied any negotiations were underway, the basis for that expectation was removed. The speed of the recovery reflects how thin the diplomatic substance underlying the selloff actually was.
What share of global oil supply passes through the Strait of Hormuz?
Approximately 20% of global crude oil and LNG shipments transited the Strait of Hormuz under pre-conflict conditions. This share makes it categorically the most consequential single chokepoint in the global energy system, with no viable full-scale alternative routing option for the Gulf producers that depend on it.
What is the current Brent crude price during oil prices and the US-Iran war?
As of August 4, 2026, Brent crude front-month futures were trading at approximately $84.89 per barrel, recovering 1.3% after a 7% single-session decline. Over the course of the conflict, Brent has ranged from approximately $70 to above $120, depending on the intensity of hostilities and the degree of shipping lane disruption.
Could the conflict trigger a global recession through oil prices?
Historically, sustained Brent crude above the $100-$110 range has correlated with economic contraction in energy-importing economies. A full Hormuz closure would represent an unprecedented peacetime supply shock potentially exceeding the scale of the 1973 embargo in terms of its immediate volume impact, carrying genuine recession risk for import-dependent economies.
Summary: Key Market Statistics
| Metric | Value |
|---|---|
| Brent crude (August 4, 2026) | $84.89/barrel (+1.3%) |
| WTI crude (August 4, 2026) | $81.11/barrel (+1.0%) |
| Prior session Brent decline | -7% (three-week low) |
| Prior session WTI decline | -5%+ |
| Hormuz net exports (week ended July 31) | 4.2 million bpd |
| Hormuz net exports (prior week) | 3.2 million bpd |
| Hormuz share of global oil/LNG flows | ~20% |
| Brent range during conflict | ~$70 to $120+ |
| Saudi supertankers rerouted via Africa | 6 vessels confirmed |
Oil prices and the US-Iran war have not merely moved crude benchmarks — they have exposed structural vulnerabilities in global energy architecture that pre-existing models did not fully account for. The dual-chokepoint dynamic, the diplomatic contradiction over the Hormuz memorandum, and the demonstrated willingness of both parties to sustain active hostilities have collectively created an oil market risk environment with no straightforward resolution pathway. For investors, energy planners, and policymakers alike, the baseline assumption should be continued elevated pricing with asymmetric upside risk until a verified, durable resolution emerges and shipping markets confirm that physical flows have normalised.
Disclaimer: This article contains forward-looking analysis, scenario modelling, and market commentary based on publicly available information as of August 4, 2026. It does not constitute financial or investment advice. Oil price forecasts and scenario projections involve significant uncertainty and should not be relied upon as the basis for investment decisions. Readers should consult qualified financial and energy market advisors before making any investment or commercial decisions based on this analysis.
Want to Identify the Next Major Resource Discovery Before the Market Does?
While geopolitical risk premiums reshape global energy markets, Discovery Alert's proprietary Discovery IQ model delivers real-time alerts on significant ASX mineral discoveries — instantly translating complex data into actionable investment insights for both short-term traders and long-term investors. Explore Discovery Alert's dedicated discoveries page to understand how historic mineral discoveries have generated substantial returns, and begin your 14-day free trial today to position yourself ahead of the broader market.