July 23, 2026
When Geography Becomes Destiny: The Strait of Hormuz and the Logic of Oil Price Volatility
Few forces reshape energy markets as rapidly or as unpredictably as the concentration of critical infrastructure in politically unstable regions. The global oil system was not designed with redundancy in mind. Decades of investment decisions, pipeline routes, and tanker corridors have funnelled an enormous share of the world's traded crude through a handful of narrow maritime passages. When those passages come under threat, the consequences ripple outward far faster than any physical supply disruption could justify. Understanding why oil rallies amid escalating U.S.-Iran conflict requires understanding this geography first, because the market is not reacting to what has already happened. It is pricing what could happen next.
When big ASX news breaks, our subscribers know first
The Geopolitical Risk Premium: How Military Escalation Translates Into Crude Price Surges
Why Markets Price Fear Before Facts
Commodity markets operate on a fundamentally forward-looking logic. Traders do not simply respond to current barrels flowing or not flowing. They construct probability-weighted scenarios about future supply availability and embed those assessments into spot and futures prices in real time. This mechanism is what analysts refer to as the geopolitical risk premium.
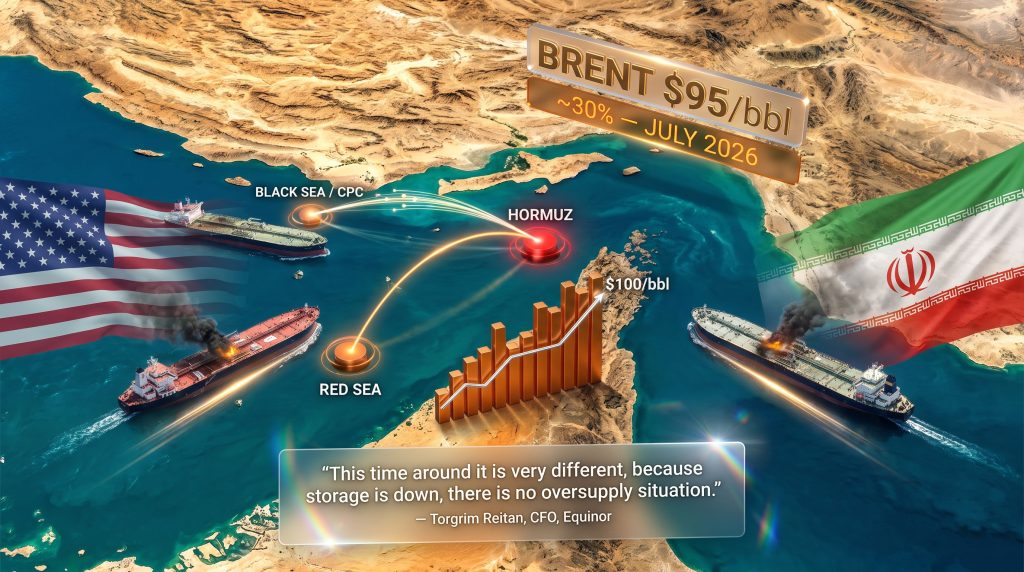
In the context of the U.S.-Iran conflict, that premium has been extraordinarily visible. Furthermore, understanding the geopolitical oil price drivers at play helps explain why Brent crude surged toward $95 per barrel in July 2026, extending a monthly price rally of approximately 30% — driven not by a confirmed halt in Persian Gulf exports but by a credible and intensifying threat that such a halt could materialise.
"The geopolitical risk premium is not irrational speculation. It is the market's best estimate of supply disruption probability multiplied by the severity of the potential impact, then discounted back to today's price."
Several structural features make this particular escalation cycle especially potent:
- Military activity has been continuous rather than episodic, with 11 consecutive days of U.S. Central Command operations targeting Iranian assets
- Three tanker attacks near Oman in the Strait of Hormuz have materially elevated marine insurance premiums and altered commercial shipping behaviour
- Iran confirmed through official state media that no active negotiations are underway, removing the primary near-term catalyst for risk premium compression
- U.S. presidential statements explicitly warning of military retaliation against any interference with Hormuz shipping have hardened trader expectations of a prolonged conflict cycle
The Anatomy of an Anticipatory Oil Rally
What makes oil rallies amid escalating U.S.-Iran conflict different from ordinary supply shocks is the sequence of events. Prices move first. Physical disruption, if it occurs, comes later. This inversion of cause and effect confuses observers who focus solely on inventory data or current production figures.
Consequently, it explains why a 2 million barrel increase in U.S. commercial crude inventories reported by the Energy Information Administration in the same week failed to dampen prices. The market was not looking at last week's stockpiles. It was pricing next month's potential shortfall. For broader context on how crude oil volatility trends have evolved, the current cycle represents one of the more pronounced anticipatory rallies in recent memory.
How Significant Is the Strait of Hormuz to Global Oil Supply Security?
The World's Most Consequential Maritime Chokepoint
The Strait of Hormuz is a navigational corridor approximately 33 kilometres wide at its narrowest point, separating Iran from the Sultanate of Oman. Despite its modest physical dimensions, it carries a disproportionate share of global energy responsibility.
| Metric | Detail |
|---|---|
| Estimated share of global crude trade transiting Hormuz | ~20% |
| Tanker attacks near Oman during current escalation | 3 vessels |
| U.S. military operations conducted against Iran | 11 consecutive days |
| Brent price level breached (July 2026) | $95/bbl |
| Monthly rally magnitude | ~30% |
| Brent prompt timespread backwardation | >$3/bbl |
Roughly one in every five barrels of oil traded globally moves through this single passage. The Persian Gulf states — including Saudi Arabia, the UAE, Iraq, Kuwait, and Qatar — all depend on Hormuz access to varying degrees. Iran has historically threatened to close the strait during periods of maximum diplomatic pressure, and while a full closure has never been executed, the credible threat alone is sufficient to move markets by double digits.
What makes the current environment particularly fragile is the combination of active military hostilities and lean inventory buffers. Equinor's Chief Financial Officer, Torgrim Reitan, publicly observed that storage levels are materially lower compared to previous geopolitical escalation cycles. This means the oil market has a significantly reduced capacity to absorb any physical disruption without immediate price consequences. His assessment underscored that the physical tightness already visible in market structure distinguishes this cycle from prior Hormuz risk episodes where ample stockpiles provided a meaningful cushion. As oil markets under trade war pressure have already demonstrated, compounding stressors can amplify price moves well beyond what any single factor would suggest.
Three Simultaneous Supply Disruption Vectors Amplifying the Oil Rally
A Multi-Front Shock With No Easy Resolution
One of the most analytically important features of the current oil rally is that it is not driven by a single geographic flashpoint. Three distinct and geographically separate supply disruption vectors have converged simultaneously, creating a compounding effect on market psychology and price discovery. According to reporting from The Guardian, tanker attacks in the Strait of Hormuz have directly contributed to the surge in risk premiums across crude benchmarks.
Vector 1: U.S. Military Operations Against Iranian Assets
The sustained pace of U.S. Central Command operations represents an unusual departure from the sporadic strike patterns seen in previous escalation cycles. Each successive day of activity resets the market's risk calculus, preventing the brief price retreats that typically follow individual incidents. Traders cannot model a clear endpoint, and uncertainty itself carries a premium.
Vector 2: Houthi Threats to Red Sea Commercial Shipping
The Red Sea corridor, which connects the Suez Canal to the Gulf of Aden, handles a substantial volume of global container and energy trade. Renewed Houthi activity targeting commercial vessels in this waterway introduces a second chokepoint risk operating in parallel with Hormuz. Some commercial operators have already altered transit routes or reduced vessel speeds, adding freight costs and delivery timeline uncertainty to global crude supply chains. The rerouting alternative, around the Cape of Good Hope, adds roughly 10 to 14 days to voyage times and significantly increases operating costs per cargo.
Vector 3: Caspian Pipeline Consortium Terminal Disruptions
Perhaps the least widely discussed but analytically significant element of the current supply shock involves the Caspian Pipeline Consortium terminal on Russia's Black Sea coast. This facility processes the majority of Kazakhstan's crude export volumes, representing a meaningful non-OPEC+ supply stream. Operational disruptions at this terminal during the current escalation period have compounded the Middle Eastern supply anxiety already embedded in prices, creating a third geographic fault line in global crude logistics. In addition, the broader implications of sanctions and oil trading continue to complicate Russian-adjacent supply flows at precisely the wrong moment.
"The simultaneous activation of three geographically distinct disruption vectors — spanning the Persian Gulf, the Red Sea, and the Black Sea — represents an unusually broad stress test for global crude supply chains and meaningfully amplifies the market's sensitivity to each individual event."
What Market Structure Signals Reveal About Physical Tightness
Reading the Futures Curve During a Geopolitical Crisis
Beyond headline price levels, the internal structure of the oil futures curve provides a more granular diagnostic of actual supply and demand conditions. The current steep backwardation in both Brent and WTI prompt timespreads, exceeding $3 per barrel, is a technically significant signal worth unpacking.
Backwardation occurs when the price of crude for immediate delivery trades above the price of crude for delivery in future months. This is the opposite of contango, which prevails when markets are oversupplied and storage is in demand. A backwardation structure of this magnitude tells traders several things simultaneously:
- Physical buyers are willing to pay a premium to secure crude now rather than wait for future deliveries
- The near-term supply of crude available for immediate purchase is insufficient to meet current demand at lower price levels
- The market does not expect the near-term tightness to persist indefinitely, or deferred prices would also be rising at the same rate
What makes the current situation analytically nuanced is the apparent contradiction between rising commercial inventories and the backwardation structure suggesting tightness. The resolution lies in geography and expectation: U.S. inventories may be building modestly, but buyers in Asia and Europe are actively seeking to secure alternative crude sources to reduce Middle Eastern exposure, and that forward-looking competition for barrels is what the timespread is reflecting.
Could Oil Prices Break Through $100/bbl? What Major Banks Are Forecasting
Analyst Scenarios Across the Price Spectrum
Triple-digit oil has moved from fringe scenario to active discussion among major financial institutions. The conditions required to reach and sustain that level are specific and contested, but the probability assigned to the outcome has risen materially since the escalation began. Analysis from Kurdistan 24 similarly highlights how global markets are bracing for significant economic impact as the conflict extends.
| Institution | Scenario Type | Price Target | Key Condition |
|---|---|---|---|
| Bernstein | Elevated risk scenario | >$100/bbl (Brent) | Continued OECD inventory drawdowns |
| Goldman Sachs | Tail risk scenario | ~$100/bbl | Sustained conflict escalation |
| TD Securities | Extended conflict scenario | Elevated right-tail risk | Prolonged Iranian flow restrictions |
Ryan McKay, Senior Commodity Strategist at TD Securities, has characterised the current escalation as reopening the probability of significantly higher price outcomes the longer hostilities persist without a diplomatic resolution framework. This framing is important: the analysis is explicitly duration-dependent. A short, contained conflict may not push prices to triple digits. A protracted standoff with even partial Iranian export disruption could.
What Would Catalyse $100 Oil as a Base Case?
Moving from tail risk to base case would require the intersection of several conditions:
- A material and sustained reduction in Iranian crude volumes reaching global markets, whether through direct export restrictions, sanctions tightening, or physical disruption to loading terminals
- An effective partial blockade or sustained harassment of Hormuz transit lanes that meaningfully reduces throughput below normal levels
- Continued drawdown of OECD commercial inventories below threshold levels that have historically triggered demand destruction
- A complete breakdown of diplomatic back-channels with no credible ceasefire framework emerging over a multi-week horizon
The next major ASX story will hit our subscribers first
Diplomatic Dynamics and the Absence of a Price Relief Catalyst
Why No Negotiations Means No Risk Premium Compression
In geopolitically driven commodity rallies, price peaks typically occur when one of two things happens: physical supply is confirmed disrupted, or diplomatic resolution becomes credible. The current market occupies an uncomfortable middle position where neither condition applies. Iran has publicly confirmed through official state media that no negotiations are underway.
The prior interim peace agreement that had briefly stabilised prices unravelled without producing a durable framework, and Brent subsequently returned to multi-month highs. Without a credible off-ramp, the risk premium embedded in prices has no natural expiration date. Traders cannot confidently model when the escalation cycle ends, which means they maintain elevated hedging positions and refrain from selling risk aggressively. How OPEC's influence on oil markets intersects with this dynamic adds another layer of complexity to the price outlook.
Three Scenarios and Their Likely Price Implications
| Scenario | Diplomatic Outcome | Expected Brent Range |
|---|---|---|
| Rapid De-escalation | Ceasefire within 2 to 4 weeks | $75 to $82/bbl |
| Protracted Standoff | No talks; limited physical disruption | $88 to $95/bbl |
| Full Escalation | Hormuz transit materially restricted | $100 to $115+/bbl |
What This Conflict Means for Global Energy Market Participants
Divergent Consequences Across the Supply Chain
The oil rallies amid escalating U.S.-Iran conflict do not affect all market participants equally. The consequences diverge sharply depending on where in the supply chain an entity operates.
For Major Crude Importers:
- Asian refiners, particularly in China, India, Japan, and South Korea, face elevated import costs that compress refining margins and increase inflationary pressure across energy-intensive industrial sectors
- European buyers are accelerating diversification toward Atlantic Basin and U.S. Gulf Coast crude to reduce reliance on Middle Eastern supply routes
- Marine insurance and freight costs on Persian Gulf and Red Sea routes have risen significantly, adding a secondary cost layer on top of spot crude price increases
For Oil-Exporting Nations and Producers:
- Non-Middle Eastern producers including U.S. shale operators, West African exporters, and North Sea producers stand to capture demand diversion as buyers actively seek alternative sourcing
- OPEC+ members not directly involved in the conflict benefit from improved fiscal positions at elevated price levels, though geopolitical instability within the broader membership creates coordination risks
- Kazakhstan's crude export revenue outlook has become more complicated due to CPC terminal disruptions despite the favourable headline price environment
For Commodity Traders and Options Markets:
- Elevated implied volatility in crude options reflects active hedging by both producers locking in favourable prices and consumers protecting against further cost increases
- The steep backwardation structure creates strong incentives to deliver crude immediately rather than hold it in storage, reshaping short-term inventory management across the supply chain
- Spread trading between Brent and WTI has become more active as U.S. export competitiveness improves relative to Middle Eastern benchmarks
Frequently Asked Questions: Oil Rallies and U.S.-Iran Escalation
Why Does Military Conflict Between the U.S. and Iran Drive Oil Prices Higher?
The connection is geographic and anticipatory. Iran borders the Strait of Hormuz, through which approximately one-fifth of globally traded crude oil passes. When military conflict escalates in or near this corridor, the probability of supply disruption rises regardless of whether any physical interruption has yet occurred. Commodity markets price expected future supply, not just current supply, so credible threats to Hormuz transit translate directly into higher prices even before a single tanker is turned away.
What Is Backwardation and Why Does It Matter Right Now?
Backwardation is a futures market structure in which near-term delivery contracts trade at higher prices than contracts for delivery in future months. It signals that immediate physical crude is scarce relative to demand. A backwardation of more than $3 per barrel in Brent and WTI prompts, as observed during this escalation cycle, indicates genuine near-term tightness, not just speculative momentum. It is one of the most reliable market-based indicators of underlying physical supply stress.
How Does the Red Sea Threat Compound the Hormuz Risk?
The Red Sea and the Strait of Hormuz are distinct but sequentially linked maritime corridors. Crude exiting the Persian Gulf via Hormuz that is destined for European markets must eventually traverse the Red Sea to reach the Suez Canal. When both corridors face simultaneous threat, commercial operators face compounding rerouting decisions. Vessels avoiding both routes must travel around the Cape of Good Hope, adding substantial time and cost to deliveries and effectively tightening the near-term supply available in key consuming regions.
Why Did a U.S. Inventory Build Fail to Dampen Prices?
The 2 million barrel increase in U.S. commercial crude stocks reported by the EIA during the escalation cycle represents a backward-looking data point. Traders focused on forward-looking risk were unwilling to sell crude aggressively based on last week's inventory figure when the probability of next month's supply disruption remains elevated. Additionally, the Equinor CFO's observation that storage levels are materially lower than in prior geopolitical cycles means the apparent inventory cushion provides far less practical protection against a supply shock than headline stock figures might suggest.
Disclaimer: This article contains references to price forecasts and analyst scenarios provided for informational purposes only. Commodity price projections involve significant uncertainty and should not be construed as investment advice. Past price behaviour during geopolitical events is not indicative of future outcomes. Readers should conduct independent research and consult qualified financial advisors before making any investment decisions related to energy commodities or related equities.
Want to Capitalise on the Next Major Commodity Discovery Before the Market Moves?
While geopolitical risk premiums reshape global oil markets, significant mineral discoveries on the ASX are creating parallel opportunities for well-positioned investors — and Discovery Alert's proprietary Discovery IQ model delivers real-time alerts on significant ASX discoveries, turning complex commodity data into actionable insights the moment announcements hit the exchange. Begin your 14-day free trial at Discovery Alert today and ensure you're positioned ahead of the market when the next major discovery is made.