July 27, 2026

When Geography Becomes Destiny: Understanding Oil's Chokepoint Vulnerability
Every few years, global energy markets receive a sharp reminder that crude oil pricing is not purely a function of supply and demand fundamentals. It is also a function of geography. Specifically, it is determined by the physical reality that an enormous share of the world's daily oil output must pass through a handful of narrow maritime corridors before it can reach the refineries and consumers that depend on it. When those corridors come under threat, the entire architecture of global energy pricing shifts almost instantly.
That vulnerability was on full display in late July 2026, when oil slips after US Iran pause fighting dominated energy market headlines. The brief but sharp military exchange between the United States and Iran had sent Brent crude surging toward the psychologically significant $100 per barrel threshold over the preceding three weeks. When a temporary halt to hostilities was announced over the weekend of July 26-27, 2026, prices reversed just as violently as they had risen.
When big ASX news breaks, our subscribers know first
The Anatomy of a Risk Premium Collapse
Understanding why oil slips after US Iran pause fighting requires grasping a concept that sits at the core of commodity pricing: the geopolitical risk premium. This is not a theoretical abstraction. It is a measurable component of the futures price that traders consciously embed whenever conflict threatens the physical movement of oil from producer to consumer. Furthermore, oil price geopolitics plays a central role in how quickly these premiums build and unwind.
The risk premium does not require actual supply disruption to take hold. It needs only a credible probability of disruption. When the US-Iran conflict intensified through early-to-mid July 2026, the market was not necessarily pricing in a complete closure of the Strait of Hormuz. It was pricing in a weighted average of possible outcomes, many of which involved serious interference with normal shipping patterns through that corridor.
When US Ambassador to the United Nations Mike Waltz confirmed across major broadcast networks that President Donald Trump had authorised a pause in military strikes to allow diplomatic channels to advance, the market rapidly revised its probability-weighted outlook downward. The result was a swift and significant unwind.
| Benchmark | Post-Pause Price | Move | % Change |
|---|---|---|---|
| Brent Crude Futures | $91.89/barrel | -$4.89 | -5.05% |
| WTI Crude (West Texas Intermediate) | $84.64/barrel | -$4.67 | -5.23% |
| Brent Intraday Low | Below $90.00 | Briefly breached | Key support tested |
Both major contracts fell to their lowest levels in nearly a week, erasing gains accumulated over three consecutive weeks of escalating tension. Notably, Brent and WTI futures had been under intense upward pressure throughout this period, reflecting just how severely the market had been pricing in potential supply disruption.
The Strait of Hormuz: A Single Point of Catastrophic Failure
No single geographic feature carries more weight in global energy markets than the Strait of Hormuz. This narrow passage between Iran and Oman serves as the exit corridor for the Persian Gulf's oil-producing nations, including Saudi Arabia, the UAE, Kuwait, Iraq, and Iran itself. Under normal conditions, it handles the transit of approximately 20 to 21 million barrels of oil per day, which represents roughly 20% of global daily consumption.
What makes this corridor so strategically precarious is precisely its narrowness. At its tightest point, the navigable shipping lane is just a few kilometres wide in each direction. There is no practical alternative for Gulf producers at scale. Pipeline alternatives exist but carry only a fraction of the required capacity. This means a determined adversary with anti-ship missile capabilities, sea mines, or the threat of naval interdiction can impose enormous economic costs on the global economy without ever formally closing the strait.
During the conflict escalation period, shipping data compiled by Kpler showed that commodity vessel traffic through the Strait of Hormuz collapsed to fewer than 10 vessels per day. The implications of this figure deserve careful consideration:
- Under normal conditions, the strait processes dozens of laden tankers daily across both inbound and outbound lanes
- A drop to fewer than 10 total commodity vessel transits represents a near-functional shutdown of one of the world's most critical supply arteries
- The reduction was not caused by a physical blockade but by commercial shipping operators making risk-weighted routing decisions to avoid the corridor entirely
This behavioural dynamic is a critical and often underappreciated feature of chokepoint disruptions. Physical closure is not required to produce supply disruption. Voluntary avoidance by commercial operators, driven by insurance costs, crew safety concerns, and cargo liability, produces economically equivalent outcomes.
Why Shipping Confidence Lags Diplomatic Progress
One of the least understood dynamics in energy market geopolitics is the asymmetry between how quickly diplomatic announcements move prices and how slowly real-world shipping behaviour responds to those announcements. MST Marquee analyst Saul Kavonic made this point clearly, noting that any recovery in Hormuz transit flows was likely to be slow and partial, with many shipping operators remaining cautious and requiring sustained evidence of safety before repositioning empty tankers back into the strait.
This lag has practical consequences. Even if a ceasefire holds perfectly, the pipeline of crude supply that was interrupted does not immediately resume. Several steps must occur in sequence:
- Insurance underwriters must reassess and reduce war risk premiums on vessels transiting the corridor
- Vessel operators must receive updated guidance from flag state authorities and port agents
- Empty tankers must be repositioned from alternative anchorage locations, which requires several days of transit time
- Laden tanker loading operations at Gulf export terminals must resume at scale
- Physical cargoes must then complete transit and reach destination ports before supply normalisation is visible in inventory data
This sequencing means the gap between a diplomatic signal and a genuine supply recovery can span anywhere from one to three weeks, even under optimistic conditions. In addition, oil price volatility trends during such periods often reflect this very lag, as prices move faster than the physical supply chain can respond.
The Bab el-Mandeb Complication: A Dual Chokepoint Crisis
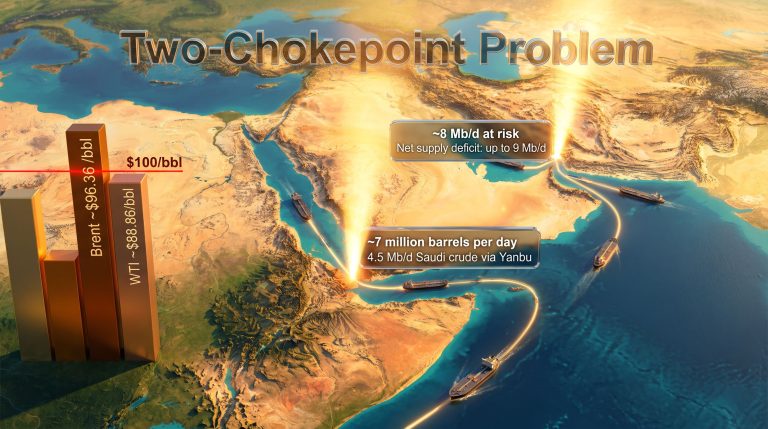
What made the July 2026 disruption historically unusual was not simply the Hormuz interference in isolation. It was the simultaneous pressure on a second major chokepoint: the Bab el-Mandeb strait, which connects the Red Sea to the Gulf of Aden and serves as Saudi Arabia's primary oil export corridor to Asian markets.
On the weekend of the ceasefire announcement, Yemeni Houthi forces attacked Saudi oil infrastructure along the Red Sea coastline, reducing traffic through the Bab el-Mandeb even as the Hormuz situation was nominally de-escalating. The only partial exception was a third Chinese supertanker that successfully exited via the Bab el-Mandeb, signalling that the corridor retained some operational capacity, but at meaningfully reduced volumes.
For Asian importers, particularly India and China, the simultaneous disruption of both corridors created a supply security scenario with few historical parallels. These countries collectively represent the single largest growth market for Middle Eastern crude, and both have built refinery infrastructure specifically calibrated to process the medium-sour grades that Gulf producers export.
The dual chokepoint disruption exposed a structural vulnerability that energy security analysts had theorised but markets had rarely had to price simultaneously. Strategic petroleum reserve drawdowns and spot market scrambles for alternative grades typically follow such events, often pushing medium-sour crude differentials sharply wider.
Diplomatic Pathways and What Each Means for Oil
Market analysts have focused considerable attention on a 14-point Memorandum of Understanding framework as a potential foundation for a structured resolution between Washington and Tehran. The critical unresolved issue within that framework centres on governance and access rights over the Strait of Hormuz itself, which represents a point of deep strategic disagreement between the two parties.
IG Markets analyst Tony Sycamore noted that hopes were building around a genuine diplomatic opening, and that a return to the MOU framework with clearer parameters around Hormuz access would represent a meaningful starting point for de-escalation. However, OPEC's market influence remains a complicating variable, as Gulf producers weigh both the diplomatic environment and their own production objectives simultaneously.
Depending on how diplomacy progresses, three broad price scenarios emerge:
| Scenario | Key Conditions | Expected Brent Range |
|---|---|---|
| Full De-escalation with MOU Signed | Sustained talks, Hormuz governance agreed, shipping normalises | $80-$85/barrel |
| Partial Ceasefire, Ongoing Uncertainty | Pause holds but no formal deal; intermittent disruptions continue | $88-$95/barrel |
| Conflict Resumes | Diplomatic breakdown, military exchanges restart | $100+/barrel |
What Traders and Energy Market Participants Should Watch
For those tracking how the situation develops, the most reliable leading indicators will not be diplomatic statements. They will be physical data points that reveal whether the risk premium unwinding is justified by genuine supply normalisation. Consequently, understanding oil market trade impacts across both the diplomatic and physical supply dimensions becomes essential for anyone monitoring this situation closely.
Key variables to monitor include:
- Daily vessel transit counts through the Strait of Hormuz, as tracked by services like Kpler, which provide near-real-time shipping activity data
- War risk insurance premium movements on tanker routes through the Persian Gulf and Red Sea, which serve as a forward-looking indicator of commercial shipping confidence
- Houthi activity in the Red Sea corridor, since continued attacks on Saudi infrastructure could offset and even reverse the de-escalation effect on Brent
- OPEC+ production posture, as major Gulf producers may adjust output targets in response to the price decline if they perceive the demand impact as lasting
- Tanker repositioning patterns, particularly whether empty VLCCs (Very Large Crude Carriers) begin moving toward Gulf loading terminals
The next major ASX story will hit our subscribers first
The Longer Arc: Structural Lessons From a Chokepoint Crisis
Beyond the immediate price dynamics, the July 2026 episode carries lessons that extend well beyond the next diplomatic announcement. The conflict demonstrated that the global oil supply system retains extraordinary concentrations of physical risk in a very small number of geographic nodes.
Energy security analysts have long argued that the world's reliance on the Strait of Hormuz represents an unresolved structural vulnerability in the global energy architecture. The events of July 2026, during which oil slips after US Iran pause fighting triggered one of the sharpest single-session reversals in recent memory, provided a live stress test of that vulnerability. The results were highly instructive:
- Price response was immediate and severe, with Brent moving nearly $16 per barrel over three weeks before the pause-driven reversal
- Physical shipping responded more slowly than prices, with Hormuz vessel counts dropping to crisis levels even as the geopolitical situation was still developing
- Alternative routing options proved insufficient at the scale required to offset Hormuz disruption, confirming that no short-term logistical workaround exists for the loss of this corridor
For energy importers, the episode reinforces the strategic value of maintaining diversified supply portfolios across different origination regions, holding adequate strategic reserve buffers, and investing in alternative routing infrastructure where economically viable. As reported across major financial outlets, the scale and speed of the price move caught many market participants off guard, underscoring the importance of robust scenario planning in energy procurement strategies.
Disclaimer: This article is intended for informational and educational purposes only. It does not constitute financial or investment advice. Commodity prices are subject to rapid and unpredictable change, and forward-looking scenarios discussed herein involve inherent uncertainty. Readers should conduct their own research or consult a qualified financial adviser before making any investment decisions related to energy markets or related instruments.
Want to Stay Ahead of the Next Major Commodity Market Shift?
Discovery Alert's proprietary Discovery IQ model scans ASX announcements in real time, delivering instant alerts on significant mineral discoveries tied to the commodities most sensitive to geopolitical disruption — turning complex market signals into actionable investment opportunities before the broader market catches on. Explore how historic mineral discoveries have generated exceptional returns and begin your 14-day free trial today to secure a market-leading edge.