May 13, 2026
When Energy Becomes the Economy's Fault Line
Throughout modern economic history, the most damaging inflationary episodes have not originated in central bank miscalculations or excessive consumer borrowing. They have begun in the ground, in pipelines, in shipping lanes, and in the decisions of governments that control access to the resources that power everything else. Energy is not simply one commodity among many. It is the foundational input that makes every other economic activity possible, from growing food to manufacturing steel to routing shipping containers across oceans.
Understanding this structural reality is the prerequisite for interpreting what is now unfolding in global oil markets. The terms oil stockpile crash mode and energy-driven stagflation are appearing with increasing frequency in financial analysis, but their meaning is frequently misunderstood. This article unpacks the mechanics, the history, and the investment implications of what may be one of the most consequential energy disruptions of the post-Cold War era.
When big ASX news breaks, our subscribers know first
The Architecture of a Supply Shock That Is Not Going Away
Most commodity price spikes are self-correcting. High prices attract additional supply, dampen demand, and eventually push prices back toward equilibrium. The current oil disruption, however, does not fit this pattern, because its origin is not rooted in a temporary demand surge or a manageable production shortfall. It is a geopolitically driven structural supply shock, and those operate by a fundamentally different set of rules.
Martin Armstrong, American financial analyst and founder of Armstrong Economics, has characterised the current situation in stark terms, noting that global oil stockpiles are entering a crash mode trajectory that he believes will intensify rather than resolve, particularly as seasonal demand peaks through the Northern Hemisphere summer. The oil price shock unfolding in real time reflects these deeper structural pressures.
The numbers underlying this assessment deserve careful examination:
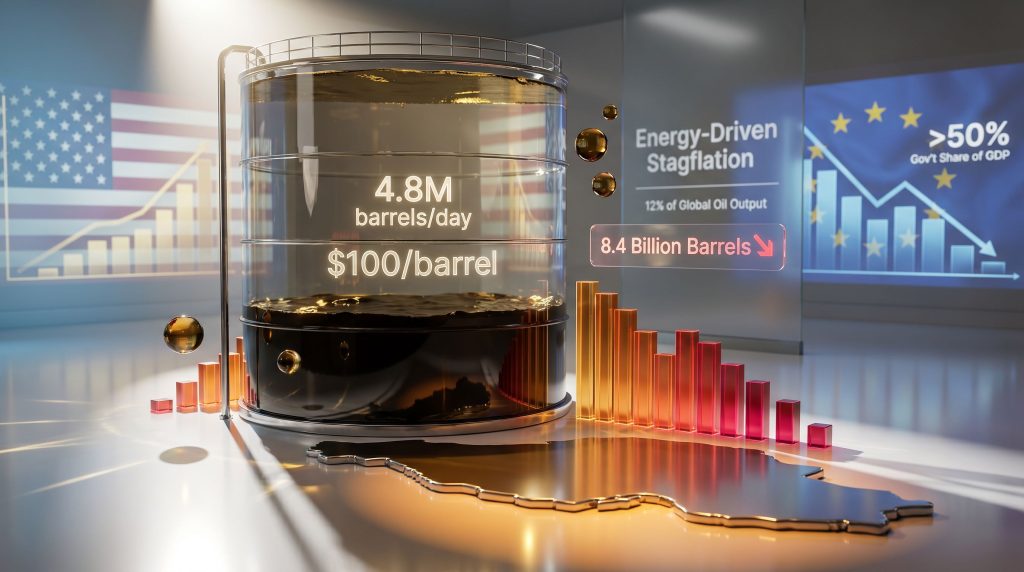
- Global oil supply disruptions are estimated at approximately 12 million barrels per day, representing roughly 12% of total global output at a time when buffers are already under pressure
- Daily drawdown rates on global stockpiles accelerated to approximately 4.8 million barrels per day between March and late April, a pace that analysts describe as placing the global buffer in structural jeopardy
- At that depletion rate, roughly 1.2 billion barrels could be consumed within a single 100-day window
- Total inventories entered the current cycle at approximately 8.4 billion barrels, but only an estimated 800 million to 2.8 billion barrels are considered operationally accessible under real-world infrastructure and logistics constraints
The gap between total inventory and accessible inventory is critical and often overlooked. Oil held in remote storage, in transit, or in facilities with limited drawdown infrastructure cannot be deployed rapidly to stabilise markets. When a crisis accelerates, the effective buffer is far smaller than headline stockpile numbers suggest.
Oil markets do not respond to inventory depletion gradually. When stockpiles approach critical operational thresholds, pricing does not decline smoothly. It reprices violently, driven by the collapse of confidence in supply continuity rather than an accounting of actual barrels available.
Compounding the structural deficit is timing. Summer driving season in the Northern Hemisphere historically peaks around August, creating predictable demand amplification on top of already compressed supply. Fuel shortages are already cascading beyond the fuel pump: aviation disruptions including tens of thousands of cancelled flights due to jet fuel scarcity, diesel shortages affecting maritime operations and fishing fleets, and agricultural supply chains facing cost pressure from both fuel and fertiliser.
Armstrong described a situation in Thailand where staff at his offices could not obtain gasoline for their motorbikes, and where diesel shortages prevented fishing vessels from operating, cascading directly into local food supply disruptions. This is the mechanism by which energy shocks become food shocks, which in turn become social and political shocks.
What Energy-Driven Stagflation Actually Means
Stagflation is a macroeconomic condition in which inflation remains persistently elevated while economic growth simultaneously stagnates or contracts. It is one of the most policy-resistant economic conditions that exists, because the standard tool for fighting inflation, raising interest rates, works by suppressing demand. However, when inflation originates in supply constraints rather than excess demand, rate hikes reduce growth without proportionally reducing prices.
The energy-to-economy transmission mechanism operates across every major sector simultaneously:
| Economic Sector | Energy Dependency Channel | Stagflation Impact |
|---|---|---|
| Agriculture | Diesel machinery, natural gas for fertiliser synthesis | Food price inflation, supply chain contraction |
| Manufacturing | Industrial electricity, petrochemical feedstocks | Input cost inflation, margin compression |
| Transportation | Jet fuel, diesel, marine bunker fuel | Freight inflation, logistics disruption |
| Construction | Fuel, petrochemical materials | Project cost overruns, housing cost escalation |
| Financial Services | Indirect via earnings compression and default risk | Equity volatility, credit tightening |
What makes energy price shocks so economically destructive is their horizontal reach. A spike in oil prices does not stay contained to the fuel pump. It raises the cost of fertiliser used to grow food, the cost of plastics used in manufacturing, the cost of diesel used to ship goods, and the cost of jet fuel used to move passengers and cargo. The trade war oil impact on these supply chains further intensifies the inflationary pressure already embedded in the system.
The 1970s stagflation episode demonstrated empirically that this transmission persists for 18 months or more beyond the initial supply disruption, because wage adjustments and embedded input cost changes continue circulating through the economy long after oil prices stabilise. As Armstrong noted, the stagflation of the 1970s surprised most observers precisely because they underestimated how deeply energy penetrates every layer of production.
Historical data from the U.S. Bureau of Labor Statistics confirms this trajectory:
- U.S. CPI inflation moved from 3% in 1972 to 6.2% in 1973 to 11% in 1974 following the Arab Oil Embargo
- Real GDP growth shifted from +5.2% in 1973 to -0.5% in 1974 to -0.2% in 1975, the simultaneous inflation-and-contraction signature of true stagflation
Central banks cannot resolve this through conventional tools. As Armstrong's framework articulates, rate hikes can dampen demand-side inflation but they cannot increase oil supply. Hiking rates into a stagflationary environment risks deepening the growth contraction without proportionally reducing energy-driven price pressures. This is the trap: every available policy instrument makes at least one dimension of the problem worse.
The Geopolitical Architecture Underneath the Supply Shock
The oil disruption currently underway is not a market accident. It reflects a deliberate geopolitical configuration, specifically the intersection of U.S. sanctions enforcement against Iran and China's heavy dependence on Iranian crude. Consequently, the dynamics of oil trade geopolitics have become central to understanding how this crisis will evolve.
Armstrong has emphasised that China sources a very substantial portion of its oil from Iran, making U.S. sanctions enforcement against Iranian exports a direct national security challenge for Beijing, not merely a trade inconvenience or diplomatic friction point. This transforms what might appear to be a bilateral sanctions dispute into a trilateral energy security confrontation involving the United States, Iran, and China simultaneously.
The implications of this structure are significant:
- China faces a binary position: absorb the economic cost of energy scarcity or pursue strategic countermeasures
- Any US-China meeting on trade or broader relations occurs in the shadow of this energy vulnerability, with Chinese leverage compressed by dependency and amplified by the range of retaliatory tools at Beijing's disposal
- Armstrong has suggested that Taiwan could emerge as a bargaining chip in this negotiation structure, with China potentially using a blockade threat as leverage rather than a direct military objective, noting that Chinese naval capabilities to encircle Taiwan have already been tested
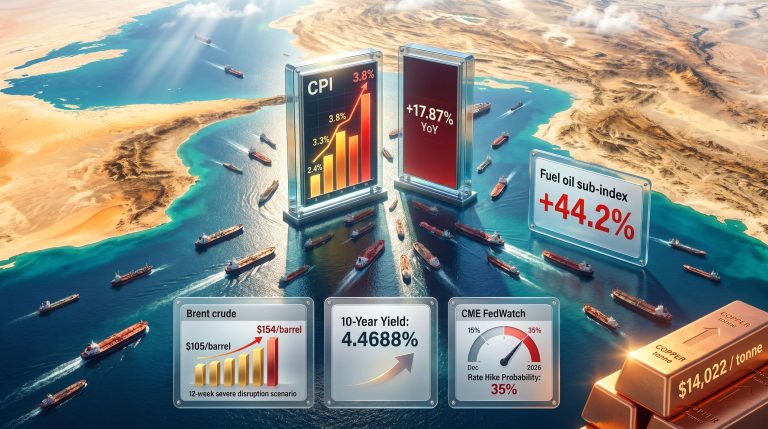
The Strait of Hormuz functions as a global choke point through which approximately 20-25% of the world's seaborne oil flows. History consistently demonstrates that even the threat of disruption to this passage drives price formation disproportionately to actual supply loss. In 2019, following drone attacks on tankers near the Strait, oil prices spiked approximately 20% despite no sustained supply disruption actually materialising. Markets price perceived risk, not just realised loss.
European diplomatic positioning adds a further layer of complexity. France's president has pursued independent overtures to Beijing, reportedly distancing Europe from Middle East conflicts and explicitly declining participation in any potential Taiwan confrontation. Armstrong characterised this positioning as motivated by Gaullist instincts toward European strategic autonomy rather than coherent economic analysis, and questioned whether European leadership fully understands the extent to which American military spending and NATO commitments have historically provided an invisible subsidy to European economic stability.
The US and Europe Are Not Facing the Same Crisis
While the energy shock is global, its economic consequences are highly asymmetric. Armstrong's analysis draws a clear distinction between a U.S. stagflation scenario and a European trajectory that more closely resembles depression-level contraction.
| Metric | United States | European Union |
|---|---|---|
| Government Share of GDP | ~35% | >50% |
| Energy Import Dependency | Moderate (domestic shale production) | High (post-Russia sanctions) |
| Stagflation Risk Profile | Inflation exceeds GDP growth | Contraction risk toward depression |
| AI Productivity Offset | Significant and growing | Limited |
| Monetary Policy Flexibility | Constrained but present | Severely constrained |
| Projected Economic Trajectory | Painful but structurally contained | Serious contraction toward 2028 |
Armstrong's analytical framework uses government consumption as a share of GDP as a more meaningful metric than the conventional debt-to-GDP ratio. His logic: if government consumes 50% of a nation's economic output permanently, the private sector's capacity to generate growth, innovation, and productivity is structurally capped. Europe's public sector absorption rate above 50% of GDP, compared to approximately 35% in the United States, represents a persistent structural drag that compounds with every additional external shock.
Europe's self-imposed constraints are particularly damaging in an energy crisis context. Sanctions on Russian energy reduced one of Europe's primary low-cost supply sources. Climate transition policies accelerated the retirement of legacy energy infrastructure without equivalent renewable replacement capacity online. The result is an import-dependent system meeting elevated prices with limited flexibility to diversify supply at speed.
Armstrong's forecast for European economic performance extends toward a serious decline into 2028, driven by the intersection of energy costs, defence spending pressures, and institutional rigidity within the EU governance structure.
How an Oil Stockpile Crisis Becomes a Systemic Market Event
Inventory crises do not unfold as smooth, gradual deteriorations. They progress through distinct phases, each with different market dynamics and policy responses available.
Phase 1: Buffer Erosion
Inventories draw down at an accelerating rate. Prices rise but markets remain functional. Strategic petroleum reserve releases and diplomatic negotiations provide temporary relief signals. This is the phase currently underway.
Phase 2: Threshold Breach
Inventories approach critical operational minimums. Forward curve pricing becomes highly volatile as traders lose confidence in supply continuity. Panic buying by industrial consumers amplifies drawdown velocity, creating a self-reinforcing acceleration.
Phase 3: Confidence Collapse
Market participants lose confidence in supply continuity. Price spikes become non-linear. Secondary effects cascade into food markets, manufacturing, and financial systems simultaneously. Sovereign credit risk increases as fiscal positions deteriorate under subsidy and stabilisation costs.
The defining characteristic of Phase 3 is that it is not driven primarily by the physical scarcity of oil. It is driven by the expectation of scarcity, amplified by financial market dynamics. This is why inventory thresholds matter psychologically as much as physically. Furthermore, understanding the bond market effects of these escalating energy pressures is increasingly relevant to investors navigating the current environment.
The next major ASX story will hit our subscribers first
Capital Markets, Precious Metals, and the Investment Implications
The current macro environment presents investors with a configuration in which conventional portfolio logic partially breaks down. In a standard inflationary cycle, rate hikes restrain inflation while growth moderates. Bond yields rise, equity valuations compress modestly, and the system rebalances. Stagflation disrupts this sequence.
In a stagflationary environment:
- Equities face simultaneous margin compression from input costs and demand contraction from weakening consumers
- Bonds underperform as inflation expectations become re-anchored at higher levels, eroding real yields
- Commodities, particularly oil, silver, and gold, are increasingly reassessed as portfolio hedges against both inflation and equity market volatility
Armstrong's view on precious metals is nuanced and worth examining carefully. His analysis attributed the recent short-term corrections in gold and silver to forced selling events rather than fundamental demand deterioration. Two specific mechanisms were identified:
- Sanctions-driven liquidations: Russian entities, facing asset seizure in Western financial systems, were forced to sell gold holdings for liquidity, creating temporary supply-side pressure on prices
- UAE banking disruption: Following Iranian drone and missile attacks on the UAE, which Armstrong notes targeted the UAE's role as an emerging financial hub after Switzerland compromised its neutrality by confiscating Russian assets, the regional banking system temporarily went offline. Armstrong noted that his own organisation could not access funds for staff in the UAE for approximately a week. This created forced gold selling as a liquidity mechanism
These are not demand-destruction signals. They are technically-driven liquidations that create short-term price suppression followed by resumption of the underlying trend. In addition, gold safe-haven demand has historically reasserted itself strongly following such technically-driven corrections, and Armstrong's longer-term view on precious metals remains constructive, with a potential trend resumption anticipated to begin in June following May consolidation.
Silver carries additional significance in this context. Armstrong flagged growing silver shortages related to data centre construction and AI infrastructure buildout. This creates a demand profile for silver that extends beyond traditional monetary and jewellery uses into industrial and technology applications, complicating the supply picture further.
Renewable energy assets also merit consideration in a prolonged stagflation environment. Projects with long-term contracted revenues offer inflation-linked cash flows structurally insulated from fossil fuel price volatility, potentially attracting capital reallocation from investors seeking stable, inflation-protected returns.
The Debt, War, and Inflation Nexus
Armstrong's analytical framework includes a long-standing thesis that governments facing deteriorating domestic economic conditions consistently escalate geopolitical narratives as a mechanism of public attention management. He is explicit that this is not a conspiracy but a documented historical pattern of institutional self-preservation.
When fiscal positions weaken and living standards decline, external threat narratives redirect public scrutiny away from policy failures. Defence spending becomes politically justifiable in ways that domestic stimulus cannot, allowing governments to expand fiscal deficits under a security mandate. The critical irony: defence-driven deficit expansion in an already inflationary environment directly worsens stagflation by increasing money supply without adding productive economic capacity.
On the question of U.S. dollar safe haven durability, Armstrong's framing is deliberately relative rather than absolute. The U.S. dollar continues attracting crisis capital not because the U.S. fiscal position is strong, with national debt approaching $40 trillion, but because the alternatives are structurally weaker. Japan carries a debt-to-GDP ratio exceeding 200%. Europe's growth trajectory is deteriorating. Emerging market currencies carry political risk premiums.
The dollar is, in Armstrong's phrase, the prettiest of the ugly sisters. This framing matters for investors: dollar safe haven status is durable in the near term but is subject to a long-cycle confidence threshold. Armstrong's Socrates computer model points to approximately 2032 as a period of significant institutional change, when accumulated public frustration with government performance and the debt-war-inflation cycle may trigger structural political and financial realignments.
AI productivity represents an important counterweight within this framework. Contrary to widespread narratives about AI-driven job destruction, Armstrong argues that AI is increasing corporate productivity rather than simply eliminating positions. This productivity gain is one of the structural factors that makes the U.S. stagflation scenario more manageable than the European equivalent, as corporations maintain earnings capacity that partially offsets macro headwinds.
Frequently Asked Questions: Oil Stockpile Crisis and Energy-Driven Stagflation
What does it mean when oil stockpiles enter crash mode?
It means inventories are being drawn down at a rate that significantly exceeds replenishment capacity, eroding the global buffer against supply disruptions. At a depletion rate of approximately 4.8 million barrels per day, the market's safety margin can be exhausted within months, triggering non-linear pricing responses that markets cannot manage gradually.
How does an oil supply shock cause stagflation specifically?
Energy is a foundational input cost across agriculture, manufacturing, transportation, and logistics. When energy prices rise sharply, production costs increase across all sectors simultaneously, driving broad inflation. At the same time, higher costs compress corporate margins and consumer purchasing power, slowing economic growth. The result is simultaneous inflation and stagnation. Fears of 1970s-style stagflation have consequently re-emerged among leading economists and market analysts.
Why is Europe more vulnerable than the United States in this scenario?
Europe is more import-dependent for energy, has removed Russian supply through sanctions, carries a higher government consumption-to-GDP ratio exceeding 50%, and has less domestic energy production flexibility. These structural factors make European economies more exposed to both the inflationary and contractionary dimensions of an energy shock, creating a trajectory toward contraction rather than mere stagflation.
Can central banks fix stagflation?
Not effectively through standard tools. Rate hikes dampen demand-driven inflation but cannot increase oil supply or reduce geopolitically-driven energy costs. In a stagflationary environment, aggressive rate hikes risk deepening the growth contraction without proportionally reducing energy-driven price pressures. The policy dilemma is genuine and historically unresolved without accepting significant pain in one dimension or the other.
What explains precious metals short-term price corrections in this environment?
Recent corrections have been attributed to forced selling events, including sanctions-related gold liquidations and regional banking disruptions in the UAE, rather than fundamental demand deterioration. These are technically-driven liquidations, not signals of deteriorating long-term fundamentals for precious metals in a stagflationary context.
What is the historical precedent for the current situation?
The 1970s oil shocks provide the closest structural parallel. Following the 1973 Arab Oil Embargo, U.S. inflation reached 11% by 1974 while real GDP contracted. The transmission of energy costs through agriculture, transportation, plastics, and manufacturing compressed corporate margins and household purchasing power simultaneously for 18 months or more. The current oil stockpile crash mode and energy-driven stagflation dynamic involves a potentially larger supply disruption operating within a more financially interconnected global system.
Navigating the Intersection of Energy Scarcity and Economic Fragility
Several structural conclusions emerge from this analysis that carry implications beyond the immediate price environment:
- The oil inventory depletion cycle is a structural supply event with multi-year implications, not a price correction that will resolve within a quarter or two
- Stagflation risk is asymmetric across geographies, with the United States facing a painful but manageable inflation-growth imbalance and Europe facing a deeper structural contraction extending potentially toward 2028
- Energy's role as a universal input cost means the economic transmission of this shock will be broader and more persistent than headline energy price data alone suggests
- Precious metals corrections driven by forced selling represent potential entry points rather than demand-destruction signals, based on established long-cycle frameworks
- AI productivity gains are a meaningful but underappreciated counterforce supporting corporate earnings in the United States, partially offsetting macro headwinds
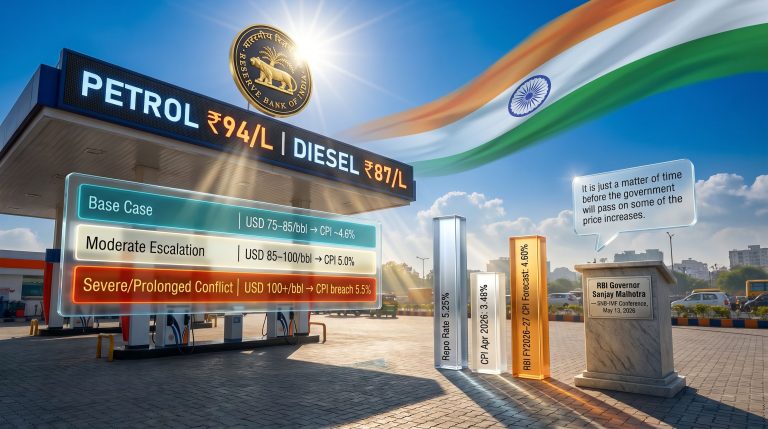
Forward scenarios carry materially different market implications:
| Scenario | Probability Driver | Market Implication |
|---|---|---|
| Diplomatic resolution (US-Iran-China) | Negotiation breakthrough | Oil price normalisation toward $80/barrel range |
| Prolonged conflict or Hormuz restriction | Escalation continuation | Oil sustained above $100/barrel; deep stagflation |
| Coordinated strategic reserve release | G7 policy response | Short-term price relief; structural deficit unchanged |
| Taiwan leverage play by China | US-China negotiation breakdown | Geopolitical risk premium across all asset classes |
| EU energy policy pivot | Political pressure from contraction | Partial rehabilitation of Russian energy imports |
This article contains analysis, forecasts, and commentary sourced from publicly available economic frameworks and historical data. It is not financial advice. Readers should conduct their own due diligence and consult qualified financial advisors before making investment decisions. Forward-looking statements involve inherent uncertainty and actual outcomes may differ materially from projections discussed.
Readers seeking additional perspectives on global energy markets, stagflation dynamics, and long-cycle economic modelling may find value in the Triangle Investor Interviews series on YouTube, which features discussions with international financial analysts including Martin Armstrong of Armstrong Economics.
Want to Position Yourself Ahead of the Next Major Resource Discovery?
As energy-driven stagflation reshapes capital markets and investors reassess commodity exposure, Discovery Alert's proprietary Discovery IQ model delivers real-time notifications on significant ASX mineral discoveries — instantly translating complex resource data into actionable opportunities for both short-term traders and long-term investors. Explore how historic mineral discoveries have generated substantial returns on Discovery Alert's dedicated discoveries page, and begin your 14-day free trial today to secure a market-leading edge before the broader market moves.