June 25, 2026
When Maritime Chokepoints Become Inflation Engines: Understanding the 2026 Supply Shock
Energy economists have long understood that oil price shocks travel through an economy like seismic waves, with the initial disruption at the source spreading outward through transportation costs, manufacturing inputs, and ultimately household budgets. What makes the 2026 inflationary episode particularly instructive is the speed and concentration of the transmission mechanism. This was not a broad-based demand surge driven by loose fiscal policy or excessive credit growth.
It was a supply-side compression event with a single geographic origin point, and it reshaped the macroeconomic outlook for the United States and global markets within the span of two calendar months.
Understanding why US inflation and Strait of Hormuz oil disruptions became the defining economic story of early 2026 requires examining not just the headline numbers, but the structural mechanics that converted a regional maritime conflict into a nationwide purchasing power crisis.
When big ASX news breaks, our subscribers know first
The Velocity of Inflation: A Two-Month Repricing Event
Inflation rarely moves in a straight line, and central banks typically have time to observe trends, consult data, and adjust forward guidance before markets are forced into a fundamental reassessment. The early 2026 cycle offered no such luxury.
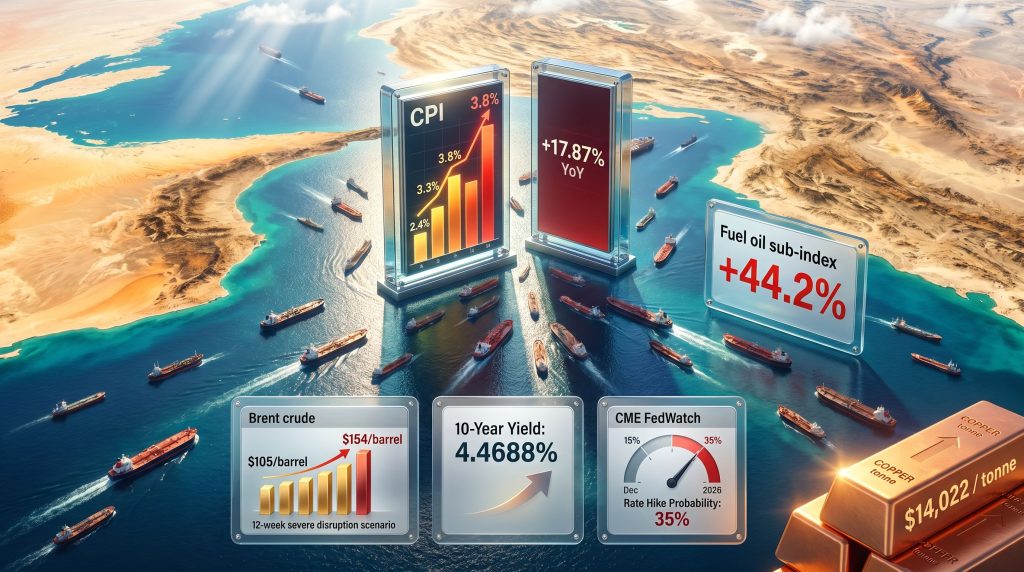
US headline CPI stood at 2.4% year-over-year in February 2026, a reading comfortably within the range that had allowed markets to anticipate Federal Reserve rate cuts in the second half of the year. By March, that figure had climbed to 3.3%, and April delivered the decisive shock: a 3.8% year-over-year reading, the highest since May 2023, accompanied by a 0.6% single-month increase that represented the largest monthly jump since June 2022.
CPI Trend: February to April 2026
| Month | Headline CPI (YoY) | Monthly Change | Energy Inflation (YoY) | Core CPI (YoY) |
|---|---|---|---|---|
| February 2026 | 2.4% | +0.3% | Not disclosed | ~2.4% |
| March 2026 | 3.3% | +0.9% | 12.5% | ~2.6% |
| April 2026 | 3.8% | +0.6% | 17.87% | ~2.6-2.8% |
Source: Bureau of Labor Statistics (BLS)
What separates this episode from a typical inflation overshoot is the degree to which a single sub-index drove the acceleration. Energy inflation reached 17.87% year-over-year in April 2026, while core CPI, which excludes food and energy, remained comparatively contained at approximately 2.6% to 2.8%. The divergence between headline and core readings is analytically significant: it tells investors that the inflationary pressure originated in a supply disruption rather than an overheating domestic economy, but it also means that the Fed has limited ability to address the root cause through interest rate adjustments alone. For a deeper perspective on the inflation outlook and how policymakers are responding, the broader context of Federal Reserve projections is worth examining.
What Is the Strait of Hormuz and Why Does It Control Global Oil Prices?
The Strait of Hormuz is a narrow navigable corridor, roughly 33 kilometres wide at its narrowest navigable point, connecting the Persian Gulf to the Gulf of Oman and the broader Arabian Sea. It functions as the world's single most critical oil transit chokepoint, with approximately one-fifth of all globally traded crude oil passing through its waters on a daily basis.
The strategic importance of this waterway extends well beyond raw volume. Persian Gulf producers including Saudi Arabia, the UAE, Kuwait, Iraq, and Iran have limited alternative export routes. Saudi Arabia operates the East-West Pipeline with a capacity of around 5 million barrels per day as a partial bypass, but this infrastructure cannot fully compensate for a sustained Hormuz closure. The result is that any meaningful restriction of transit activity creates an immediate, non-linear price response in global crude markets. Indeed, crude oil price trends in recent years had already flagged the vulnerability of energy markets to Persian Gulf tensions.
The Physical Supply Loss in Numbers
The March 2026 disruption produced supply consequences of extraordinary magnitude:
- Global oil supply fell by an estimated 10.1 million barrels per day (mb/d) during the peak disruption period
- Weekly supply losses reached approximately 100 million barrels while the strait remained effectively closed
- Persian Gulf spare capacity, the buffer mechanism that normally absorbs supply shocks, became largely inaccessible
- A sustained 12-week closure scenario projects Dated Brent reaching $154 per barrel
- Emergency strategic petroleum reserves across OECD nations were not designed to absorb losses of this scale over an extended period
According to reporting by Reuters, the US government's own energy arm assumed the Strait of Hormuz would remain shut through late May 2026, a striking admission of the disruption's severity.
Scenario Warning: Analysts project that if disruptions extend into late 2026, OECD buffer stocks could be fully depleted before physical supply normalises. A prolonged closure beyond 12 weeks would shift the oil market from a supply-disruption scenario into a structural shortage event with materially different pricing dynamics.
How Strait of Hormuz Disruptions Transmitted Into US Household Costs
The pathway from a Persian Gulf maritime disruption to an American consumer's fuel bill follows a well-established but underappreciated chain of economic transmission. Each link in that chain amplified the original price signal before it reached end consumers.
- Crude oil supply contracts as tanker transits through the Strait of Hormuz decrease, pushing Brent crude above $100 per barrel and toward approximately $105 per barrel in April 2026
- Refinery input costs rise as crude procurement becomes more expensive, directly increasing the production cost of gasoline, diesel, and jet fuel
- US pump prices exceed $4.50 per gallon on average, roughly 50% above pre-conflict levels, creating an immediate drain on household disposable income
- Transportation and freight costs increase across all goods categories as diesel-dependent logistics networks pass through higher fuel costs
- Headline CPI accelerates with the energy sub-index registering 17.87% year-over-year; gasoline specifically rising 18.9% and fuel oil surging 44.2%
- Core inflation follows with a lag, rising more modestly to approximately 2.6-2.8%, confirming energy as the dominant driver rather than broad-based demand
Energy Sub-Index Breakdown: April 2026
| Energy Component | Year-Over-Year Change |
|---|---|
| Overall Energy Index | +17.87% |
| Gasoline | +18.9% |
| Fuel Oil | +44.2% |
| Natural Gas (piped) | Data pending |
The asymmetry between energy inflation and core inflation is a critical detail for monetary policy analysis. It indicates that the Federal Reserve faces a genuinely difficult policy environment: raising rates can dampen demand but cannot increase Persian Gulf oil output or reopen a constrained maritime corridor. Furthermore, the scale of this oil market disruption compounds pre-existing vulnerabilities that had already been building across global energy supply chains.
How Financial Markets Repriced the Federal Reserve's Rate Path
Prior to the inflation acceleration, the dominant market narrative assumed the Federal Reserve would begin easing monetary policy in mid-2026. That consensus was dismantled with notable speed as the scale of the energy shock became apparent.
Current Market Positioning on Fed Policy (May 2026)
| Institution | Rate Outlook |
|---|---|
| CME FedWatch Tool | 2026 cuts fully priced out; 35% probability of a December hike |
| Bank of America | No rate cuts projected until 2027 |
| Goldman Sachs | First projected cut pushed to late 2026 at the earliest |
The 10-year US Treasury yield climbed to 4.4688% in the immediate aftermath of the April CPI release, a move that signals bond markets are not treating this as a transitory spike but as a structurally higher interest rate environment persisting well into the medium term. Consequently, market volatility and bonds have entered a new regime in which traditional safe-haven positioning is being reassessed alongside equity valuations.
Ellen Zentner of Morgan Stanley Wealth Management noted that corporate earnings would need to carry significantly more weight in supporting equity valuations given that valuation multiple expansion has become increasingly unlikely in a high-yield environment. This framing is particularly relevant for growth-oriented technology stocks whose valuations are highly sensitive to the discount rate applied to future earnings.
What Persistent Energy Inflation Means for Real Household Purchasing Power
The social and economic consequences of energy-driven inflation extend well beyond petrol price signage at service stations. When energy costs rise faster than wages, real purchasing power contracts even when nominal wages continue to increase.
Heather Long, chief economist at Navy Federal Credit Union, stated that the April 2026 inflation reading was effectively consuming all wage gains that workers had accumulated, leaving real disposable income flat or negative in purchasing power terms. This dynamic creates a self-reinforcing feedback loop that is damaging for consumer-facing businesses:
- Households experiencing real income compression reduce discretionary spending first
- Consumer-facing businesses see revenue softening precisely when their own energy and input costs are rising
- Margin compression intensifies from both ends of the income statement simultaneously
- Financing costs for expansion or debt refinancing are elevated by the same high-rate environment that is suppressing consumer demand
Margin Compression Risk Across Sectors
| Sector | Inflation Exposure | Rate Sensitivity | Combined Risk |
|---|---|---|---|
| Consumer Discretionary | High | High | Very High |
| Technology / Semiconductors | Moderate | Very High | Very High |
| Energy / Commodities | Low (price beneficiary) | Moderate | Low-Moderate |
| Industrials | High | Moderate | High |
| Financials | Low direct | High | Moderate |
The next major ASX story will hit our subscribers first
Why Semiconductor and Technology Stocks Face Compounding Pressure
Technology equities are navigating a dual headwind that distinguishes them from most other sectors during this particular inflationary cycle. Higher Treasury yields mechanically compress the present value of future earnings streams, and this effect is most pronounced for companies whose valuations are built on long-duration growth projections rather than near-term cash generation.
The Philadelphia Semiconductor Index fell 6% as investors reassessed whether AI-driven earnings growth trajectories could continue justifying current valuations against a risk-free rate approaching 4.5%. This repricing was not purely sentiment-driven; it reflected a mathematically defensible adjustment to discounted cash flow models when the discount rate rises materially.
The Samsung Labor Disruption: An Additive Supply Risk
Compounding the valuation pressure, Samsung Electronics shares fell 5.7% following the breakdown of labor negotiations involving approximately 50,000 workers. A prolonged strike would constrain global supply of AI accelerator chips and memory modules at a time when hyperscale cloud providers are aggressively expanding infrastructure capacity.
This supply-side risk is additive rather than redundant relative to existing geopolitical disruptions. Investors face a scenario in which both energy input costs and semiconductor component availability deteriorate simultaneously, creating a cost and capacity squeeze that affects the entire technology supply chain from component manufacturing through to end-product assembly.
Which Asset Classes Are Structurally Benefiting From Supply-Driven Inflation
When inflation originates from supply constraints rather than excess demand, commodity-producing sectors tend to outperform broad equity indices. This pattern is clearly evident in the current cycle.
Copper rose to a three-month high of $14,022 per tonne, driven by a combination of supply-chain tightness and the persistent structural demand generated by global electrification programmes. Copper's dual role as both an industrial input and an electrification-critical material gives it a particularly strong fundamental position during periods of supply disruption.
Oil and gas equities are capturing margin expansion as Brent crude remains above $100 per barrel, with upstream producers benefiting directly from the same energy price environment that is compressing margins elsewhere in the economy.
Gold continues functioning as a monetary hedge against both inflation persistence and geopolitical uncertainty, with gold safe-haven demand maintaining its historical role as a portfolio diversifier during periods when traditional asset correlations break down.
Strategic Note: Daniel Casali, Chief Investment Strategist at Evelyn Partners, has argued that even a successful diplomatic summit between major world powers would likely produce incremental outcomes such as an agreement not to escalate with new tariffs or export controls, rather than a genuine normalisation of energy tensions or supply-chain fragmentation. Investors should resist the temptation to reposition portfolios around diplomatic headline risk.
Why Ceasefire Headlines Are Unreliable Signals for Portfolio Positioning
One of the most operationally important distinctions for investors navigating this environment is the gap between a ceasefire announcement and an actual supply normalisation event. These are fundamentally different outcomes with very different market implications, and confusing the two has historically produced costly positioning errors.
Reuters reported that ceasefire negotiations weakened after the rejection of Tehran's proposed terms, extending the timeline for any potential energy supply normalisation. However, even a successful ceasefire would not produce an immediate recovery in oil flows through the Strait of Hormuz. Shipping activity, maritime insurance markets, vessel routing decisions, and port logistics all require weeks to months to adjust following a conflict-related disruption. Analysis from Al Jazeera on rising energy costs underscores how sustained this inflationary pressure may prove to be.
Scenario Framework: When Would Inflation Expectations Shift Lower?
| Trigger Condition | Expected Market Response |
|---|---|
| Strait of Hormuz shipping activity normalises | Oil prices fall; Treasury yields decline; rate cut probability rises |
| US Core CPI falls below 2.8% | Fed pivot narrative re-emerges; equity multiples expand |
| Samsung strike avoided or resolved quickly | Semiconductor supply stabilises; tech sector recovers |
| Prolonged disruption beyond 12 weeks | Brent crude approaches $145-$154; recession risk escalates |
Global Spillover Effects Beyond the United States
The inflationary consequences of US inflation and Strait of Hormuz oil disruptions are not contained within American borders. The shock is propagating through interconnected trade, energy, and financial systems across every major economy.
- Germany halved its economic growth projections in response to energy cost escalation, reflecting the acute vulnerability of Europe's industrial base to sustained high crude prices
- The IMF trimmed global growth estimates, citing energy price volatility as the primary downside risk to its baseline forecasts
- Demand destruction risk is emerging across price-sensitive economies, with analysts projecting a potential 5.3 mb/d demand contraction as higher prices force rationing and fuel substitution
- Global South economies face disproportionate vulnerability given their dependence on affordable fuel and fertiliser imports, with a UN resolution co-sponsored by Qatar and Gulf states highlighting the systemic risk to developing nations
- Russia emerges as a structural beneficiary of elevated oil prices, while Europe faces acute fuel shortage risks given its geographic proximity and historical import dependencies
The Three-Variable Dashboard Investors Should Track
Rather than reacting to individual geopolitical headlines, investors navigating this supply-disrupted, high-inflation environment should build a structured monitoring framework around three core indicators that will determine whether the current macro regime is tightening or beginning to ease.
1. Strait of Hormuz Shipping Activity
Vessel transit data and maritime insurance market spreads represent the earliest leading indicators of physical supply normalisation. Insurance markets are particularly informative because underwriters price conflict risk faster than diplomatic channels move, and a meaningful decline in war-risk premiums for Persian Gulf transits would signal that physical supply routes are genuinely recovering rather than merely paused.
2. US Core CPI Trajectory
Core CPI, currently running at approximately 2.6% to 2.8%, functions as the Federal Reserve's primary policy anchor. A sustained move below 2.8% would reopen the door to rate cut discussions and signal that demand destruction is beginning to outweigh supply-driven price pressures. Conversely, a core reading above 3.0% would meaningfully accelerate rate hike probability and likely trigger another repricing event across equity and bond markets.
3. US Treasury Yield Levels
The 10-year US Treasury yield at 4.4688% represents the current market equilibrium for monetary policy expectations. Movement above 4.6% would signal further tightening risk and additional multiple compression for growth equities. A decline below 4.2% would suggest that inflation expectations are genuinely moderating, creating conditions for a recovery in rate-sensitive sectors including technology, real estate, and consumer discretionary.
Frequently Asked Questions: US Inflation and Strait of Hormuz Oil Disruptions
What caused US inflation to reach 3.8% in April 2026?
US CPI reached 3.8% year-over-year in April 2026, the highest reading since May 2023, driven primarily by a 17.87% surge in energy prices following supply disruptions through the Strait of Hormuz. Gasoline rose 18.9% and fuel oil climbed 44.2% year-over-year, while core inflation remained more contained at approximately 2.6% to 2.8%, confirming energy as the dominant driver rather than broad-based demand overheating.
How much oil flows through the Strait of Hormuz?
Approximately one-fifth of all globally traded oil transits the Strait of Hormuz daily. During the March 2026 disruption peak, global oil supply fell by an estimated 10.1 million barrels per day, with weekly supply losses reaching approximately 100 million barrels while the strait remained effectively closed.
Will the Federal Reserve cut rates in 2026?
As of May 2026, markets have fully priced out a 2026 rate cut. CME FedWatch data shows a 35% probability of a 25-basis-point rate hike by December 2026. Bank of America projects no cuts until 2027, while Goldman Sachs has shifted its first projected cut to late 2026 at the earliest.
What oil price level signals a severe inflation scenario?
Analysts project that a sustained 12-week Strait of Hormuz closure could push Dated Brent crude to $154 per barrel. The severe scenario range sits between $145 and $154 per barrel, compared to the current level of approximately $105 per barrel following initial disruptions.
What would cause inflation expectations to shift lower?
Two primary triggers would shift the inflation outlook: normalisation of shipping flows through the Strait of Hormuz reducing crude oil prices, or a sustained decline in US core CPI below 2.8%, indicating that demand destruction is outpacing supply-driven price pressures and reopening the path toward Federal Reserve monetary easing.
Disclaimer: This article is intended for informational purposes only and does not constitute financial or investment advice. All forecasts, scenario projections, and market pricing data referenced reflect conditions as reported at the time of writing and are subject to rapid change given the fluid nature of geopolitical and macroeconomic developments. Past market behaviour is not indicative of future outcomes. Readers should conduct independent research and consult qualified financial advisers before making any investment decisions.
Want To Position Ahead of the Next Major Commodity Discovery Driven by Macro Disruption?
When supply shocks reshape energy markets and compress margins across sectors, commodity producers — particularly those with new mineral discoveries — can offer a structural advantage that broad equity indices simply cannot replicate. Discovery Alert's proprietary Discovery IQ model delivers real-time alerts on significant ASX mineral discoveries the moment they are announced, transforming complex geological data into actionable investment opportunities — begin your 14-day free trial today, or explore how historic discoveries have generated exceptional returns to understand why getting in early makes all the difference.