May 11, 2026
When the Buffer Runs Out: Inside the 2026 Global Petroleum Inventory Crisis
Energy markets have long operated on a foundational assumption: that the world maintains enough stored petroleum to absorb short-term supply disruptions before they cascade into economy-wide crises. Strategic reserves, commercial stockpiles, and floating cargo inventories form a layered defence system designed to buy time whilst geopolitical or logistical problems resolve themselves. That assumption is now being tested at a scale the modern oil market has never encountered.
The oil supply shock and plunging petroleum inventories now defining global energy markets in mid-2026 represent something qualitatively different from prior disruptions. This is not a demand collapse like 2020, nor a coordinated production cut like 1973. It is a structural severance of the world's most critical petroleum artery, and the inventory buffers built to absorb temporary disruptions are disappearing faster than at any point in recorded energy market history.
Understanding what is happening, why it matters, and how deep the damage may run requires looking beyond futures prices and diplomatic headlines into the physical mechanics of how oil actually moves through the global system.
When big ASX news breaks, our subscribers know first
What Happens When a Chokepoint Closes: The Physics of a Supply Shock
An oil supply shock occurs when the physical availability of crude or refined products diverges sharply from what the market expects to receive. This is distinct from sentiment-driven price moves, where traders reprice risk without any actual cargo being interrupted. The 2026 disruption is emphatically a physical market event, not a speculative one.
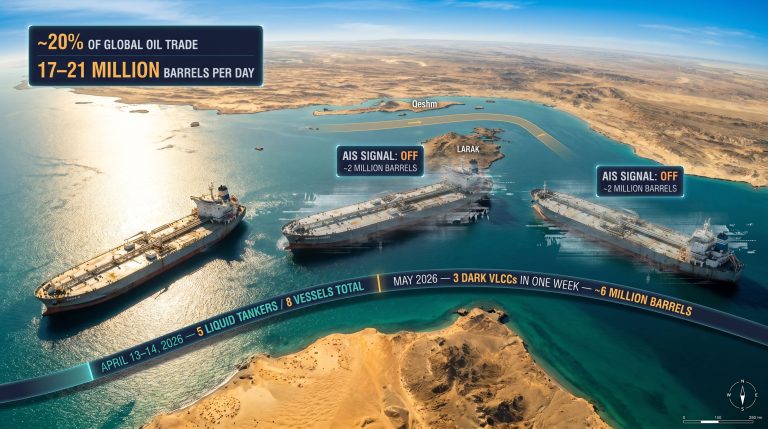
Roughly 20% of global crude oil transits the Strait of Hormuz on any given day, making it the single most consequential maritime chokepoint in the world energy system. When military strikes on Iranian territory in late February 2026 triggered an effective closure of the Strait, approximately 10 to 11 million barrels per day (mbpd) of supply was instantly cut off from global markets. That figure represents a disruption volume roughly double any prior crisis in the post-World War II era.
The mechanics of how this translates into downstream inventory depletion are sequential and largely invisible to consumers until the damage accumulates:
- Week 1 to 3: Cargo flows cease or are severely curtailed; tankers divert, anchor, or await clearance
- Week 3 to 6: Import-dependent refineries begin drawing on onshore crude stocks to maintain run rates
- Week 6 to 10: Refined product inventories start declining as refinery feedstock constraints reduce output yields
- Week 10 onwards: Commercial fuel buffers reach critically low levels; price signals intensify across all markets
The critical distinction from prior crises is structural. In 1973, Arab producers cut output but could theoretically reverse the decision quickly. In 1979, Iran went offline but other Gulf producers had meaningful spare capacity to deploy. In 2026, virtually every major Gulf producer's export capacity sits behind the closed Strait. There is no OPEC spare capacity lever that can be pulled to compensate, because the mechanism for deploying that capacity is the same waterway that is inaccessible.
How the 2026 Disruption Compares to Every Prior Oil Crisis
Historical context matters enormously for calibrating the severity of the current situation. The table below places the 2026 Hormuz closure alongside the three most significant oil supply disruptions of the past half century:
| Crisis Event | Estimated Daily Supply Loss | Duration | Peak Price Impact |
|---|---|---|---|
| 1973 Arab Oil Embargo | ~5 mbpd | ~6 months | +400% |
| 1979 Iranian Revolution | ~5 mbpd | ~12 months | +150% |
| 1990 Gulf War | ~4.3 mbpd | ~7 months | +90% |
| 2026 Hormuz Closure | 10–11 mbpd | Ongoing as of May 2026 | +40–60% and rising |
The most striking feature of this comparison is not the supply loss magnitude, though that is unprecedented. It is the relative price restraint. A disruption double the size of 1973's embargo has produced a price increase that, so far, is far smaller in percentage terms. Several forces explain this apparent paradox:
- Futures markets are actively pricing in a probability of diplomatic resolution between the United States and Iran, suppressing the price signal relative to physical reality
- Demand destruction is already occurring in price-sensitive emerging markets across Asia, Africa, and Latin America, partially offsetting the raw volume shortfall
- Commercial and strategic inventories have been absorbing the gap, delaying the full price transmission to end consumers
- U.S. production at its pre-crisis baseline of 13.713 mbpd (as of mid-February 2026) provided some initial domestic insulation
The uncomfortable implication is that if futures market optimism proves premature and diplomatic resolution is delayed, the price adjustment still ahead may be substantial. Furthermore, physical inventory depletion is accelerating regardless of what futures contracts price in.
The Anatomy of the 2026 Global Inventory Collapse
How Fast Are Global Oil Inventories Falling?
The pace of inventory depletion in 2026 is without modern precedent. Goldman Sachs analysts estimate that global oil inventories have fallen to an eight-year low, with total stocks sitting at approximately 101 days of expected demand as of early May 2026. If the Strait of Hormuz remains inaccessible through the end of May, Goldman projects that figure could decline further to 98 days of demand, erasing buffers that took years to rebuild after prior disruptions.
According to Goldman Sachs analysts, while global oil stocks are unlikely to reach absolute minimum operational levels during summer 2026, the speed of depletion and the scale of supply losses in specific regions and product categories is deeply concerning.
The raw numbers behind this assessment are staggering:
- Global hydrocarbon inventories are being drawn at a rate of 10 to 13 million barrels per day to balance the market against the supply shortfall
- Approximately 200 million barrels were consumed from global stocks in April 2026 alone, representing the largest single-month inventory draw on record
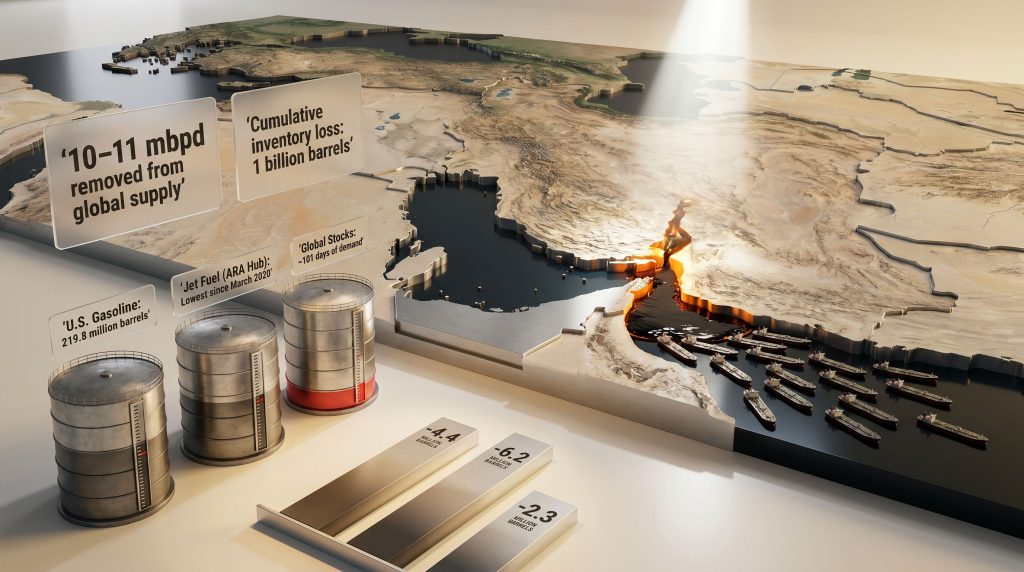
- Cumulative inventory losses since late February 2026 have now exceeded 1 billion barrels, a figure that dwarfs any coordinated strategic reserve release in history
The depletion has unfolded in two distinct stages. The initial weeks of the disruption were cushioned by the pre-crisis surplus that existed when the Iran conflict began. That buffer, estimated at 2 to 3 mbpd of oversupply, was rapidly consumed within the first month. Commercial inventories are now bearing the full weight of the shortfall with no surplus cushion remaining.
Kpler analyst Sumit Ritolia observed in a published analysis that inventory drawdowns across onshore stocks, commodities on water, and key distribution hubs including the Amsterdam-Rotterdam-Antwerp complex, the United States, and Singapore are helping to bridge supply gaps, but that this inventory support is finite and cannot sustainably offset a prolonged disruption.
Patrick Pouyanné, Chief Executive of TotalEnergies, quantified the stakes with unusual directness during the company's first quarter 2026 earnings call. He stated that global hydrocarbon inventories were already being drawn at a pace of 10 to 13 million barrels per day to balance the market, and that by the time supplies are restored and reach consumers, the world will have consumed approximately 1 billion barrels of stockpiled petroleum. Even under an optimistic scenario where the conflict ends in May 2026, Pouyanné indicated markets would exit the crisis period with inventory levels that are clearly very low.
Why Refined Product Inventories Are the Most Vulnerable
Crude oil drawdowns capture headlines, but the refined product market is where the crisis is most acutely felt by consumers, airlines, manufacturers, and logistics operators. Goldman Sachs estimates that refined fuel stocks have dropped to approximately 45 days of demand, down from 50 days before the crisis began, a 10% reduction in less than three months.
The vulnerability of refined products stems from the supply chain lag between crude disruptions and their downstream manifestation. When Middle Eastern crude stops flowing, refineries initially continue operating by drawing on stored crude. As stored crude is consumed, refinery run rates are forced lower, meaning reduced refined product output only becomes visible as product inventory depletion weeks after the crude disruption began. By May 2026, that lag had expired and refined product stocks entered accelerating decline.
| Product Category | Pre-Crisis Buffer | Current Level (Early May 2026) | Change |
|---|---|---|---|
| Total Refined Fuels | ~50 days of demand | ~45 days of demand | -10% |
| Jet Fuel (ARA Hub) | Normal seasonal levels | Lowest since March 2020 | -4.7% in final week of April alone |
| U.S. Gasoline | Above 5-year average | 219.8 million barrels | 4% below 5-year average; lowest for this time of year since 2014 |
Jet fuel deserves particular attention. The ARA hub, which serves as Europe's primary refined product storage and distribution nerve centre, saw independently stored jet fuel inventories fall 4.7% in the final week of April alone, reaching their lowest level since March 2020, according to data from Dutch consultancy Insights Global. The March 2020 comparison is instructive: that trough reflected collapsed demand during COVID-19 lockdowns, not supply constraints. Today's equivalent level reflects structural supply tightness against largely intact demand, a qualitatively more dangerous situation for airlines and aviation networks.
Germany has already begun seeking alternative jet fuel supplies from Israeli sources as Hormuz disruptions cripple normal procurement channels. Lufthansa has publicly warned that the Strait closure will add approximately $2 billion in fuel costs to its operations. Consequently, the EU has responded by mandating that airlines compensate passengers for cancellations driven by fuel price surges.
How Is the Oil Supply Shock Reshaping U.S. Petroleum Inventories?
The U.S. Inventory Drawdown: Week-by-Week Deterioration
The United States entered the crisis with the largest strategic petroleum reserve of any nation, but the drawdown pattern across consecutive EIA weekly reports tells a story of accelerating domestic inventory pressure that is proving difficult to arrest. Indeed, falling U.S. oil inventories are putting significant upward pressure on fuel prices across the country.
| Week Ending | Crude Oil Draw (million bbls) | Gasoline Draw (million bbls) | Notable Context |
|---|---|---|---|
| February 13, 2026 | -0.609 | Not reported | Pre-shock baseline; U.S. production at 13.713 mbpd |
| April 17, 2026 | -4.4 | Not reported | First major post-shock inventory reversal |
| April 24, 2026 | -6.2 (EIA) | -8.47 | Defied analyst expectations for a build |
| May 1, 2026 | -2.3 | -2.5 (following -6.1 prior week) | Consecutive multi-week decline pattern confirmed |
The week ending April 24 is particularly telling. Analysts had expected a build in crude inventories based on seasonal patterns and domestic production levels. The actual outcome, a 6.2 million barrel draw on crude and an 8.47 million barrel draw on gasoline in a single week, defied those expectations and signalled that the physical supply shock was hitting domestic markets with greater force than consensus models anticipated.
The U.S. Strategic Petroleum Reserve currently holds approximately 415.4 million barrels, which sounds substantial until it is placed in context. The SPR sits roughly 310 million barrels below its full operational capacity, limiting the government's ability to sustain large-scale emergency releases. At the current market draw rate of 10 to 13 million barrels per day globally, even a full SPR deployment would provide limited relief measured in weeks rather than months.
Why Are U.S. Gasoline Stocks Heading Toward Historic Lows?
Morgan Stanley analysts projected in early May 2026 that U.S. gasoline inventories are on a trajectory to fall below 200 million barrels by the end of August 2026, a level that would represent a historic seasonal low with no modern parallel.
As of May 1, 2026, U.S. gasoline stocks stood at 219.8 million barrels, already 4% below the five-year seasonal average and the lowest for this time of year since 2014. Morgan Stanley described the U.S. gasoline market as genuinely tight and tightening further into summer, as reported by Bloomberg.
Three structural forces are compounding the depletion:
- Export arbitrage acceleration: U.S. crude and refined fuel exports are being redirected toward premium-paying Asian buyers who are desperate for supply, accelerating domestic inventory depletion. U.S. fuel exports hit a record high in early May 2026 as traders exploited the global price differential.
- Refinery yield compression: Middle Eastern crude grades, characterised by specific sulfur content and API gravity profiles, are highly optimised for certain refinery configurations. Reduced availability of these grades forces refineries to use alternative crude slates that deliver different, often less optimal, refined product yields.
- Demand destruction asymmetry: Price-sensitive consumers in emerging markets are reducing consumption first, but this relief is not reaching U.S. fuel inventories in any meaningful way. The domestic price signal, with the national average exceeding $4.50 per gallon and California prices surpassing $6.00 per gallon, has not yet generated the same degree of demand destruction in American consumers as in lower-income markets globally.
What the Physical Market Is Telling Us That Futures Prices Are Not
The Divergence Between Sentiment and Reality
One of the most consequential and underappreciated dynamics in the current crisis is the growing gap between what futures markets are pricing and what physical markets are experiencing. Futures contracts for crude oil are partially suppressed by the probability traders assign to a U.S.-Iran diplomatic agreement and a subsequent Strait reopening. Physical market participants, however, are dealing with actual cargo unavailability, tanker repositioning delays, and depleted spot inventories that no diplomatic statement can immediately reverse.
This divergence is visible in the structure of oil futures curves. Backwardation, where near-term contracts trade at a premium to later-dated contracts, is a reliable structural signal of physical market tightness. When spot barrels are scarce and buyers urgently need supply now rather than months from now, near-term prices rise relative to deferred prices. The degree of backwardation in current crude markets is reflecting genuine physical scarcity that headline price levels partially obscure.
Additional physical constraints are developing in real time. Iranian expanded control zones around the Strait have caused tankers to cluster off Dubai, creating congestion and repositioning delays that compound the direct supply interruption. An explosion struck a South Korean cargo vessel in the Strait of Hormuz in early May, illustrating that the risk environment for maritime transit remains actively dangerous rather than merely politically fraught. As oil futures markets remain too complacent about the supply shock, physical inventories continue to deteriorate.
Why Even an Immediate Hormuz Reopening Would Not Solve the Inventory Crisis
ExxonMobil Chief Executive Darren Woods provided perhaps the most precise technical explanation of the supply chain recovery challenge during the company's first quarter 2026 earnings call. Woods emphasised that the market has not yet seen the full impact of the unprecedented disruption to world oil and natural gas supply, and that if the Strait remained closed, there was more pressure still to arrive. Critically, he stated that even if the Strait opened immediately, a lag of one to two months would exist between the opening and any normalisation of market flows, because tankers must first reposition from alternative anchorages to loading terminals before the first post-reopening cargoes can even begin their voyage to destination markets.
The recovery timeline, step by step, looks like this:
- Weeks 0 to 2: Diplomatic agreement reached; tanker traffic authorisation issued by relevant parties
- Weeks 2 to 4: Tanker repositioning phase; vessels sail from alternative anchorages to Gulf loading terminals
- Weeks 4 to 8: First post-reopening cargoes loaded and in transit; nothing has yet arrived at destination markets
- Weeks 8 to 12: Refined product availability begins normalising at key import hubs like ARA and Singapore
- Months 3 to 6: Commercial inventory levels begin recovering toward pre-crisis baselines under favourable conditions
The timing is particularly damaging because peak summer driving season in the Northern Hemisphere will overlap with the early recovery phase. Even under the most optimistic reopening scenario, no meaningful inventory rebuild is possible before September 2026.
The next major ASX story will hit our subscribers first
How Are Global Supply Chains Being Disrupted Beyond Crude Oil?
The Petrochemical and Industrial Cascade Effect
The oil supply shock and plunging petroleum inventories are propagating through supply chains well beyond the transport fuel market. Several critically important industrial feedstocks originate in or transit through the affected region:
- Naphtha, the primary feedstock for plastics, synthetic fibres, and agricultural fertilisers, is predominantly sourced from Gulf producers. Naphtha shortages are already triggering a plastics crisis across Asian manufacturing hubs, as reported by OilPrice.com in early May 2026.
- Helium, a byproduct of natural gas production concentrated significantly in Qatar, is critical for semiconductor fabrication and medical imaging equipment. Supply constraints here have long lead times and are difficult to substitute.
- LPG and petrochemical intermediates used across Asian and South Asian manufacturing supply chains are experiencing cascading availability pressures.
Pakistan issued emergency LNG tenders for two cargoes in early May as a power grid crisis deepened, illustrating how the disruption is compressing energy availability in import-dependent nations with fragile infrastructure. In addition, Europe's gas market is separately bracing for a winter shock, with traders pricing in the possibility that gas prices could double by the heating season.
Regional Inventory Stress Points: A Global Comparison
| Region | Primary Vulnerability | Current Stress Indicator |
|---|---|---|
| Asia-Pacific | Naphtha, jet fuel, LPG | Plastics crisis emerging; emergency LNG tenders issued |
| Europe (ARA Hub) | Jet fuel, heating oil | Jet fuel at lowest level since March 2020; winter gas market at risk |
| United States | Gasoline, distillates | Gasoline at 12-year seasonal low; prices near 4-year highs |
| South Asia | LNG, fuel oil | Pakistan emergency LNG tender; power grid stress |
The "rolling disruption" pattern characteristic of major supply shocks is now visible. Asia absorbs the first wave given its proximity and import dependency. European and North American industrial supply chains typically feel the second wave within 60 to 90 days as global product markets tighten and spot availability contracts.
What Are Major Energy Institutions and Executives Saying?
Institutional Forecasts and Executive Warnings
The institutional consensus on the current inventory crisis is unusually aligned and unusually alarmed. Key assessments include:
- Goldman Sachs: Global inventories approaching an eight-year low; total stocks at approximately 101 days of demand and potentially falling to 98 days by end of May 2026; fuel buffers approaching very low levels fast
- Morgan Stanley: U.S. gasoline stocks projected to fall below 200 million barrels by end of August 2026, a historically unprecedented seasonal low
- Kpler: Inventory support across onshore stocks, floating cargo, and key hubs is finite and cannot sustainably offset prolonged disruptions
- Chevron CEO: Publicly warned of emerging physical shortages in crude oil, a signal rarely issued by major integrated producers and one that typically precedes significant market dislocations
- IEA: Flagged the sharpest demand destruction in five years in price-sensitive markets whilst warning that tight gas markets will persist through 2030
- ExxonMobil CEO Darren Woods: Described the disruption as unprecedented and warned that the market has not yet seen its full impact
What makes this convergence of warnings significant is its breadth. Producers, analysts, investment banks, and international agencies are simultaneously sounding alarm about different facets of the same underlying crisis. The consistency of the message across institutions that normally disagree significantly on market outlook adds credibility to the severity of the inventory situation.
What Does Demand Destruction Actually Mean in This Context?
Demand destruction is the involuntary reduction in consumption that occurs when prices exceed affordability thresholds for a segment of the market. It is not a voluntary conservation response; it is economic exclusion from the fuel market.
Currently, demand destruction is concentrated in:
- Emerging markets: Price-sensitive consumers in Asia, Africa, and Latin America are reducing fuel consumption as pump prices become unaffordable relative to local incomes
- Asian industrial buyers: Manufacturers are curtailing output due to naphtha and petrochemical feedstock unavailability, not purely due to price signals
The critical point that many market observers miss is that demand destruction in developing markets does not proportionally relieve inventory pressure in Western markets. The products being displaced in Bangkok or Lagos are not the same products sitting in ARA jet fuel tanks or U.S. Gulf Coast gasoline terminals. Global petroleum markets are interconnected but not perfectly fungible across products, grades, and geographies.
What Are the Macroeconomic Risks of a Prolonged Oil Supply Shock?
Oil Shocks and Recession: The Historical Correlation
The historical relationship between oil supply shocks and economic recession is among the most robust in macroeconomic data. Oil price shocks have preceded 10 of the 12 post-World War II U.S. recessions, making the current situation a legitimate recession risk trigger rather than a theoretical concern.
The transmission mechanisms from supply shock to economic contraction operate through several channels simultaneously:
- Consumer spending squeeze: Rising fuel costs directly reduce household discretionary income, with lower-income households experiencing a disproportionate burden
- Input cost inflation: Energy-intensive industries, including chemicals, transport, agriculture, and manufacturing, face sudden margin compression that cannot be immediately passed through to customers
- Supply chain cascade: Petrochemical and feedstock shortages ripple through manufacturing sectors with 60 to 90 day lags, creating output disruptions that compound the direct energy cost impact
- Central bank policy conflict: Inflation driven by energy supply constraints is not responsive to interest rate increases, yet central banks face pressure to tighten in response, creating a growth-dampening policy response to a non-monetary problem
Scenario Analysis: Three Possible Outcomes
| Scenario | Core Assumption | Inventory Trajectory | Price Outlook |
|---|---|---|---|
| Base Case | Hormuz reopens June 2026 | Stocks stabilise by Q3; partial recovery by Q4 | WTI moderates to $85–95 range |
| Prolonged Closure | Strait restricted through Q3 2026 | Stocks fall to operational minimums; rationing risk emerges | WTI sustains above $110; recession risk elevated |
| Escalation | Further infrastructure strikes or naval incidents | Catastrophic depletion; emergency rationing | Price spike to $130–$150+; global recession probable |
Disclaimer: Scenario projections involve significant uncertainty and should not be interpreted as investment advice. Energy market conditions can change rapidly based on geopolitical developments, diplomatic outcomes, and factors that are inherently unpredictable. All scenario assumptions represent analytical frameworks, not forecasts.
How Are Governments and Energy Companies Responding?
Policy Responses and Sovereign Energy Security Investment
The scale of the current oil supply shock and plunging petroleum inventories has prompted a range of policy responses across affected nations:
- Australia announced a $7 billion fuel stockpile investment plan and directed LNG exporters to reserve 20% of gas production for the domestic market, a model being closely watched by other import-dependent nations seeking to reduce vulnerability to external supply disruptions
- The European Union suspended methane regulations as the energy crunch intensified, reversed its position on domestic gas drilling to improve energy security, and mandated that airlines compensate passengers for cancellations driven by fuel price surges
- U.S. senators have pushed to reinstate Russian oil sanctions, introducing geopolitical complexity into an already strained supply environment
- IEA member nations are coordinating strategic reserve release mechanisms, though the scale of available SPR deployment is constrained by the depletion that has already occurred
How Are Energy Companies Adapting Operations?
Corporate responses to the supply shock are revealing about where integrated producers see value and risk:
- Equinor committed to $1.8 billion in new drilling contracts to sustain production volumes, representing a counter-cyclical capital deployment signal that suggests the company expects elevated prices to persist
- Shell and INEOS announced a Gulf of Mexico exploration partnership, a longer-dated supply diversification play oriented toward developing production capacity outside the Hormuz chokepoint
- Iraq began offering significant discounts to incentivise tanker operators willing to navigate the risks of Hormuz transit, illustrating the economic distortions that chokepoint closures create for producers who have no alternative export route
- U.S. fuel exporters hit record export volumes as traders arbitraged the price differential between domestic supply and premium-paying Asian buyers, a dynamic that is simultaneously profitable for traders and accelerating domestic inventory depletion
Frequently Asked Questions: Oil Supply Shock and Plunging Petroleum Inventories
What is causing global petroleum inventories to fall so rapidly in 2026?
The closure of the Strait of Hormuz following military strikes on Iran in late February 2026 has removed approximately 10 to 11 million barrels per day from global supply. This disruption is roughly double the daily volume loss of any prior oil crisis. To balance the market, global inventories are being drawn at 10 to 13 million barrels per day, a rate that has depleted over 1 billion barrels of stored petroleum since late February.
How low are U.S. gasoline inventories right now?
As of May 1, 2026, U.S. gasoline stocks stood at 219.8 million barrels, which is 4% below the five-year seasonal average and the lowest level for this time of year since 2014. Morgan Stanley projects these stocks will fall below 200 million barrels by the end of August 2026, which would represent a historically unprecedented seasonal low.
Will oil prices fall if the Strait of Hormuz reopens?
Not immediately. A minimum one to two month supply chain lag exists between any reopening and the arrival of normalised cargo flows at destination markets. Summer demand peaks will overlap with the early recovery phase, preventing meaningful inventory rebuilding before September 2026. With cumulative inventory losses exceeding 1 billion barrels, any price moderation will be gradual rather than immediate.
What products are most affected by the oil supply shock beyond gasoline?
Jet fuel, heating oil, naphtha (the primary feedstock for plastics and synthetic materials), LPG, fertiliser precursors, and helium are all under significant pressure. Cascading effects are already visible in Asian plastics manufacturing, aviation fuel supplies across European hubs, and power grid stress in South Asian nations including Pakistan.
How does the 2026 oil supply shock compare to the 1973 oil embargo?
The 2026 disruption removes more than double the daily supply volume of the 1973 embargo, affects a broader range of petroleum products simultaneously, and eliminates the spare capacity buffer mechanism that allowed prior crises to be partially offset by other producers. The resolution timeline is also less predictable, as it depends on military and diplomatic developments rather than a producer cartel's internal negotiating dynamics.
What is the Strategic Petroleum Reserve and can it solve the inventory crisis?
The U.S. Strategic Petroleum Reserve is a government-owned emergency crude oil stockpile currently holding approximately 415.4 million barrels, roughly 310 million barrels below its full operational capacity. At the current global market draw rate of 10 to 13 million barrels per day, even a full SPR release at maximum daily throughput capacity would provide weeks of meaningful relief, not months. The SPR was designed to buffer short, sharp disruptions, not to substitute for an ongoing 10 to 11 mbpd global supply shortfall.
Why the Worst of the Inventory Crisis May Still Be Ahead
The Structural Gap Between Market Optimism and Physical Reality
The central tension defining global energy markets in May 2026 is the gap between what futures markets are pricing and what physical inventories are recording. Futures markets are discounting the probability of diplomatic resolution. Physical markets are recording the fastest sustained inventory depletion in the modern era of the petroleum industry.
Both cannot be simultaneously correct in their implications. Either diplomatic resolution arrives quickly and the physical damage proves temporary and reversible, or physical depletion continues beyond what markets have priced in and the price adjustment still to come is substantially larger than current levels reflect.
Three variables will ultimately determine how severe the inventory crisis becomes:
- Duration of Strait inaccessibility: Every additional week of closure adds roughly 70 to 90 million barrels to the cumulative inventory deficit
- Speed and scale of demand destruction in price-sensitive markets: How quickly emerging market consumption falls will determine how much relief arrives before Western inventory buffers are exhausted
- Whether secondary disruptions compound the primary shock: Additional refinery attacks, tanker incidents, or infrastructure strikes could accelerate the depletion trajectory beyond current projections
Key Takeaways
- Global oil inventories have fallen to an eight-year low, with total stocks at approximately 101 days of demand and potentially declining to 98 days by end of May 2026
- Refined fuel buffers are depleting faster than crude; jet fuel at the ARA hub has reached its lowest level since March 2020
- A minimum one to two month supply chain recovery lag exists even if the Strait reopens immediately, with peak summer demand overlapping the early recovery phase
- Cumulative inventory losses since late February 2026 exceed 1 billion barrels, a deficit that cannot be rapidly replenished under any realistic scenario
- Recession risk is elevated; oil supply shocks have preceded the overwhelming majority of post-war U.S. economic contractions
- Demand destruction is currently concentrated in emerging markets, but Western inventory pressure is intensifying and the gap between futures pricing and physical reality remains a significant market risk
This article is intended for informational and educational purposes only and does not constitute investment, financial, or legal advice. Energy market conditions are subject to rapid change based on geopolitical, diplomatic, and operational developments. Readers should conduct their own due diligence before making any investment or business decisions based on the information presented here.
Want To Position Yourself Ahead of the Next Major Resource Discovery?
Whilst the world watches oil inventories deplete at record-breaking rates, savvy investors know that supply shocks and energy crises historically accelerate demand for alternative resources and drive significant mineral discovery opportunities on the ASX — and Discovery Alert's proprietary Discovery IQ model delivers real-time alerts the moment those discoveries are announced, turning complex data across 30-plus commodities into clear, actionable insights. Explore historic examples of major discoveries and their market returns, then begin a 14-day free trial at Discovery Alert to ensure you are positioned ahead of the market when the next transformative find is made.