August 3, 2026
The Compounding Logic Behind Gulf Energy Outperformance
When global energy markets enter periods of elevated geopolitical tension, the conventional assumption is that supply disruption risk rises uniformly across all producing nations. Yet the mechanics of oil market pricing, quota architecture, and export infrastructure do not affect every Gulf producer equally. Some nations absorb the volatility; others capture the upside while sidestepping the operational downside. Understanding which producers fall into which category requires moving beyond headline production figures and examining the structural conditions that determine whether a production surge is cyclical noise or something far more durable.
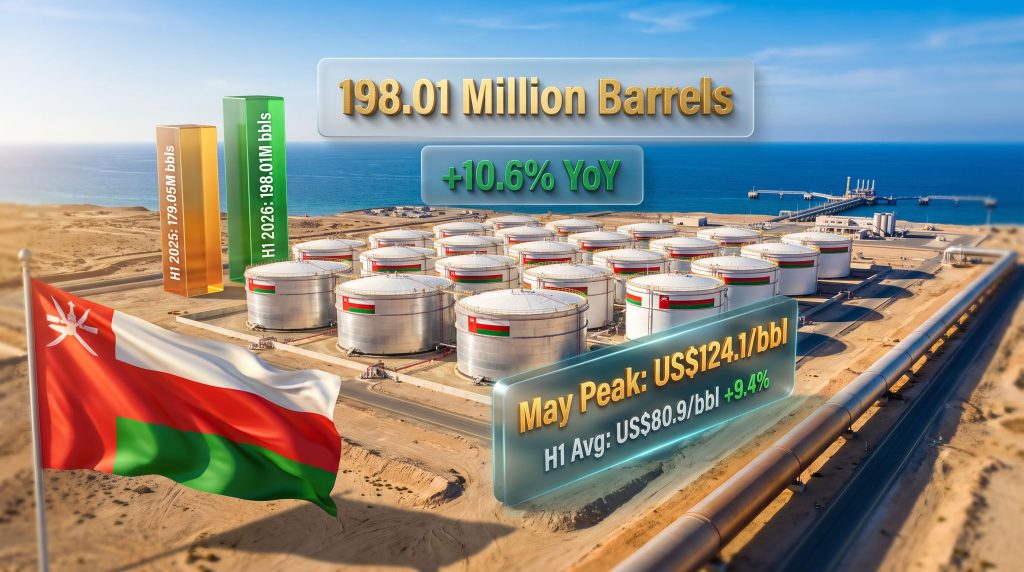
Oman oil output rises 10.6% year-on-year during January through June 2026, and this is not simply a volume story. It reflects the convergence of OPEC+ quota mechanics, upstream investment maturation, price tailwinds, and a geographic export advantage that few analysts have fully priced into long-term sovereign credit assessments.
When big ASX news breaks, our subscribers know first
Why Oman's Production Surge Is Structurally Different From a Cyclical Recovery
The OPEC+ Architecture That Created the Ceiling Room
Oman's output expansion did not occur in a policy vacuum. The OPEC and global oil markets alliance's decision to raise production ceilings in May 2026, followed by a further quota uplift effective July 2026, created the formal headroom within which Oman could legitimately scale volumes without breaching its multilateral commitments. This is a critical distinction: Oman did not exceed its allowances; it filled them more completely than in prior periods, reflecting improved capacity utilisation across its upstream portfolio.
This matters because it signals that the production increase is sanctioned, planned, and supported by real reservoir throughput rather than quota non-compliance, which has plagued other OPEC+ members and attracted internal coalition friction.
From 989,200 to 1.1 Million Barrels Per Day: What the Step-Change Represents
Oman's average daily oil production climbed from 989,200 barrels per day (bpd) in the first half of 2025 to approximately 1.09 to 1.10 million bpd across the same period in 2026. Crossing and sustaining output above the 1 million bpd threshold is not a trivial milestone in Gulf energy terms. It reflects years of upstream capital deployment, enhanced oil recovery (EOR) programme maturation, and reservoir management discipline converging simultaneously.
The monthly peaks tell an even sharper story, as confirmed by recent output data:
- May 2026: Average daily output reached 1.172 million bpd, the highest single-month average recorded in the first half of the year
- June 2026: Output remained elevated at 1.145 million bpd, suggesting this was not a one-month anomaly driven by operational scheduling
Critically, Oman has been deploying steam-injection and polymer flooding EOR techniques across its mature onshore fields for over a decade. These capital-intensive programmes have long gestation periods, meaning the production gains seen in 2026 partially represent the delayed return on investment cycles initiated several years earlier. This EOR maturity dynamic is frequently underappreciated by analysts who focus exclusively on new field additions.
Breaking Down the H1 2026 Production and Pricing Data
The Full Scorecard: Production, Exports, and Price
| Metric | H1 2025 | H1 2026 | Year-on-Year Change |
|---|---|---|---|
| Total Oil Production | 179.05 million barrels | 198.01 million barrels | +10.6% |
| Average Daily Output | ~989,200 bpd | ~1.09-1.10 million bpd | +10%+ |
| Peak Monthly Output | N/A | May: 1.172 million bpd | N/A |
| Oil Exports | 151.6 million barrels | 155.22 million barrels | +2.4% |
| Average Crude Price | US$74.0/bbl | US$80.9/bbl | +9.4% |
| Peak Monthly Price | N/A | May: US$124.1/bbl | N/A |
| June Average Price | N/A | US$104.7/bbl | N/A |
Data sourced from Oman's National Centre for Statistics and Information (NCSI).
The Production-Export Divergence: A Signal Worth Unpacking
One of the most analytically interesting features of the H1 2026 data is the significant gap between production growth and export growth. Total production expanded by 10.6%, while oil exports grew by a far more modest 2.4%, rising from 151.6 million barrels to 155.22 million barrels.
This divergence is not a data anomaly. Furthermore, several explanations are plausible, and each carries different implications:
- Increased domestic refining throughput: Oman has been expanding its downstream refinery capacity, and directing more crude toward domestic processing facilities reduces the volume available for direct export while adding value within the national economy
- Feedstock allocation to petrochemical operations: Oman's industrial diversification strategy under Vision 2040 includes building out petrochemical and industrial manufacturing, which consumes crude and condensate as raw inputs
- Strategic inventory accumulation: Producers periodically build stockpiles ahead of anticipated price movements or seasonal demand peaks, which would depress near-term export volumes without reducing production
Regardless of the precise cause, the gap between production and export growth is consistent with an economy actively trying to capture more of the hydrocarbon value chain domestically, rather than simply shipping raw crude for processing elsewhere.
May 2026's Extraordinary Price Spike: Geopolitical Risk Pricing in Action
The average selling price of Omani crude climbed 9.4% from US$74.0 per barrel in H1 2025 to US$80.9 per barrel in H1 2026. However, the H1 average masks a far more dramatic intra-period price movement. The geopolitical oil price tensions embedded in crude benchmarks during this period pushed the May 2026 monthly average to a remarkable US$124.1 per barrel. June's average of US$104.7 per barrel suggests partial price normalisation, though it remained well above the broader H1 mean.
Critical Insight: The dual effect of volume growth and price appreciation creates a multiplicative rather than additive fiscal revenue outcome. A 10.6% production increase layered onto a 9.4% price increase does not produce an approximately 20% revenue uplift; the compounding of these two variables across 198 million barrels generates outsized fiscal gains relative to what either variable would deliver in isolation.
Oman's Strait of Hormuz Bypass: An Underappreciated Structural Advantage
Why Export Geography Is a Credit-Positive Factor
The Strait of Hormuz remains one of the world's most strategically sensitive energy chokepoints, with approximately 20% of global oil supply transiting through it annually according to the U.S. Energy Information Administration. When regional tensions escalate, tanker insurance premiums spike, transit timelines extend, and freight costs surge for producers whose logistics depend on passage through the strait.
Oman occupies a fundamentally different position. Its primary oil and gas export terminals are geographically situated outside the strait, meaning that even during periods of heightened conflict risk, Omani crude continues moving to international markets without logistical interruption or premium freight costs.
Both the IMF, in its June 2026 assessment, and S&P Global Ratings have independently highlighted this geographic architecture as a material structural advantage. S&P noted that Oman's energy exports have continued without disruption precisely because they are not transit-dependent on this sensitive waterway. This broader energy superpower strategy of positioning export infrastructure away from geopolitical chokepoints is increasingly recognised as a critical sovereign asset.
The Geopolitical Risk Paradox: Capturing Upside Without Bearing Downside
This creates an unusual asymmetric position for Oman in the current regional environment. Geopolitical tensions in the Middle East contribute to elevated oil price benchmarks through risk premium pricing. Oman benefits from these elevated prices as a seller of crude. Yet because its export infrastructure bypasses the strait, it does not bear the corresponding operational and logistical costs that strait-dependent producers face when tensions rise.
| Producer Category | Strait of Hormuz Dependency | Geopolitical Risk Exposure | H1 2026 Output Trend |
|---|---|---|---|
| Oman | Low (terminals outside strait) | Minimal operational disruption risk | +10.6% YoY |
| Strait-dependent GCC producers | Moderate to High | Elevated insurance and freight costs | Varies by quota allocation |
The May 2026 price spike to US$124.1 per barrel illustrates this asymmetry clearly. Oman captured the revenue benefit of a geopolitically elevated price environment while maintaining uninterrupted export operations. This is not a coincidence; it is the result of decades of infrastructure investment in terminal positioning outside the conflict-sensitive waterway.
The Hydrocarbon-to-GDP Transmission: How Barrels Become Budget Outcomes
Q1 2026 GDP Data as a Leading Indicator
Preliminary NCSI data confirms that Oman's real GDP expanded by 3% year-on-year in the first quarter of 2026. Petroleum activities, which represent approximately one-third of the total economy, grew by 4.6% during the same period. Within that, crude oil activities expanded by 4.3% and natural gas activities recorded stronger growth of 6%, reflecting the parallel contribution of gas sector investment alongside the crude ramp.
The services sector also demonstrated robust expansion in Q1 2026, which is significant because it suggests growth is not entirely hydrocarbon-dependent at the activity level, even if fiscal revenues remain heavily weighted toward oil and gas receipts.
IMF Growth Projections: What the 3.7% Forecast Assumes
The IMF projects Oman's economy to grow by 3.7% in 2026, up from an estimated 2.4% in 2025. This upgraded projection is grounded in several assumptions:
- Continued uninterrupted operation of oil and gas production facilities and export terminals
- Sustained elevated crude prices above the sultanate's fiscal breakeven threshold
- Prudent macroeconomic policy management maintaining debt reduction momentum
- Non-oil sector diversification continuing to contribute meaningfully to GDP
Oman's fiscal breakeven oil price has declined steadily over recent years due to fiscal consolidation. Consequently, with H1 2026 average prices at US$80.9 per barrel, and peak months well above that level, the sultanate is operating with a comfortable revenue buffer above its breakeven threshold.
Three Risk Scenarios for H2 2026 and Beyond
Despite the strong H1 performance, investors and policymakers should be mindful of scenarios that could alter the trajectory. In addition, monitoring oil market disruption risks remains essential as alliance policy and global demand dynamics evolve:
- OPEC+ Quota Tightening: If the alliance reverses its production ceiling increases in H2 2026, Oman would face a hard cap on its ability to sustain current output levels. The July 2026 quota uplift provided near-term support, but future alliance decisions remain the primary production policy risk
- Crude Price Correction: A sustained retreat toward US$65 to US$70 per barrel, driven by demand softening or geopolitical de-escalation compressing the risk premium, would erode the price-driven component of fiscal revenue even if volumes remain elevated
- Infrastructure Disruption: While current risk is assessed as low given terminal positioning, any significant escalation affecting Oman's export facilities would simultaneously compress volumes and spike operational costs, creating a compounded revenue shock
Disclaimer: The scenarios above are forward-looking projections based on currently available data and are subject to material uncertainty. They do not constitute investment advice and should not be relied upon as predictions of future outcomes.
Oman Vision 2040 and the Long-Term Diversification Imperative
Why Sustained Oil Revenue Matters Beyond the Current Cycle
Oman's Vision 2040 strategic framework aims to reduce the economy's structural dependence on hydrocarbon revenues over a multi-decade horizon by building competitive non-oil sectors including tourism, logistics, manufacturing, and renewable energy. The irony is that achieving this diversification requires substantial upfront capital investment, much of which must be funded by the hydrocarbon revenues the strategy ultimately seeks to reduce reliance upon.
A period of simultaneously elevated production volumes and elevated crude prices, as experienced in H1 2026, therefore accelerates the Vision 2040 funding runway. The incremental fiscal revenue generated by outperforming both volume and price assumptions creates budgetary space for diversification programme investment without requiring deficit financing or sovereign debt issuance.
Sovereign Debt Trajectory and Credit Rating Implications
Oman's sovereign credit profile has improved materially over recent years following a period of fiscal stress during the 2015 to 2020 oil price downturn. Both Moody's and S&P have progressively revised their assessments of Omani creditworthiness upward as the government demonstrated fiscal discipline and as hydrocarbon revenues recovered.
Sustained outperformance in oil production and pricing, as documented in the H1 2026 NCSI data, supports continued debt-to-GDP ratio improvement and reduces the probability of needing to access international capital markets on unfavourable terms. This virtuous cycle between hydrocarbon revenue strength and sovereign credit improvement is one of the less frequently discussed transmission mechanisms from barrel to budget outcome. Furthermore, WTI and Brent futures pricing trajectories will remain a key variable influencing Oman's fiscal planning through the remainder of the year.
The next major ASX story will hit our subscribers first
Key Takeaways: What H1 2026 Tells Us About Oman's Energy Economy
The first-half 2026 production and pricing data crystallises several conclusions that extend beyond the immediate statistics:
- Production growth is structural, not purely cyclical: EOR technology maturation, upstream capital deployment cycles, and quota ceiling expansion have created durable output capacity above 1 million bpd that is unlikely to reverse quickly
- The export-production gap signals domestic value capture ambitions: The slower growth in exports relative to total production points toward intentional downstream integration rather than simple volume maximisation
- Geographic infrastructure provides asymmetric risk positioning: Oman captures geopolitical risk premiums in crude pricing without bearing the corresponding logistical costs that strait-dependent producers face
- The IMF's 3.7% growth forecast has a solid evidentiary base: Q1 GDP data, H1 production volumes, and crude price performance all support rather than undermine this projection, though it remains sensitive to price and quota assumptions
- Vision 2040 diversification depends on hydrocarbon funding in the near term: Paradoxically, the strongest argument for prioritising upstream oil investment now is that it finances the transition away from upstream oil dependency over time
Forward indicators to monitor through the remainder of 2026 include OPEC+ meeting outcomes on H2 quota settings, the trajectory of Middle East geopolitical risk premiums embedded in crude benchmarks, and the pace of non-oil GDP contribution growth in Q2 and Q3 NCSI data releases.
Frequently Asked Questions
What drove Oman oil output to rise 10.6% in H1 2026?
A combination of OPEC+ production ceiling increases effective from May 2026, with a further uplift from July 2026, alongside the maturation of long-cycle upstream investment programmes and EOR technology deployment across Oman's producing fields enabled total output to reach 198.01 million barrels, up from 179.05 million barrels in H1 2025.
Why did oil exports grow more slowly than production in H1 2026?
Oil exports rose by 2.4% to 155.22 million barrels against total production growth of 10.6%. The divergence is consistent with increased crude allocation toward domestic refining, petrochemical feedstock requirements, and potentially strategic inventory accumulation, all aligned with Oman's broader economic diversification objectives under Vision 2040.
How does Oman's export infrastructure reduce geopolitical disruption risk?
Oman's primary export terminals are positioned outside the Strait of Hormuz. Unlike producers whose crude must transit through this strategically sensitive waterway, Oman can maintain uninterrupted export flows even during periods of elevated regional conflict risk. The IMF and S&P Global Ratings have both identified this geographic advantage as a material credit-positive factor.
What is the IMF's GDP growth forecast for Oman in 2026?
The IMF projects Oman's real GDP to expand by 3.7% in 2026, up from an estimated 2.4% in 2025, supported by increased oil and gas production, higher crude prices, and continued macroeconomic policy discipline.
What was the peak monthly crude price achieved in H1 2026?
The highest monthly average selling price for Omani crude in H1 2026 was recorded in May at US$124.1 per barrel, reflecting elevated geopolitical risk premiums. June averaged US$104.7 per barrel, with the overall H1 2026 average reaching US$80.9 per barrel.
Want to Capitalise on the Next Major Resource Discovery Before the Broader Market?
Discovery Alert's proprietary Discovery IQ model scans ASX announcements in real time, instantly identifying significant mineral discoveries and transforming complex data into actionable investment insights — the same type of structural advantages that reward early-positioned investors. Explore historic examples of exceptional discovery returns and begin your 14-day free trial today to secure your market-leading edge.