August 25, 2026
Understanding OPEC+ Emergency Production Mechanisms
Global oil markets operate within complex equilibrium systems where supply disruptions can trigger cascading effects across entire economic regions. The recent OPEC+ oil production increase amid Iran conflict exemplifies how geopolitical tensions in energy-producing zones require coordinated responses to maintain price stability and ensure adequate supply flows to consuming nations.
The organisational structure governing these responses centres on consensus-driven frameworks where multiple stakeholders must align their strategic interests. Market participants monitor various indicators including demand patterns, inventory levels, and transportation security assessments when evaluating potential supply adjustments, particularly during periods of regional instability.
OPEC+ Decision-Making Framework Components:
• Spare capacity utilisation analysis – evaluating available production infrastructure
• Regional security threat assessment – monitoring conflict zones and transportation corridors
• Market fundamentals evaluation – analysing supply-demand equilibrium positioning
• Member consensus protocols – coordinating multi-nation agreement procedures
The March 2, 2026 production adjustment exemplifies this framework in action. The V8 group announced a 206,000 barrels per day (bpd) increase, significantly exceeding analyst forecasts of 137,000 bpd by 50.4%. This decision involved eight major producers: Saudi Arabia, Russia, Kuwait, Oman, Iraq, United Arab Emirates, Algeria, and Kazakhstan, with implementation scheduled for April 2026.
According to the official V8 statement, decision rationale focused on steady global economic outlook and current healthy market fundamentals rather than explicitly acknowledging security threats. However, the timing coincided with escalating regional tensions, demonstrating how OPEC production impact extends beyond traditional supply-demand calculations.
Furthermore, energy analysts questioned the adequacy of this measured response. Jorge Leon from Rystad Energy noted that the 206,000 bpd increase would provide minimal market relief if transportation infrastructure faced significant disruption, emphasising that logistics and transit risks supersede production target modifications in crisis scenarios.
When big ASX news breaks, our subscribers know first
Iran Conflict: Regional Security Impact on Energy Markets
Transportation chokepoints represent vulnerability nodes where regional conflicts can dramatically amplify their impact on global commodity flows. The concentration of petroleum shipping through narrow waterways creates structural fragility that extends far beyond immediate conflict zones, affecting pricing mechanisms and supply chain psychology worldwide.
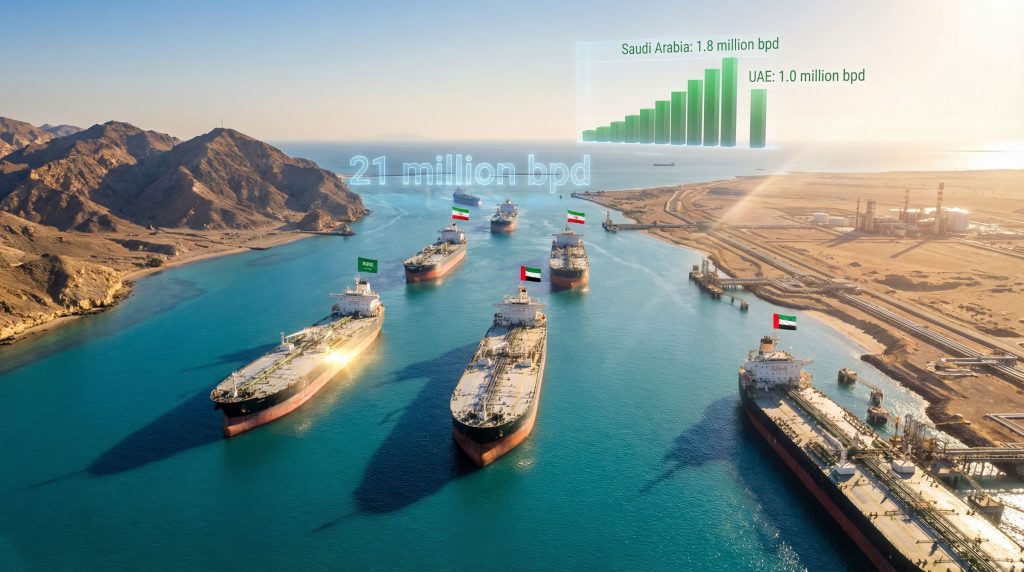
The Strait of Hormuz serves as the most critical example of this vulnerability, handling approximately 21 million barrels per day – nearly 25% of global seaborne oil supplies. During the March 2, 2026 escalation, Iranian Revolutionary Guards announced strait closure whilst Iranian state television broadcast footage of a burning oil tanker allegedly struck whilst attempting passage through the waterway.
Strategic Chokepoint Vulnerability Analysis:
| Waterway | Daily Oil Flow | Global Share | Alternative Capacity |
|---|---|---|---|
| Strait of Hormuz | 21 million bpd | 25% | Limited pipeline options |
| Suez Canal | 5.5 million bpd | 6.6% | Cape of Good Hope routing |
| Bab el-Mandeb | 6.2 million bpd | 7.4% | Pipeline alternatives exist |
The psychological impact on commercial shipping operations extends beyond direct military threats. Stephen Innes from SPI Asset Management identified multiple cascading risk factors that modify shipping behaviour even without complete route closure. Consequently, trade war oil impact becomes amplified during regional conflicts.
• Insurance contract cancellations for vessels transiting contested waters
• Electronic signalling jamming disrupting navigation systems in Gulf regions
• Risk perception amplification causing shippers to act as if routes are compromised
• Commercial decision modification based on threat anticipation rather than actual closures
Price prediction models during the March 2-3, 2026 scenario suggested dramatic escalation potential. Market analysis indicated oil prices could surge from approximately $72 per barrel to a range of $120-$150 per barrel – representing a 67-108% increase – if Strait closure scenarios materialised when trading resumed.
The immediate targeting of multiple OPEC+ member states during Iranian strikes on March 2, 2026 demonstrated the concentrated geographic risk facing major petroleum producers. Saudi Arabia, UAE, Kuwait, Oman, and Iraq – all V8 group members – faced direct military action for consecutive days, highlighting the clustering of production capacity within conflict-prone regions.
This geographic concentration creates amplified vulnerability where single conflict events can simultaneously threaten multiple production sources and primary transportation infrastructure, potentially triggering supply shortfalls that exceed available mitigation mechanisms.
Production Capacity Reallocation During Crisis Periods
Emergency production capacity represents the petroleum industry's primary shock absorption mechanism when supply disruptions threaten market stability. However, the distribution and technical limitations of this spare capacity create strategic dependencies that may prove inadequate during extended crisis periods.
Current spare capacity analysis reveals significant concentration among a limited number of producers. Saudi Arabia maintains 1.8 million bpd of available emergency capacity, representing 51.4% of total identified spare capacity across major OPEC+ members. The United Arab Emirates contributes 1.0 million bpd, whilst Kuwait and Iraq provide 0.4 million and 0.3 million bpd respectively.
Spare Capacity Distribution and Strategic Dependencies:
| Producer | Spare Capacity | Percentage of Total | Activation Timeline |
|---|---|---|---|
| Saudi Arabia | 1.8 million bpd | 51.4% | 30-45 days |
| UAE | 1.0 million bpd | 28.6% | 30-45 days |
| Kuwait | 0.4 million bpd | 11.4% | 30-45 days |
| Iraq | 0.3 million bpd | 8.6% | 30-45 days |
This concentration creates strategic vulnerability where two nations control nearly 80% of available emergency capacity. During the March 2026 crisis, both Saudi Arabia and UAE faced direct Iranian military strikes, potentially compromising the alliance's primary crisis response capabilities simultaneously. In addition, crude oil trends suggest these capacity constraints will persist throughout 2026.
Rystad Energy analysis confirmed these capacity constraints, noting that Saudi Arabia, UAE, Kuwait, and Iraq represent the only OPEC+ members capable of meaningful production increases. Russian capacity assessment indicated production had been declining since November 2025, suggesting the nation was operating near maximum output levels.
Technical Activation Requirements:
Spare capacity deployment involves multiple operational stages that extend beyond simple production decisions:
• Infrastructure readiness verification – ensuring idle facilities can resume operations
• Feedstock availability confirmation – securing adequate crude oil inputs
• Export logistics coordination – aligning shipping and pipeline capacity
• Quality specification matching – meeting buyer contract requirements
The April 2026 implementation timeline for the 206,000 bpd increase suggests approximately 30-45 days required for physical production ramp-up from reduced-capacity operations. This timeline limitation means emergency responses cannot immediately offset acute supply disruptions, creating temporary market vulnerability windows.
The March 2026 decision utilised only 5.9% of total identified spare capacity, indicating conservative deployment despite active regional conflict. This measured approach reflects the strategic value of maintaining reserve capacity for potentially more severe disruption scenarios, whilst also acknowledging the technical and logistical constraints limiting rapid capacity activation.
Market Psychology and Price Volatility Patterns
Petroleum markets exhibit amplified psychological responses to geopolitical events, often generating price movements that exceed the mathematical relationship between actual supply disruption and market fundamentals. This volatility stems from the intersection of physical commodity constraints, financial market speculation, and behavioural decision-making under uncertainty.
The March 2-3, 2026 scenario provides a concrete example of this psychological amplification. Market analysis predicted oil prices could escalate from $72 per barrel to $120-$150 per barrel based on Strait of Hormuz closure scenarios – a premium increase of $48-78 per barrel representing pure risk perception rather than actual supply shortfall.
Risk Premium Decomposition Analysis:
Market Psychology Formula Application:
Base price ($72) + Geopolitical risk factor ($25-40) + Supply disruption probability ($23-38) = Predicted trading range ($120-150)
This premium structure reveals how threat perception drives pricing mechanisms independent of physical supply availability. Jorge Leon emphasised this disconnect, noting that market prices respond to Gulf developments and shipping flow status rather than production target adjustments, even when those adjustments exceed analyst expectations by 50%.
Behavioural Cascading Effects:
• Availability heuristic activation – recent Iranian attacks increase mental accessibility of worst-case scenarios
• Insurance cost transmission – vessel premium spikes flow directly into shipping expense calculations
• Precautionary purchasing acceleration – refineries and strategic reserves advance buying schedules
• Algorithmic trading amplification – computerised systems price in disruption probabilities automatically
Commercial shipping behaviour modification provides evidence of psychological market impacts preceding physical disruption. During March 2026, shipping operators began acting as if transportation routes were compromised despite technical operability, driven by insurance availability concerns and electronic interference rather than complete closure.
Strategic Price Band Considerations:
OPEC+ pricing strategy involves balancing immediate revenue maximisation against long-term competitive positioning. Kpler analyst Homayoun Falakshahi identified that whilst the cartel might prefer prices of $80-90 per barrel, approximately $70 per barrel represents the ideal price level for cutting investment incentives among rival non-OPEC+ producers.
This $70 threshold calculation reflects organisational awareness that excessive pricing triggers competitive supply expansion from producers in the United States, Canada, and Brazil, potentially eroding market share over multi-year timeframes. The predicted $120-150 scenario, whilst generating substantial short-term revenue increases, carries significant long-term strategic risks through accelerated alternative supply development.
Volatility Timeline Patterns:
| Duration | Price Impact | Market Drivers | Recovery Factors |
|---|---|---|---|
| 1-3 days | 15-30% increase | Initial threat response | Technical analysis correction |
| 1-2 weeks | 40-70% increase | Supply chain adaptation | Alternative route activation |
| 1-3 months | 80-120% increase | Strategic reserve depletion | Demand destruction onset |
Alternative Transportation Infrastructure Assessment
Pipeline networks serve as critical backup systems when maritime transportation faces security disruption, yet their capacity limitations and geographic constraints create structural bottlenecks during extended crisis periods. Understanding these alternative infrastructure capabilities becomes essential for evaluating market resilience during prolonged conflict scenarios.
Regional pipeline capacity assessment reveals significant shortfall potential relative to seaborne transportation volumes. The East-West Pipeline system in Saudi Arabia provides 5.0 million bpd capacity, whilst the Abu Dhabi Crude Oil Pipeline contributes 1.8 million bpd, and the Iraq-Turkey Pipeline adds 0.6 million bpd. Combined, these systems total 7.4 million bpd alternative capacity.
Pipeline Substitution Analysis:
Comparing alternative pipeline capacity against Strait of Hormuz throughput reveals structural inadequacy for complete maritime replacement. The strait handles 21 million bpd, whilst combined pipeline alternatives provide 7.4 million bpd – representing only 35.2% substitution capability. This creates a potential 13.6 million bpd shortfall or 64.8% of normal strait flows.
| Infrastructure Type | Capacity | Utilisation Rate | Expansion Potential |
|---|---|---|---|
| Saudi East-West Pipeline | 5.0 million bpd | 80-90% current | Limited near-term |
| UAE Abu Dhabi Pipeline | 1.8 million bpd | 70-85% current | Moderate expansion |
| Iraq-Turkey Pipeline | 0.6 million bpd | Variable | Maintenance dependent |
Stephen Innes characterised these pipeline systems as meaningful pressure valves but emphasised they cannot serve as complete replacement for seaborne flow volumes. The mathematical reality of this capacity gap explains why the 206,000 bpd OPEC+ oil production increase amid Iran conflict appears insufficient relative to potential disruption scenarios – even maximum alternative transportation utilisation would leave substantial market shortfalls.
According to CNN's analysis, the infrastructure constraints highlight the vulnerability of global energy supplies when primary transportation routes face extended disruption.
Technical Infrastructure Constraints:
Pipeline systems face operational limitations that restrict their effectiveness as maritime alternatives:
• Diameter specifications limiting maximum throughput regardless of pressure increases
• Maintenance scheduling requirements reducing available capacity during service periods
• Quality segregation needs requiring separate pipeline usage for different crude oil grades
• Terminal capacity bottlenecks at pipeline endpoints constraining actual delivery volumes
The geographic positioning of existing pipeline infrastructure also creates vulnerability concentration. Saudi Arabia's East-West Pipeline, representing 67.6% of total alternative capacity, terminates at Red Sea ports that could face secondary targeting during extended regional conflicts, potentially compromising backup transportation simultaneously with primary strait disruption.
Economic Efficiency Comparison:
Maritime transportation provides significant cost advantages over pipeline alternatives, creating economic pressure for route normalisation even during security concerns. Shipping costs through the Strait of Hormuz typically range $2-4 per barrel, whilst pipeline transportation costs $4-8 per barrel depending on distance and capacity utilisation rates.
This cost differential means prolonged pipeline reliance reduces profitability margins for petroleum producers, creating economic incentives for conflict resolution and shipping route restoration beyond pure supply security considerations.
How Do Oil Markets Respond to Extended Regional Conflicts?
Extended regional conflicts test petroleum supply chain resilience beyond immediate production and transportation capacity, revealing cascading vulnerabilities that compound over time. Understanding these temporal dynamics becomes critical for assessing whether alternative infrastructure can sustain global energy flows during prolonged disruption periods.
Duration analysis reveals escalating consequences as conflicts extend beyond initial crisis response capabilities. Short-term disruptions (1-7 days) typically generate 2-3 million bpd supply shortfalls with 15-25% price increases, remaining within manageable ranges through strategic reserve deployment and shipping route modifications.
Extended Disruption Timeline Analysis:
| Timeframe | Supply Impact | Price Multiplier | Economic Consequences | System Stress |
|---|---|---|---|---|
| 1-7 days | 2-3 million bpd | 1.15-1.25x | Minimal recession risk | Low |
| 2-4 weeks | 5-8 million bpd | 1.40-1.60x | Regional economic strain | Moderate |
| 1-3 months | 8-12 million bpd | 1.80-2.20x | Global recession threat | Severe |
| 3+ months | 12+ million bpd | 2.50x+ | Economic system failure | Critical |
Cascading Infrastructure Stress:
Extended conflicts create cumulative pressure on backup systems that may not be apparent during short-term analysis. Pipeline networks operating at maximum capacity face accelerated maintenance requirements, whilst alternative shipping routes through longer distances increase vessel utilisation rates and port congestion. However, oil price adjustments during such periods require careful market intervention.
• Pipeline throughput degradation from sustained maximum capacity operation
• Shipping fleet availability reduction due to longer route distances and increased transit times
• Port terminal bottlenecks at alternative destinations lacking adequate throughput capacity
• Refinery feedstock mismatches when alternative crude oils require processing modifications
The Saudi East-West Pipeline, providing 5.0 million bpd capacity, exemplifies these constraints. Whilst designed for sustained operation, maximum utilisation rates during extended disruptions could strain infrastructure beyond normal maintenance schedules, potentially reducing effective capacity over time rather than maintaining consistent alternative throughput.
Strategic Reserve Depletion Timelines:
National strategic petroleum reserves provide temporary supply buffers, but their finite capacity creates defined timeline constraints for extended disruption management. The United States Strategic Petroleum Reserve contains approximately 390 million barrels, whilst International Energy Agency member countries maintain combined reserves exceeding 1.5 billion barrels.
At maximum release rates of 1-4 million bpd, strategic reserves could sustain partial supply replacement for 3-18 months depending on disruption severity. However, reserve depletion creates subsequent vulnerability where nations face reduced strategic flexibility for future crises.
Economic Adaptation Mechanisms:
Extended high-price environments trigger demand-side adaptations that can provide supply chain relief but may create permanent structural changes in consumption patterns:
• Industrial process modification to reduce petroleum consumption per unit output
• Transportation behaviour changes including increased public transit utilisation and reduced discretionary travel
• Energy substitution acceleration toward electricity, natural gas, and renewable alternatives where technically feasible
These adaptations typically require 6-12 months to fully materialise, creating a critical window where supply chain resilience must bridge the gap between initial disruption and demand-side relief mechanisms.
The next major ASX story will hit our subscribers first
What Are the Long-term Investment Implications?
Prolonged Middle East instability creates fundamental shifts in energy investment priorities, requiring portfolio strategies that account for both immediate volatility opportunities and structural changes in global energy security frameworks. Traditional risk-return calculations must incorporate geopolitical persistence scenarios that may extend across multiple years rather than temporary crisis periods.
Geographic Diversification Imperatives:
The concentration of spare capacity in conflict-prone regions demonstrates the strategic value of diversified petroleum production investments. Portfolio construction must consider not only resource quality and extraction costs but also jurisdictional stability and transportation security for sustained operations.
• North American unconventional resources offering production flexibility and political stability
• Norwegian offshore capabilities providing European supply security with minimal geopolitical risk
• Brazilian deepwater projects delivering large-scale capacity outside traditional conflict zones
• Guyana and Suriname exploration representing emerging stable production regions
Infrastructure Investment Priorities:
Transportation infrastructure resilience becomes a critical investment theme during extended geopolitical uncertainty. Pipeline systems, whilst limited in capacity compared to maritime alternatives, provide strategic value through route diversification and reduced exposure to maritime chokepoint vulnerabilities.
Strategic Infrastructure Investment Categories:
| Infrastructure Type | Investment Timeline | Risk-Return Profile | Strategic Value |
|---|---|---|---|
| Pipeline expansion | 3-7 years | Moderate risk, stable returns | High diversification value |
| Storage capacity | 1-3 years | Low risk, moderate returns | Crisis response capability |
| Alternative energy | 2-10 years | Variable risk, high growth | Long-term transition hedge |
| Shipping alternatives | 2-5 years | High risk, high returns | Chokepoint mitigation |
Volatility Trading Strategies:
Geopolitical petroleum markets create distinct trading opportunities through volatility premiums and price dislocations. However, these strategies require sophisticated risk management due to the potential for rapid, extreme price movements that can exceed historical precedents. Moreover, oil price rally scenarios require careful timing and position management.
Professional energy traders focus on volatility arbitrage opportunities where implied volatility in options markets diverges from realised price movement patterns. During the March 2026 scenario, predicted price ranges of $120-150 per barrel from a $72 baseline suggest volatility premiums exceeding 100% annual basis.
Portfolio Risk Management Frameworks:
• Position sizing limitations to prevent catastrophic losses from extreme price movements
• Hedging strategies using derivatives to limit downside exposure whilst maintaining upside participation
• Sector rotation timing between petroleum producers, alternative energy, and traditional defensive sectors
• Currency hedging considerations as energy volatility often correlates with currency market disruption
Long-term Structural Investment Themes:
Extended Middle East instability accelerates structural transitions in global energy systems that create multi-decade investment opportunities. These themes extend beyond immediate crisis response to encompass fundamental shifts in energy security priorities among major consuming nations.
Energy Security Investment Drivers:
• Strategic reserve expansion programmes among major consuming nations
• Regional energy independence initiatives reducing dependence on volatile supply regions
• Alternative energy acceleration driven by security considerations rather than purely economic factors
• Critical mineral diversification for energy transition technologies away from geopolitically sensitive sources
The convergence of geopolitical risk and energy transition creates investment opportunities where security premiums justify higher capital expenditure for diversified supply sources, even when pure economic returns might favour traditional concentrated production regions.
Long-term Structural Changes in Global Energy Architecture
Persistent geopolitical instability in Middle Eastern energy corridors catalyses fundamental reorganisation of global energy procurement and distribution systems. These structural adaptations extend beyond temporary crisis responses to encompass permanent shifts in international energy relationships that may define decades of future market dynamics.
Regional Energy Bloc Formation:
Geographic proximity and political alignment increasingly drive energy partnership development as nations prioritise supply security over cost optimisation. This trend accelerates during extended conflict periods when traditional supply chains face recurring disruption threats.
European nations demonstrate this transition through accelerated diversification away from traditional Middle Eastern suppliers toward Norwegian offshore production, North African pipeline connections, and North American liquefied natural gas imports. Similarly, Asia-Pacific regions where Australia and Indonesia expand supply relationships with regional consumers show comparable patterns.
Strategic Reserve Architecture Evolution:
National strategic petroleum reserve systems undergo expansion and modernisation to address longer disruption scenarios. Traditional reserve concepts designed for 90-day supply buffers prove inadequate when conflicts extend across multiple months or years. Furthermore, Axios reports indicate this architectural evolution has become a priority across developed economies.
Next-Generation Reserve Framework:
| Reserve Type | Capacity Target | Release Capability | Strategic Purpose |
|---|---|---|---|
| Emergency stocks | 180-day supply | 4-6 million bpd | Immediate crisis response |
| Strategic buffers | 12-month supply | 2-3 million bpd | Extended disruption management |
| Commercial incentives | Variable | Market-driven | Private sector coordination |
| Regional coordination | Multinational pools | Coordinated releases | Allied supply sharing |
Transportation Infrastructure Redundancy:
Recognition of chokepoint vulnerabilities drives investment in alternative transportation networks that provide route diversification independent of traditional maritime corridors. These projects require substantial capital investment and multi-year development timelines but offer strategic security value during crisis periods.
Pipeline development projects gain renewed priority despite higher transportation costs compared to maritime alternatives. The economic premium for pipeline transportation ($4-8 per barrel vs. $2-4 for shipping) becomes acceptable when security considerations dominate pure cost optimisation.
Energy Transition Acceleration Factors:
Geopolitical instability serves as a catalyst for renewable energy adoption that operates independently of climate change motivations. Energy security concerns drive investment in domestic renewable capacity even in regions where fossil fuel resources remain abundant and economically competitive.
• Grid-scale storage deployment to manage renewable energy intermittency challenges
• Distributed generation systems reducing dependence on centralised energy infrastructure
• Electrification programmes for transportation and industrial processes to reduce petroleum dependence
• Green hydrogen development for industrial applications requiring high-energy density fuels
International Energy Governance Evolution:
Traditional energy governance structures face pressure to adapt as geopolitical risks reshape market dynamics. Organisations like the International Energy Agency expand their crisis response capabilities whilst new regional energy security alliances emerge to address specific geographic vulnerability patterns.
The OPEC+ oil production increase amid Iran conflict, with its 206,000 bpd increase falling short of analyst recommendations for addressing potential 21 million bpd Strait disruption, highlights the limitations of existing coordination mechanisms during severe crisis scenarios.
Financial Market Infrastructure Adaptation:
Energy commodity trading systems require enhancement to handle extreme volatility scenarios and extended market disruptions. Traditional price discovery mechanisms face stress when physical supply chains disconnect from financial trading systems during crisis periods.
Market Infrastructure Evolution Requirements:
• Circuit breakers and volatility controls to prevent extreme price movements from destabilising broader financial systems
• Physical delivery alternatives when traditional transportation routes face disruption
• Regional pricing mechanisms reflecting local supply-demand balances during global supply chain fragmentation
• Insurance and risk management products designed for extended geopolitical disruption scenarios
The intersection of geopolitical instability and energy market dynamics reveals the complex interdependencies that shape global economic stability. Whilst short-term production adjustments and alternative transportation systems provide immediate crisis response capabilities, the fundamental restructuring of global energy architecture may represent the most significant long-term consequence of extended Middle Eastern conflicts.
Understanding these structural transitions becomes essential for stakeholders navigating an energy landscape where security considerations increasingly compete with traditional economic optimisation in determining investment priorities, supply chain design, and international cooperation frameworks. The OPEC+ oil production increase amid Iran conflict represents just one element within this broader transformation of global energy systems.
Disclaimer: This analysis is based on publicly available information and market commentary as of March 2026. Energy markets involve significant volatility and geopolitical risks that can result in substantial financial losses. Readers should conduct their own research and consult with qualified financial advisors before making investment decisions. Predictions and scenarios discussed are speculative and may not reflect actual market outcomes.
Ready to Navigate Energy Market Volatility?
The complex interplay between geopolitical events and energy markets creates opportunities for informed investors who can quickly identify market-moving developments. Discovery Alert's proprietary Discovery IQ model delivers real-time alerts on significant ASX mineral discoveries, helping subscribers stay ahead of market volatility and position themselves for actionable opportunities. Begin your 14-day free trial today to gain instant access to market-leading intelligence that transforms complex commodity data into clear investment insights.