
May 22, 2026
The Structural Paradox at the Heart of OPEC+'s 2026 Supply Strategy
Global oil markets have always operated under a fundamental tension: the nations most capable of swinging supply are often the same ones most exposed to the geopolitical shocks that disrupt it. In 2026, that tension has never been sharper. As conflict reshapes the physical landscape of Middle Eastern energy infrastructure, the OPEC+ July oil output increase represents one of the alliance's most aggressive supply restoration programmes in recent memory.
Understanding why that is happening, and what it means for markets, requires looking past the headline barrel figures and into the mechanics of OPEC+ decision-making, spare capacity geography, and the long-run strategic calculus that now governs production policy within the group. Furthermore, OPEC's market influence on price dynamics cannot be assessed in isolation from the geopolitical backdrop shaping every barrel that reaches market.
When big ASX news breaks, our subscribers know first
What the OPEC+ July Oil Output Increase Actually Represents
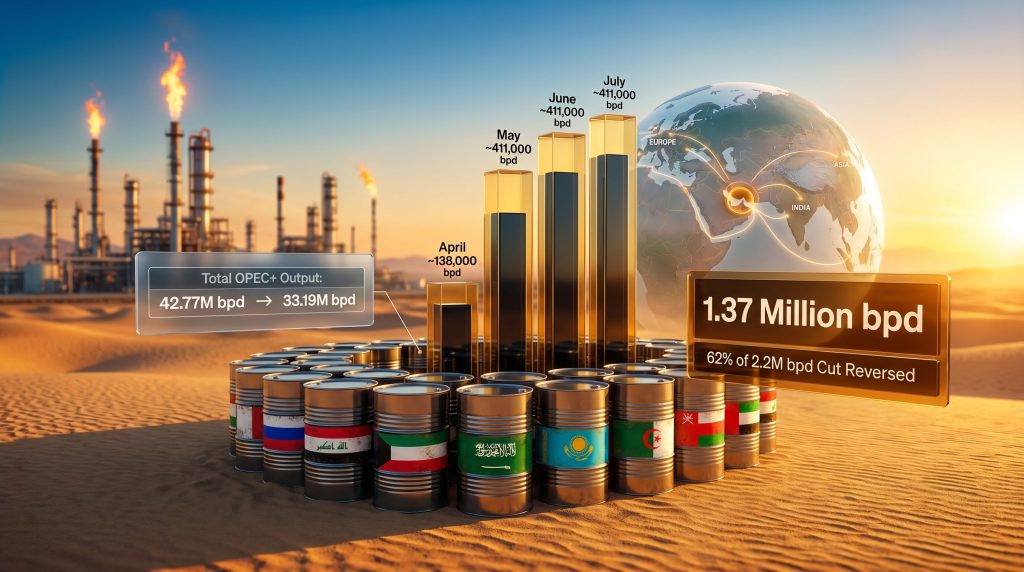
The OPEC+ July oil output increase of approximately 411,000 barrels per day is not an isolated policy move. It is the fourth consecutive monthly hike in a sequence that began in April 2026, and it brings the group's cumulative supply additions for the April-to-July period to roughly 1.37 million barrels per day.
To put that in context, the group's most recent coordinated restraint arrangement involved cutting 2.2 million bpd from collective output. By July, approximately 62% of that cut has been reversed across just four months, representing a pace of unwind that is considerably faster than the graduated approach many market participants had expected at the start of the year.
The monthly progression tells its own story:
| Month | Output Increase (bpd) | Cumulative Increase (bpd) | % of 2.2M Cut Unwound |
|---|---|---|---|
| April 2026 | ~138,000 | ~138,000 | ~6% |
| May 2026 | ~411,000 | ~549,000 | ~25% |
| June 2026 | ~411,000 | ~960,000 | ~44% |
| July 2026 | ~411,000 | ~1,370,000 | ~62% |
The shift in hike magnitude between April and May reflects both a recalibration of the group's ambition and, importantly, a compositional change following the UAE's departure from the broader OPEC+ arrangement. While the UAE's exit reduced the raw headline figure for monthly additions, the remaining seven core members have maintained the 411,000 bpd pace through May, June, and July.
The Eight Core Members and the Mechanics of the July Decision
The July production increase is driven by eight participating nations: Saudi Arabia, Russia, Iraq, Kuwait, Kazakhstan, Algeria, Oman, and the UAE, the latter having re-engaged in the core group's output decisions despite its broader departure from the wider coalition arrangement. These eight represent the operational centre of gravity for OPEC+ supply management.
Within this group, the contribution of individual members is not uniform. Spare capacity — the ability to physically raise output above current production levels within 30 to 90 days without compromising reservoir integrity — is unevenly distributed. Saudi Arabia holds the largest buffer, followed by Iraq and Kuwait. This concentration of deliverable capacity matters enormously because it determines which countries can actually translate a target increase into real barrels reaching the market. OPEC production decisions are consequently shaped as much by physical constraints as by political consensus.
The UAE's Position: Departure and Re-engagement
The UAE's trajectory within OPEC+ has introduced a layer of strategic complexity that is easy to underestimate. Its departure from the broader coalition arrangement removed one of the group's more friction-prone quota negotiations, since the UAE had repeatedly sought a higher baseline from which its voluntary cuts were calculated. In that sense, its exit may have improved internal coherence among the remaining members, even as it technically reduced the group's collective market influence.
The separate, group-wide production cut of 2 million bpd agreed in 2022 technically remains in place through end-2026. That arrangement had included a 160,000 bpd allocation attributed to the UAE, meaning its departure creates an accounting ambiguity that will need to be resolved as the unwind timeline extends into the second half of the year.
The Iran War, Hormuz Risk, and the Delivery Gap
Perhaps the most structurally significant dimension of OPEC+'s current supply strategy is the growing divergence between what the group targets on paper and what it can physically deliver to international buyers. This gap is not a matter of political will or quota discipline. It is a direct consequence of conflict-related disruption to Gulf export infrastructure.
Total OPEC+ output fell from 42.77 million bpd in February 2026 to 33.19 million bpd by April, according to OPEC's own figures. That represents a contraction of approximately 9.58 million bpd, with Gulf producers accounting for roughly 9.9 million bpd of that decline.
| Metric | February 2026 | April 2026 | Change |
|---|---|---|---|
| Total OPEC+ Output | 42.77M bpd | 33.19M bpd | -9.58M bpd |
| Gulf Producer Output Decline | – | – | ~9.9M bpd |
The critical insight here is that the producers carrying the greatest spare capacity — those theoretically most able to compensate for disruption elsewhere — are precisely the ones whose export routes are most exposed to the Strait of Hormuz. Approximately 20% of global oil trade passes through the Strait annually. Saudi Arabia, Iraq, and Kuwait all rely heavily on Gulf terminals for export, meaning their ability to ramp production is geographically and logistically constrained by the same conflict that is already suppressing output.
This creates a structural paradox: OPEC+'s paper-level supply restoration programme is accelerating at the same time that the physical infrastructure required to deliver those barrels faces its most severe operational stress in decades.
Why Target-Setting Still Matters During Conflict Periods
Even when actual delivery falls short of stated targets, production decisions serve important signalling functions. They communicate the group's medium-term supply intentions to futures markets, influence refinery procurement planning horizons, and affect the trajectory of oil price forward curves. A target increase that cannot immediately be delivered still shapes the price discovery process, which is part of why market reactions to the July announcement have been relatively contained. The broader context of oil price geopolitics further explains why these signals carry such weight beyond the immediate supply figures.
The Strategic Logic Behind Accelerated Supply Restoration
OPEC+ has described current market conditions as broadly supportive, citing stable global economic growth and consistent demand signals as the basis for its expansion decisions. However, the internal logic of the acceleration runs deeper than near-term demand optimism.
Several dynamics are driving the group's shift from restraint to expansion:
- Market share erosion risk: Extended production cuts have historically benefited non-OPEC producers, particularly U.S. shale operators who can ramp activity quickly in a higher-price environment. Allowing prices to remain elevated for too long risks ceding permanent volume share to competing supply sources.
- Fiscal pressure among member states: Several OPEC+ members, including some Gulf producers, have domestic budget requirements that benefit from higher volume even at moderately lower prices. The revenue-maximising calculus shifts over time.
- Cohesion management: Maintaining quota discipline over an extended period creates internal friction. Accelerating the unwind reduces the duration of that compliance pressure.
- Forward-guidance credibility: The group's stated intention to gradually restore supply, originally framed as a measured process, would lose credibility if the pace were reversed without clear demand deterioration.
Market Pricing, Trader Positioning, and the Absorption Question
One of the more revealing aspects of the current OPEC+ supply cycle is how calmly oil futures markets have absorbed the cumulative addition of over 1.3 million bpd across four months. The muted price response reflects a dynamic well understood in commodity markets: when supply increases are anticipated and pre-communicated, they tend to be priced in through forward curves before physical delivery begins.
Traders operating in oil futures had been positioning for a continued unwind well before the July decision was formalised. The consistency of the 411,000 bpd monthly pace across May, June, and July removed much of the surprise element from each successive announcement. This is not the same as saying markets are indifferent to the supply additions. Rather, it suggests that the current pace of restoration is within the range that existing demand absorption capacity can accommodate without triggering sharp price dislocations.
Inventory levels and refinery run rates across major consuming regions are the key variables determining how long that absorption capacity holds. Any deterioration in demand, particularly from large oil-importing economies, would shift the calculus quickly. Consequently, oil price pressures from trade tensions remain a critical watch point throughout the remainder of 2026.
The next major ASX story will hit our subscribers first
What Happens After July: The August and September Trajectory
Forward indicators suggest the expansion programme is far from complete. Market intelligence points to a further 411,000 bpd increase being considered for August 2026, which would extend the cumulative unwind to approximately 1.78 million bpd, or roughly 81% of the 2.2 million bpd cut.
A larger hike of around 547,000 bpd has been flagged for September, which, if confirmed, would push the cumulative restoration well past the full 2.2 million bpd threshold within Q3 2026.
| Scenario | Timeline | Cumulative Unwind | Remaining Cut |
|---|---|---|---|
| Conservative (~188K bpd/month) | Q4 2026 | ~1.7M bpd | ~500K bpd |
| Base Case (~411K bpd/month) | Q3 2026 | ~2.2M bpd | 0 |
| Accelerated (~547K bpd/month) | Mid-Q3 2026 | Full unwind | 0 |
It is important to distinguish this unwind from the separate 2022 group-wide 2 million bpd cut, which technically remains in place through end-2026. That broader curtailment has a different legal and structural architecture within the OPEC+ framework, and its scheduled expiry at year-end will represent another significant policy inflection point for markets to navigate.
India and the Emerging Market Exposure Problem
Few economies illustrate the downstream consequences of OPEC+ supply volatility as clearly as India. As one of the world's largest and fastest-growing oil importers, India's energy budget is acutely sensitive to both volume availability and pricing fluctuations from Gulf producers.
The current environment creates a dual challenge. On one hand, accelerated OPEC+ supply additions could support softer oil prices, providing some fiscal relief to India's import bill. On the other, war-related disruptions to Gulf export infrastructure mean that the physical availability of crude from India's primary supply region remains uncertain, regardless of what production targets indicate.
Refinery operators in India and across emerging Asia face a particularly difficult planning environment. Procurement decisions typically operate on 30 to 90-day lead times, and when the gap between OPEC+ stated targets and actual deliverable supply is wide, those procurement models become structurally unreliable.
Strategic and Investment Implications for the Second Half of 2026
For energy-focused investors and policy analysts, the current OPEC+ configuration raises several questions that extend beyond simple supply-demand arithmetic:
- Does the accelerated unwind signal a permanent shift in OPEC+'s tolerance for price discipline, or is it a temporary response to internal cohesion pressures?
- How will the geopolitical risk premium embedded in medium-term oil contracts evolve as the conflict picture in the Gulf clarifies or intensifies?
- Does the prospect of sustained, higher OPEC+ supply volumes reduce the urgency for energy transition investment among energy-importing governments?
On the last point, history suggests that oil price softness tends to dampen near-term political momentum for energy transition spending, even when medium-term transition commitments remain nominally intact. For institutional investors with exposure to both fossil fuel and clean energy assets, the second half of 2026 will test the resilience of long-term transition thesis against short-term commodity cycle pressures.
Disclaimer: This article is intended for informational purposes only and does not constitute financial or investment advice. All production figures, forward projections, and scenario analyses are based on available reporting and should be treated as estimates subject to revision. Readers should conduct independent research before making any investment decisions.
Frequently Asked Questions: OPEC+ July Oil Output Increase
What is the size of the OPEC+ July 2026 oil output increase?
The eight core OPEC+ members agreed to raise collective production by approximately 411,000 barrels per day for July 2026, maintaining the same accelerated pace applied in May and June.
Why is OPEC+ increasing output despite the Iran war disruption?
The group has cited stable global economic conditions and broadly supportive market fundamentals. Core members also appear to be prioritising long-term market share recovery over short-term price maximisation, while managing internal quota cohesion.
How much of OPEC+'s previous production cuts have been reversed?
By July 2026, the cumulative additions from April through July represent approximately 1.37 million bpd, roughly 62% of the group's most recent 2.2 million bpd cut.
Which countries are part of the July output decision?
The eight participating nations are Saudi Arabia, Russia, Iraq, Kuwait, Kazakhstan, Algeria, Oman, and the UAE.
Will OPEC+ continue increasing output beyond July 2026?
Available market intelligence suggests a further 411,000 bpd increase is being considered for August, with a larger 547,000 bpd hike indicated for September, pointing toward a near-complete unwind of the recent cuts by late Q3 2026.
What happened to OPEC+ total production between February and April 2026?
Total group output fell from 42.77 million bpd in February to 33.19 million bpd in April, a decline of approximately 9.58 million bpd, largely attributable to war-related disruptions affecting Gulf exporters.
Want to Stay Ahead of the Market Movements Shaping Resource Investment in 2026?
Discovery Alert's proprietary Discovery IQ model delivers real-time alerts on significant ASX mineral discoveries, translating complex commodity data into actionable investment insights for both short-term traders and long-term investors — explore Discovery Alert's discoveries page to understand how historic mineral discoveries have generated substantial returns, and begin your 14-day free trial today to secure a market-leading advantage.