June 11, 2026
The Geopolitics of Scarcity: How a Naval Blockade Sent OPEC Oil Output to a Generational Low
Global oil markets have historically been shaped by two competing forces: the coordinated production decisions of major exporting nations and the unpredictable intrusions of geopolitical conflict. When these two forces collide, the results tend to be severe and rapid. The events of mid-2026 have delivered precisely this combination, producing an outcome that benchmark-watchers and energy economists had not modelled as a base case: OPEC oil output at its lowest level since at least 2000, a decline so sharp it has eclipsed even the demand destruction of the COVID-19 pandemic in terms of raw production volume.
Understanding why this happened, what it means for global energy markets, and how different economies are positioned to absorb the shock requires examining not just the headline figures, but the structural mechanics underneath them. Furthermore, appreciating OPEC's global market influence is essential context for grasping the full scale of this disruption.
When big ASX news breaks, our subscribers know first
How Low Has OPEC Production Actually Fallen?
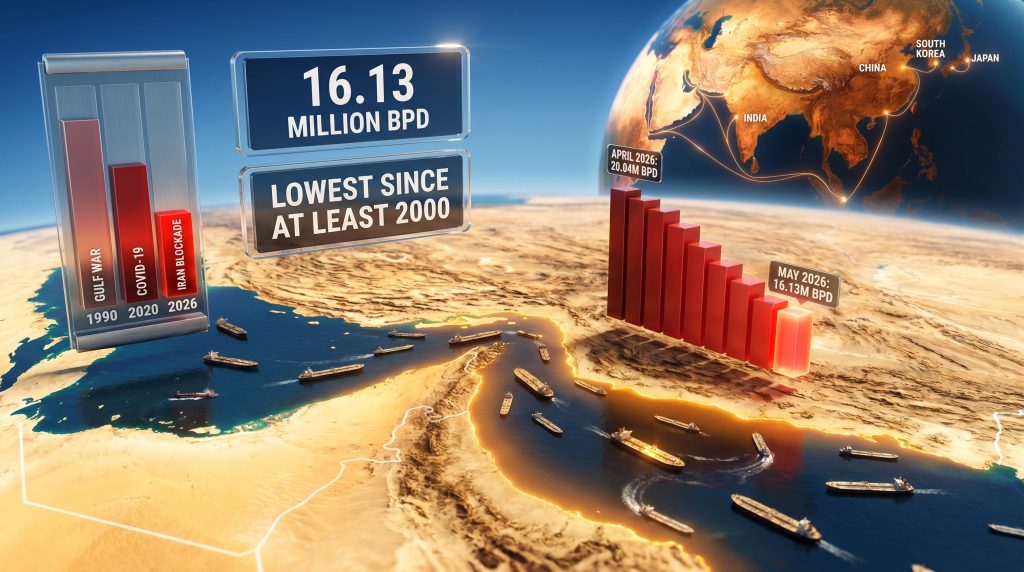
A Reuters survey published in June 2026 confirmed that OPEC's 11-member output fell by 1.06 million barrels per day on a month-on-month basis, landing at 16.13 million bpd for May 2026. That figure represents the lowest monthly reading in Reuters survey records stretching back to at least the year 2000, placing current output below even the lows recorded during the COVID-19 demand collapse of 2020.
The numbers vary depending on the tracking methodology and membership definitions applied, but all major reporting bodies agree on the directional severity:
| Data Source | Reported Output Level | Period | Historical Context |
|---|---|---|---|
| Reuters Survey | 16.13 million bpd | May 2026 | Lowest since at least 2000 |
| Reuters Survey | 17.19 million bpd (implied April) | April 2026 | Sharp prior-month base |
| Bloomberg | 20.55 million bpd | April 2026 | Lowest since 1990 |
| MEES | 17.04 million bpd | April 2026 | Lowest since August 1990 |
Why the Figures Differ Across Reporting Bodies
The variance between these estimates is not an error — it reflects genuine methodological differences that investors and analysts need to understand when interpreting OPEC output data:
- Membership scope: The Reuters survey excludes the UAE, which formally exited OPEC as of May 1, 2026. Bloomberg and MEES figures may incorporate UAE volumes differently, inflating their aggregate totals relative to Reuters
- Condensate accounting: Some datasets bundle natural gas condensate alongside crude oil in production totals; others isolate raw crude only. This distinction can add or subtract several hundred thousand barrels per day from headline figures
- Tracking methodology: Sources like LSEG and Kpler use Automatic Identification System (AIS) tanker-tracking data, which captures volumes at the point of cargo loading rather than wellhead production, introducing a timing lag of days to weeks
- Survey-based vs. flow-based data: Reuters combines tanker flow data with direct source reporting from OPEC officials, oil company representatives, and consultants, producing a blended estimate that may diverge from pure flow-tracking figures
Despite these methodological differences, every major tracking body is pointing in the same direction: OPEC output has reached a level not seen in at least a quarter century, and by some measures, not since the immediate aftermath of the Gulf War.
What Triggered the Collapse?
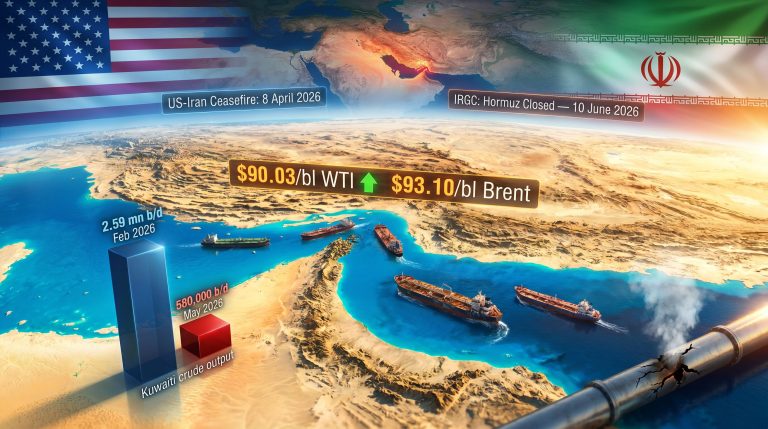
The proximate cause of this production decline is a US naval blockade targeting Iranian crude exports, which commenced on April 13, 2026. The blockade was designed to restrict Iran's ability to monetise its oil production, but its consequences extended far beyond Iran's own output contribution through a secondary mechanism: Iran's effective closure of the Strait of Hormuz. Consequently, this represents a severe case of oil market disruption with cascading global consequences.
The Strait of Hormuz as a Global Energy Chokepoint
The Strait of Hormuz is the world's most critical single point of oil transit. According to the US Energy Information Administration (EIA), approximately 20 to 21 million barrels of crude oil pass through this narrow waterway daily, representing roughly one-fifth of total global oil consumption. Unlike other potential supply disruptions, a Hormuz closure does not just affect one producer — it simultaneously restricts exports from Saudi Arabia, Kuwait, Iraq's southern terminals, Qatar, and Bahrain.
This is a distinction that is often underappreciated in general coverage of Middle East energy risk. The blockade of Iran was the trigger, but the cascading effect through Hormuz transformed a bilateral geopolitical action into a systemic supply shock affecting multiple producers simultaneously.
The disruption sequence as it unfolded:
- US naval blockade against Iranian crude and condensate exports initiated on April 13, 2026
- Iran responds with effective closure of the Strait of Hormuz, restricting transit for all Gulf producers
- Tanker operators implement elevated war-risk surcharges, reducing available shipping capacity for Gulf cargoes
- Saudi Arabian output records a further month-on-month decline due to export route constraints
- Eight OPEC+ members who had formally agreed to raise production in May find themselves unable to execute those increases
- Total OPEC output falls by 1.06 million barrels per day in a single month, reaching a multi-decade low
Iran's Output: A Six-Year Low
Iran experienced the steepest decline of any individual OPEC member, with crude oil and condensate exports falling to their lowest level in at least six years. This is a meaningful data point because Iran had, in the years preceding the blockade, been gradually rebuilding export volumes through informal channels and willing buyers in Asia. The blockade effectively reversed years of incremental recovery in a matter of weeks.
What makes the Iranian situation particularly complex from an energy market perspective is the condensate dimension. Iran is one of the world's largest producers of natural gas condensate, a lighter hydrocarbon stream that is counted alongside crude in some production metrics but is chemically distinct and serves different refinery configurations. The blockade targeted both crude and condensate exports, removing a category of supply that certain Asian refineries had specifically configured their operations to process.
Country-by-Country: Winners and Losers Within OPEC
The May 2026 production data reveals a significant divergence in outcomes across OPEC members, shaped largely by geography and infrastructure.
Members Registering Declines
Iran: The blockade's primary target. Crude and condensate exports at a six-year low. The country's position at the entrance to the Strait of Hormuz made it both the target of the blockade and the instrument of its amplification.
Saudi Arabia: Recorded a further production decline in May despite possessing significant upstream capacity. The Hormuz disruption constrained the kingdom's export flexibility, and Saudi Arabia's role as OPEC's traditional swing producer means its output signals carry disproportionate weight in market sentiment.
Members Managing to Increase Output
Iraq: Bucked the regional trend by registering a supply increase, though the driver was higher domestic consumption rather than export growth. Iraq's pipeline infrastructure to Turkey's Ceyhan terminal on the Mediterranean provides partial insulation from Hormuz disruptions for northern output, while southern export terminals remained constrained.
Venezuela: Continued a gradual production recovery, benefiting entirely from its Atlantic-facing export infrastructure. Venezuelan crude entirely bypasses the Strait of Hormuz, making it structurally immune to the current disruption. However, ongoing sanctions and infrastructure degradation impose a hard ceiling on how far Venezuelan output can realistically expand in the near term.
Nigeria: Also pumped more in May, with West African crude priced in the Atlantic Basin serving as a natural substitute for buyers redirecting away from Gulf supply. Nigerian crude grades, particularly Bonny Light, compete directly with North Sea Brent in European and Asian markets.
This Is Not 2020: Why the Nature of the Shock Matters
The comparison to COVID-era production levels is instructive precisely because the two situations are structurally inverted. Understanding this distinction is essential for interpreting price dynamics correctly.
| Characteristic | COVID-19 Collapse (2020) | Iran Blockade Shock (2026) |
|---|---|---|
| Primary driver | Demand destruction | Supply removal |
| Demand condition | Collapsed | Intact or growing |
| Price direction | Downward | Upward pressure |
| OPEC response | Voluntary cuts to match demand | Involuntary decline due to force majeure |
| Recovery pathway | Demand recovery drives output | Geopolitical resolution required |
| Refinery margins | Compressed by oversupply | Compressed by feedstock cost inflation |
A supply-side shock with demand remaining intact operates through completely different price transmission mechanisms than a demand collapse. In 2020, OPEC cut production to prevent prices from falling further. In 2026, production has been forcibly removed from the market while consumption demand continues. The price implications run in the opposite direction.
Historical Production Floor Context
Placing the 2026 figures within a longer historical arc reveals just how extreme this decline is. The geopolitical oil price drivers at play today represent a convergence rarely seen in modern energy history.
| Crisis Period | Approximate OPEC Output | Primary Cause |
|---|---|---|
| Gulf War, August 1990 | ~17 million bpd (MEES) | Iraqi invasion of Kuwait |
| Post-9/11 demand shock, 2001 | ~25 to 26 million bpd | Demand contraction |
| COVID-19 collapse, 2020 | ~22 to 23 million bpd | Global lockdown demand destruction |
| Iran Blockade / Hormuz Closure, 2026 | 16.13 to 20.55 million bpd* | Geopolitical supply disruption |
Range reflects methodological and membership definition variance across reporting bodies
OPEC's Structural Weight and the OPEC+ Framework Under Stress
OPEC member nations collectively account for approximately 35% of global crude oil production and control roughly 50% of internationally traded oil volumes, according to the EIA. These figures underscore why even modest percentage changes in OPEC output generate outsized effects on global price discovery mechanisms.
The broader OPEC+ coalition had formally agreed, in advance, that eight of its members would raise production in May 2026. The Iran war and associated blockade rendered those commitments operationally impossible. This creates an important secondary problem beyond the physical supply gap: it raises questions about the credibility and functionality of OPEC+ as a supply management mechanism when external geopolitical force majeure overrides agreed quota compliance.
The UAE's formal exit from OPEC as of May 1, 2026 adds further complexity. The UAE had been one of the group's more productive members, and its departure means that future OPEC aggregate figures will structurally understate total Gulf Cooperation Council production unless analysts account for this membership change explicitly.
The next major ASX story will hit our subscribers first
Can Non-OPEC Producers Fill the Gap?
The logical follow-on question for energy markets is whether non-OPEC producers, particularly US shale, can compensate for the shortfall. The honest answer is: not quickly, and not fully.
US shale production constraints:
- Shale operators typically require three to six months to meaningfully respond to price signals, given the time required to mobilise rigs, complete drilled-but-uncompleted (DUC) wells, and bring new production online
- Post-2020 capital discipline has fundamentally reshaped shale operator behaviour. The era of growth-at-any-cost drilling has given way to a returns-focused model that prioritises shareholder distributions over production maximisation
- Permian Basin infrastructure, including pipeline takeaway capacity and processing facilities, creates a physical ceiling on how rapidly output can be scaled even when capital is available
Other non-OPEC alternatives:
- Brazil operates deepwater pre-salt fields with development lead times measured in years, not months. Brazil cannot respond to short-term price signals
- Canada's oil sands produce heavy crude with high breakeven costs. Production is relatively stable but not rapidly scalable, and heavy crude requires specialised refinery configurations
- Guyana is the fastest-growing non-OPEC producer on a percentage basis, but absolute volumes remain too modest to offset a million-barrel-per-day supply gap
- Norway's North Sea fields are in a mature basin with limited upside production potential
Downstream Consequences: Price Transmission and Economic Exposure
When OPEC oil output falls to a 25-year low for supply-side reasons, the economic consequences propagate through the global economy through several interconnected pathways:
- Physical market tightening at key delivery hubs reduces crude inventory buffers
- Futures market backwardation deepens as front-month contracts price in scarcity premiums relative to deferred months — a dynamic visible in both WTI and Brent futures markets
- Refinery feedstock costs rise, compressing crack spreads and creating margin pressure for downstream processors
- Retail fuel prices increase in import-dependent economies as refiners pass through higher input costs
- CPI inflation components shift upward, complicating monetary policy decisions in economies targeting low inflation
Which Economies Face the Greatest Exposure?
| Economy Type | Exposure Level | Key Vulnerability |
|---|---|---|
| Asian crude importers (India, China, South Korea, Japan) | Very High | Heavy Gulf crude reliance; Hormuz transit dependency |
| European refiners | High | Diversified supply but exposed to spot price spikes |
| US domestic market | Moderate | Partially insulated by domestic shale production |
| Emerging market importers | Very High | Limited hedging capacity; high energy import share of GDP |
| Non-OPEC oil exporters | Beneficial | Higher prices improve fiscal positions |
India and China deserve particular attention in this analysis. Both nations have developed deep trade relationships with Gulf producers precisely because Persian Gulf crude offers competitive pricing relative to Atlantic Basin alternatives. A sustained Hormuz disruption forces Asian refiners into spot markets for West African, North Sea, and US Gulf Coast crudes, all of which carry freight cost premiums. For India, where refined petroleum products represent a significant share of consumer expenditure, this translates directly into fuel price pressure with domestic political consequences. In addition, the broader oil price volatility trends emerging from this crisis are likely to persist well beyond the immediate disruption.
Frequently Asked Questions
Why is OPEC oil output at its lowest since 2000?
A US naval blockade targeting Iranian crude exports, initiated on April 13, 2026, combined with Iran's subsequent effective closure of the Strait of Hormuz, removed a significant volume of Gulf supply from global markets simultaneously. The combined effect reduced total OPEC output by 1.06 million barrels per day in May 2026 alone, bringing the 11-member group's production to 16.13 million bpd.
Is this decline worse than the COVID-19 production drop?
By the Reuters survey methodology, yes. The May 2026 figure of 16.13 million bpd sits below the COVID-era lows recorded during the 2020 demand collapse. However, the two situations are structurally different. The 2020 decline was a coordinated voluntary response to demand destruction; the 2026 decline is an involuntary supply removal with demand remaining intact.
Which OPEC members increased production in May 2026?
Iraq, Venezuela, and Nigeria all registered output increases. Iraq's gains were driven by higher domestic consumption rather than export growth. Venezuela and Nigeria benefited from Atlantic-facing export infrastructure that bypasses the Strait of Hormuz entirely.
What happened to UAE production data?
The UAE formally withdrew from OPEC effective May 1, 2026, meaning its production volumes are excluded from OPEC aggregate figures in the Reuters survey. Analysts comparing current OPEC output against historical benchmarks need to account for this membership change to avoid misleading comparisons.
What share of global oil does OPEC control?
According to the EIA's OPEC supply data, OPEC member nations produce approximately 35% of global crude oil and account for around 50% of internationally traded oil volumes.
Key Takeaways for Energy Market Participants
The OPEC oil output collapse of mid-2026 carries several structural lessons that extend beyond the immediate headlines:
- Geopolitical risk has reasserted itself as the dominant variable in global oil supply, displacing the demand-driven dynamics that defined the post-COVID period
- The Strait of Hormuz amplifies any Iranian disruption into a systemic Gulf supply shock, affecting multiple producers simultaneously rather than just the direct target of geopolitical action
- Supply-side shocks with intact demand produce the opposite price dynamics to demand-driven collapses, a distinction critical to correct market positioning
- Non-OPEC producers face structural constraints on rapid output scaling, meaning the supply gap cannot be filled quickly regardless of price incentives
- OPEC+'s quota compliance framework is exposed to force majeure events that override member production capacity, raising questions about the mechanism's reliability during geopolitical crises
- Asian import-dependent economies carry concentrated exposure, given their Hormuz transit dependency and limited ability to rapidly diversify crude sourcing
Disclaimer: This article is intended for informational purposes only and does not constitute financial or investment advice. Oil market forecasts and price projections involve significant uncertainty. Readers should conduct their own due diligence before making any investment decisions. Historical production comparisons are subject to methodological variance across data sources.
Want to Stay Ahead of the Resource Opportunities Emerging From Global Energy Disruptions?
When geopolitical shocks reshape commodity markets this rapidly, Discovery Alert's proprietary Discovery IQ model delivers real-time ASX mineral discovery alerts — turning complex market shifts into actionable investment intelligence for both short-term traders and long-term investors. Explore how historic mineral discoveries have generated exceptional returns and begin your 14-day free trial today to secure a market-leading edge before the broader market catches on.