June 12, 2026
The Geography of Oil: Why Chokepoints Outrank Cartels in a Crisis
Every few decades, the global oil market runs a live experiment that textbooks cannot fully prepare traders for: what happens when the physical infrastructure of energy delivery breaks down faster than policy can respond? The answer, historically, is that geography wins. Pipelines, tanker routes, and maritime straits are not abstractions on a policy document. They are the circulatory system of the global economy, and when one artery closes, no amount of quota arithmetic can compensate in the short term.
That is precisely the dynamic playing out across oil markets in mid-2026, where the simultaneous OPEC+ output hike and Strait of Hormuz closure have created one of the most analytically confusing price environments in recent memory. On the surface, a cartel increasing supply should suppress prices. In practice, elevated Brent benchmarks tell a different story entirely.
When big ASX news breaks, our subscribers know first
What the OPEC+ July 2026 Decision Actually Says
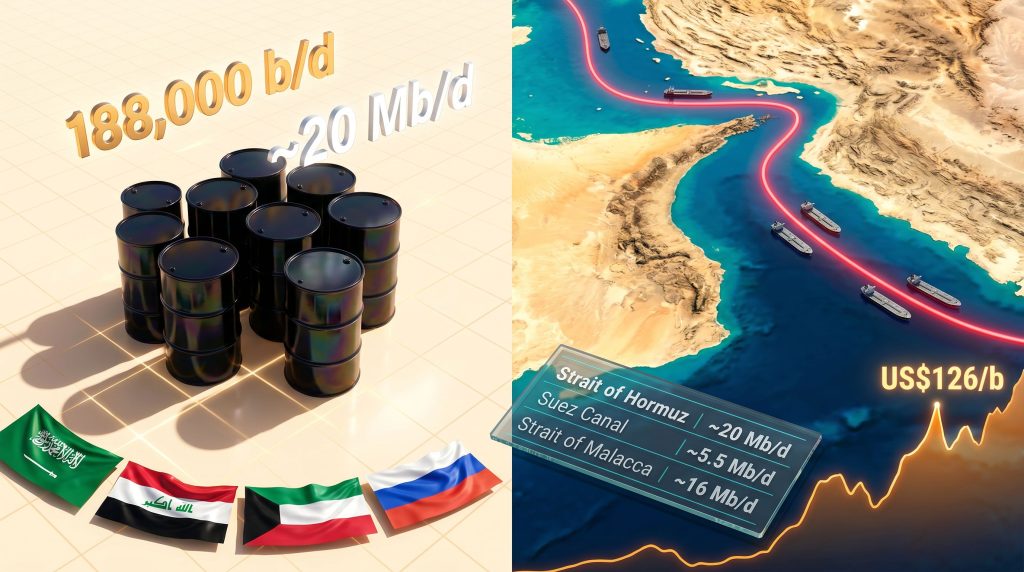
On June 7, 2026, seven core OPEC+ nations convened virtually to assess market conditions and agreed to implement a combined production quota increase of 188,000 barrels per day (b/d) for July, according to reporting by Mexico Business News. The participating nations were Saudi Arabia, Russia, Iraq, Kuwait, Kazakhstan, Algeria, and Oman. This marked the fourth consecutive monthly quota increase as the group pressed forward with its plan to gradually unwind the voluntary production cuts it had introduced in 2023.
Between April and June 2026, these seven producers collectively lifted their quotas by approximately 600,000 b/d. The July addition brings the total unwinding of the first voluntary cut tranche firmly into view, with the group targeting completion of the 2.2 million b/d rollback by September 2026 at the latest.
Saudi Arabia's quota ceiling for July 2026 will reach 10.291 million b/d (mb/d). Russia contributes 62,000 b/d to the July increase, matching Saudi Arabia's equivalent increment. On paper, these are meaningful supply additions. In practice, however, the numbers bear almost no relationship to what is actually flowing to buyers.
The Gap Between Quota and Reality
Saudi Arabia's actual reported production as of March 2026 stood at approximately 7.76 mb/d, according to Mexico Business News. That leaves a gap of roughly 2.5 mb/d between what the kingdom is entitled to produce under its quota and what it is actually delivering to the market. The constraint is not geological capacity. It is logistical.
The Strait of Hormuz, the waterway through which a substantial share of Saudi seaborne crude must pass, has been operating under severe disruption since late February 2026. Furthermore, OPEC production decisions made at the quota level simply cannot override the physical reality of a compromised export corridor.
Rystad Energy assessed the group's output decisions as having little to no real impact on oil market balances under current conditions, a view reported by Rigzone. The analytical firm's reasoning is straightforward: quota increases only translate into additional supply when the physical export infrastructure is functional. When it is not, announced barrel increases are, in the language of energy market analysts, paper barrels — commitments that exist in meeting communiques rather than in tanker manifests.
The Strait of Hormuz: Understanding the World's Most Critical Oil Corridor
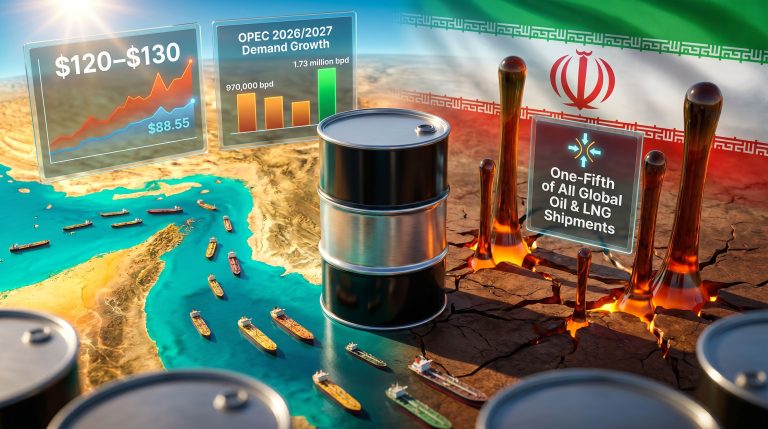
The Strait of Hormuz is a 33-kilometre-wide passage connecting the Persian Gulf to the Gulf of Oman and, ultimately, to the broader global seaborne crude market. According to the US Energy Information Administration, approximately 20% of all internationally traded oil transits this waterway daily, a volume that translates to roughly 20 million barrels per day (mb/d) at recent flow rates.
What makes the Strait uniquely dangerous from a supply security perspective is the near-absence of viable alternatives at scale. Saudi Arabia operates the East-West pipeline, which has a capacity of approximately 5 mb/d — a meaningful volume, but far less than a fraction of total Gulf export flows. For Iraq and Kuwait, no significant bypass infrastructure exists at all.
Chokepoint Comparison: How the Hormuz Risk Stacks Up
| Chokepoint | Daily Oil Transit (approx.) | Alternative Route | Rerouting Cost / Delay |
|---|---|---|---|
| Strait of Hormuz | ~20 mb/d | Saudi East-West Pipeline (limited, ~5 mb/d) | High, weeks of added delay |
| Suez Canal | ~5.5 mb/d | Cape of Good Hope | Moderate, 10–14 additional days |
| Strait of Malacca | ~16 mb/d | Lombok / Sunda Strait | Low to moderate |
The Suez Canal disruption of 2021 demonstrated how even a temporary chokepoint blockage could cascade through freight markets globally. The Hormuz closure is structurally far more severe: the volume at risk is nearly four times larger, and the bypass alternatives are dramatically more limited.
The Iran conflict, which escalated to the point of effective export corridor disruption from February 28, 2026, has throttled outbound crude movements from Saudi Arabia, Iraq, and Kuwait simultaneously. Al Jazeera reported that the resulting June OPEC+ output decision was essentially symbolic, noting that the conflict had effectively overridden the cartel's stated production intentions.
Three Scenarios for the Hormuz Disruption
Scenario A: Sustained Partial Disruption (Current Baseline)
- Reduced tanker traffic volume with selective passage under elevated risk conditions
- Estimated effective supply reduction in the range of 5 to 10 mb/d of export capacity
- War-risk insurance premiums on Gulf tanker routes have surged significantly, with costs passed through to landed crude prices for Asian importers
- Brent prices have been sustained above US$100/b under this condition
- Very Large Crude Carriers (VLCCs) face operational constraints that limit their ability to reroute efficiently around the Cape of Good Hope
Scenario B: Complete and Enforced Closure
- Total cessation of commercial tanker movements through the strait
- Potential daily supply removal approaching 20 mb/d across crude and refined products
- IEA member nations collectively hold approximately 1.2 billion barrels in strategic petroleum reserves, providing roughly 60 days of buffer at moderate disruption levels
- The 1980s Tanker War in the Persian Gulf offers a historical, if imperfect, parallel: disruption was sustained for years, but never approached full closure enforcement at this scale
Scenario C: Negotiated Reopening Within 60 to 90 Days
- A diplomatic resolution pathway would rapidly restore physical export flows
- Stranded supply would return to market faster than most participants expect, given pre-positioned production capacity
- The OPEC+ quota overhang risk becomes acute: if Hormuz reopens while elevated quotas remain in place, the market faces a rapid and potentially disorderly price correction
- Long-positioned traders who entered during the disruption premium phase would face meaningful downside exposure
Investor Warning: Oil markets are currently pricing a geopolitical risk premium that reflects Hormuz disruption conditions, not OPEC+ supply fundamentals. A sudden diplomatic resolution could trigger a sharp downside correction in crude benchmarks, catching long-positioned market participants off guard. Investors should treat the current price level as partially contingent on continued disruption.
How Crude Benchmarks Are Absorbing the Dual Signal
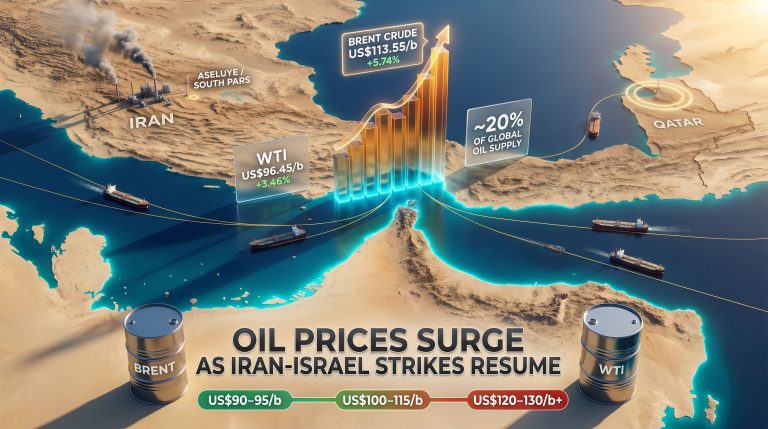
Brent crude briefly surged above US$126 per barrel amid heightened conflict escalation signals, according to Mexico Business News. The Brent and WTI futures forward curve structure has exhibited deep backwardation during the disruption period, meaning near-term delivery prices significantly exceed forward prices. Backwardation of this depth is typically a reliable proxy for severe physical market tightness, as buyers are willing to pay substantial premiums for immediate delivery.
The apparent contradiction between bearish OPEC+ headline supply additions and bullish price action resolves quickly once the physical delivery constraint is understood. Quota increases are a policy signal. The Hormuz closure is a physical reality. Physical reality wins.
The Hidden Cost: Shipping, Insurance, and Asian Import Exposure
Beyond the headline crude price, a secondary cost transmission mechanism is operating through the freight and insurance markets. War-risk insurance surcharges on Gulf-route tankers have escalated sharply, with those costs embedded into the effective landed price of crude reaching East Asian refining hubs. The additional voyage time and fuel cost involved in rerouting around the Cape of Good Hope adds further expense to any barrels that do attempt alternative routing.
The economies most exposed to these compounding cost pressures are concentrated in Asia:
| Economy | Gulf Crude Dependency | Alternative Supply Access | Vulnerability Rating |
|---|---|---|---|
| Japan | High (~85% Middle East sourced) | Limited near-term alternatives | Very High |
| South Korea | High (~70% Middle East sourced) | Some US and African diversification | High |
| India | Moderate to High | Russia, West Africa options | Moderate to High |
| China | Moderate | Russia pipeline plus diversified sources | Moderate |
| Europe | Low to Moderate | North Sea, US LNG, pipeline gas | Lower |
| United States | Low (net exporter) | Domestic and Western Hemisphere supply | Low |
Japan's structural vulnerability is particularly acute. With approximately 85% of its crude imports historically sourced from the Middle East and no domestic production of significance, a prolonged Hormuz disruption creates genuine energy security stress rather than a purely financial inconvenience.
The UAE's Departure and What It Reveals About OPEC+'s Fault Lines
The July 2026 increase was the first substantive production decision taken since the United Arab Emirates formally exited OPEC+ on May 1, 2026, following an announcement on April 28. The structural reason for the departure is rooted in a fundamental tension that quota-constrained organisations always face when members develop capacity that exceeds their allocated ceilings.
ADNOC's infrastructure investment programme had lifted UAE production capacity to approximately 4.85 mb/d by the time of departure, with targets pointing toward 5 mb/d by 2027. The quota ceiling the UAE operated under was approximately 3.5 mb/d, meaning Abu Dhabi was voluntarily foregoing monetisation of roughly 1.35 mb/d of productive capacity. At sustained Brent prices above US$100/b, the opportunity cost of that foregone production runs to billions of dollars annually.
The July 2026 increase at 188,000 b/d is marginally smaller than the 206,000 b/d approved for June. Part of that reduction reflects the absence of the UAE's contribution to the collective increase. Consequently, OPEC's market influence is facing renewed scrutiny as its membership base shifts.
The Template Risk: Could Other Members Follow?
- Kazakhstan has a documented record of quota non-compliance, making it among the most likely candidates to test the boundaries of production-without-constraint
- The compensation mechanism for countries that exceeded quotas since January 2024 has been extended to December 2026, indicating the enforcement architecture is under strain
- The Joint Ministerial Monitoring Committee continues to review compliance, with the next formal meeting scheduled for July 5, 2026
- The group has reaffirmed that production policy remains flexible and that voluntary adjustments may be reversed in part or in full based on market conditions
The UAE's exit is less a market event than an institutional signal. It demonstrates that quota discipline erodes when the opportunity cost of compliance grows large enough — a dynamic that could accelerate if Hormuz reopens and global market share competition among Gulf producers intensifies.
Mexico's Fiscal Exposure: The Indirect Beneficiary With Structural Constraints
Mexico occupies an unusual position in this market narrative. It is not an OPEC member, does not participate in OPEC+ deliberations, and has no direct influence over the decisions being made in Riyadh or Vienna. Yet the country's federal budget arithmetic is directly shaped by the price outcomes those decisions produce.
Mexico's Secretaria de Hacienda y Credito Publico (SHCP) built its 2026 federal budget around a conservative crude reference price assumption of US$54.9 per barrel. The sustained elevation of international benchmarks well above that level — a direct consequence of the supply disruption created by the OPEC+ output hike and Strait of Hormuz closure dynamic — has generated unexpected fiscal revenue relative to budget projections throughout the year.
Mexico exports a heavy crude blend called Maya, which typically trades at a discount to Brent. Even accounting for that discount structure, the gap between the budget reference price and prevailing market prices has delivered meaningful above-target revenue to the federal government. In addition, this outcome underscores the broader oil geopolitics analysis that connects regional conflict to unexpected fiscal windfalls across non-member producing nations.
The PEMEX Constraint: Why the Windfall Has Limits
The revenue upside is real but bounded. PEMEX, Mexico's state-owned oil company, has been navigating a structural production decline that has pushed output to multi-decade lows, as reported separately by Mexico Business News. The paradox Mexico faces is precise: elevated prices create maximum fiscal benefit exactly when declining export volumes limit the total barrels available to sell at those prices.
The divergence between Mexico's price exposure, which is currently positive, and its volume exposure, which is persistently negative, creates a net fiscal risk framework that prevents the country from fully capturing the windfall that the Hormuz crisis is generating for well-positioned exporters. Long-term underinvestment in PEMEX's upstream capacity is the structural factor that caps Mexico's ability to monetise the current price environment. However, these oil market disruption risks extend well beyond Mexico's borders and could reshape global energy trade flows for years to come.
The next major ASX story will hit our subscribers first
FAQ: OPEC+ Output Hike and Strait of Hormuz Closure
What is the OPEC+ July 2026 output hike?
Seven OPEC+ member nations approved a combined production quota increase of 188,000 b/d for July 2026, the fourth consecutive monthly increase as part of a phased rollback of voluntary output cuts introduced in 2023.
Does the OPEC+ hike actually add oil to the market?
Under current conditions, largely no. The Strait of Hormuz disruption prevents the physical delivery of barrels from the Gulf producers most affected, rendering quota increases effectively theoretical. Rystad Energy characterised the increases as having little to no real market impact under current conditions. Furthermore, analysis from The Arab Weekly corroborates this view, noting that the OPEC+ output hike and Strait of Hormuz closure together have fundamentally decoupled quota policy from physical supply outcomes.
How long could strategic reserves cover a complete Hormuz closure?
IEA member nations hold approximately 1.2 billion barrels in emergency reserves. At moderate disruption levels, that represents roughly 60 days of coverage. A complete and sustained closure beyond that window would create severe supply deficits across import-dependent economies.
Why did the UAE leave OPEC+?
The UAE's production capacity of approximately 4.85 mb/d significantly exceeded its quota ceiling of around 3.5 mb/d. The opportunity cost of compliance, particularly in a high-price environment, became too large to sustain. The departure formalises a model where capacity-rich members produce without quota constraint.
What are the risks if Hormuz reopens suddenly?
A rapid diplomatic resolution would return stranded supply to market quickly, collapsing the geopolitical risk premium currently embedded in Brent prices. With OPEC+ quotas still elevated, a sudden reopening could trigger a significant downside price correction. This is the primary asymmetric risk for long oil positions in the current environment.
Disclaimer: This article contains analysis of market conditions, price projections, and scenario modelling that are inherently speculative. Energy market forecasts involve significant uncertainty, and actual outcomes may differ materially from those described. Nothing in this article constitutes financial or investment advice. Readers should consult qualified professionals before making investment decisions.
Further Exploration: Readers seeking additional context on OPEC+ production dynamics and Gulf energy geopolitics may find related reporting at Mexico Business News, which covers ongoing developments across the oil and gas sector.
Want to Know Which ASX Mining Companies Could Benefit From Global Energy Disruptions?
Discovery Alert's proprietary Discovery IQ model delivers real-time alerts on significant ASX mineral discoveries, transforming complex market data into actionable investment insights — so subscribers are positioned ahead of the broader market the moment a major discovery is announced. Explore historic examples of exceptional discovery returns or visit the Discovery Alert home page to begin your 14-day free trial today.