July 11, 2026
The Architecture of a Supply Recovery Built on Shifting Sand
Every oil market recovery eventually confronts the question of what holds it together. For OPEC+, the partial production rebound recorded in June 2026 rests on a single structural assumption: that tankers can move freely through a 33-kilometre-wide waterway connecting the Persian Gulf to the Gulf of Oman. The OPEC+ production rebound at risk from renewed war is not merely a headline risk — it is a structural vulnerability embedded in the physical geography of global energy supply. When that assumption is challenged, every barrel recovered at the wellhead becomes conditional.
The Strait of Hormuz is not simply a shipping lane. It is the physical validation point for every OPEC+ production decision made in meeting rooms and ministerial summits. Approximately 20 percent of global oil trade transits the strait daily, and no combination of alternative routing options, overland pipelines, or extended maritime diversions can fully substitute for that volume at the speed markets require.
When threat environments deteriorate in the strait, producers do not merely delay deliveries. They reduce wellhead output because accumulating unsellable inventory at scale is operationally and commercially untenable. That is the structural vulnerability at the heart of the June 2026 rebound, and it is the same vulnerability now being stress-tested by renewed military exchange between the United States and Iran. Furthermore, OPEC's global influence over price stability makes every disruption in this region a matter of international economic consequence.
When big ASX news breaks, our subscribers know first
OPEC+ Production Snapshot: June 2026 by the Numbers
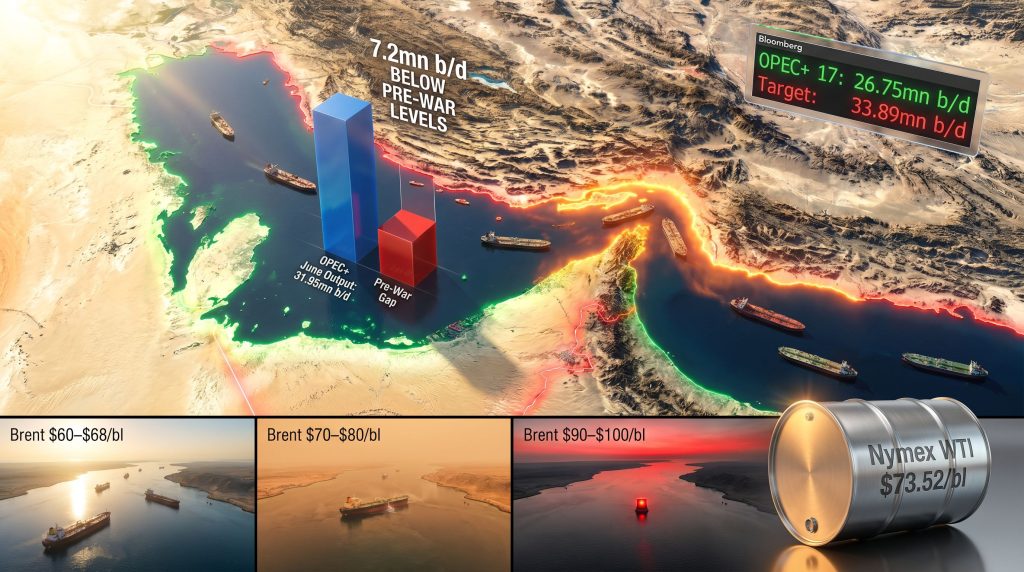
The headline figure from June tells a story of genuine, if fragile, recovery. OPEC+ output climbed by approximately 2.25 million barrels per day (mn b/d) on the month to reach 31.95mn b/d, the highest collective production level since hostilities began on 28 February 2026, according to Argus estimates. Yet that number sits roughly 7.2mn b/d below pre-war production levels, illustrating a recovery that has covered significant ground while still having the greater part of the journey ahead of it.
Key Insight: The June rebound was the largest single-month output gain since the conflict began, yet the cumulative deficit versus pre-war levels remains so substantial that OPEC+ is effectively managing a supply crisis dressed in the language of quota management.
| OPEC+ Grouping | June Output (mn b/d) | May Output (mn b/d) | Production Target (mn b/d) | Variance vs. Target |
|---|---|---|---|---|
| OPEC 8 (core members) | 13.96 | 11.82 | 20.28 | −6.32 |
| Non-OPEC 9 | 12.79 | 12.81 | 13.61 | −0.82 |
| OPEC+ 17 (combined) | 26.75 | 24.63 | 33.89 | −7.14 |
| Total OPEC+ (inc. exempt) | 31.95 | 29.70 | n/a | n/a |
Source: Argus Media estimates, July 2026. Exempt members (Iran, Libya, Venezuela) excluded from target calculations.
The combined production target shortfall of 7.14mn b/d for the OPEC+ 17 grouping reveals the fundamental disconnect between the alliance's paper-based quota architecture and physical barrel delivery. Seven core members including Saudi Arabia, Russia, Iraq, Kuwait, Kazakhstan, Algeria, and Oman agreed on 5 July to raise their collective production ceiling by a further 188,000 b/d for August, leaving only 188,000 b/d of voluntary cuts formally in place.
The mechanics here matter: these ceiling adjustments are pre-positioning decisions designed to capture output gains once Hormuz fully normalises, not reflections of barrels already flowing. OPEC production decisions of this nature carry enormous weight on global benchmarks, even when physical delivery lags significantly behind announced targets.
The Strait of Hormuz: Why No Alternative Fully Compensates
Is There Any Viable Replacement for Hormuz?
Understanding why the OPEC+ production rebound at risk from renewed war is such a pressing concern requires understanding what makes Hormuz irreplaceable rather than merely important. The strait's chokepoint status is a product of geography, infrastructure investment history, and scale. Alternative routing options do exist, however each carries critical limitations:
- The Abqaiq-Yanbu pipeline (Saudi Arabia): Capacity of approximately 5mn b/d, but designed to supplement rather than replace Hormuz flows; cannot absorb full Gulf export volumes
- The Iraq-Turkey Kirkuk-Ceyhan pipeline: Long-standing operational challenges including Kurdish regional disputes; well below theoretical capacity
- Cape of Good Hope diversions: Adds 15 to 20 days of transit time per voyage, requiring a larger tanker fleet to maintain equivalent delivery frequency
- Suez Canal routing: Limited to certain vessel sizes and already operating near capacity under normal conditions
No single alternative, and no combination of alternatives, can substitute for Hormuz flows at the volume and speed that Asian refinery systems — particularly in China, Japan, South Korea, and India — require to maintain operational continuity. This is why Hormuz disruption forces wellhead curtailment rather than simply rerouting: the market cannot absorb the timing mismatch.
Historical precedents, including the tanker war episodes of the 1980s and the Iranian mining threats of 2012, caused meaningful supply disruptions and price spikes. However, those episodes involved harassment of shipping rather than full closure. The 2026 conflict represents a categorically different scenario in both duration and the completeness of the supply impact it generated. For context on how oil market disruptions compound across geopolitical fault lines, the current crisis illustrates precisely how quickly physical flows can diverge from paper-based projections.
Country-by-Country: Gulf Producer Recovery Status
The June rebound was geographically concentrated in the Mideast Gulf members that were able to expand exports through the strait following the interim US-Iran peace framework signed on 18 June.
Saudi Arabia
Output reached 7.09mn b/d in June, a month-on-month gain of approximately 520,000 b/d. Despite this recovery, production remained roughly 3.79mn b/d below pre-conflict levels and sat 3.20mn b/d below the assigned quota of 10.29mn b/d. The scale of Saudi Arabia's remaining recovery potential is significant, but it is entirely conditional on export access through the strait normalising sustainably.
Iraq
Output climbed to 2.15mn b/d, up approximately 600,000 b/d on the month. The recovery was partly driven by ramping up exports from Basrah port, which sits inside the Mideast Gulf and is therefore directly dependent on Hormuz access for seaborne cargoes. Iraq remains 2.20mn b/d below its assigned production target of 4.35mn b/d.
Kuwait
Kuwait recorded the sharpest proportional recovery among Gulf members, with output rising by approximately 940,000 b/d to 1.52mn b/d. Official reporting indicated that production during the final ten days of June was approaching 2mn b/d, suggesting momentum building into July before the resumption of hostilities complicated the outlook. Kuwait remains 1.11mn b/d below its production ceiling.
Iran
Output edged higher by approximately 100,000 b/d to 2.75mn b/d following a temporary sanctions waiver issued as part of the interim peace framework. That waiver was revoked on 8 July alongside the resumption of US military strikes, placing Iran's near-term production and export trajectory under significant uncertainty. Iran operates outside formal OPEC+ production targets but its output and export behaviour directly influences overall market balance.
The UAE's Breakout Strategy and the Market Share Question
One of the least widely discussed dimensions of the current recovery is the competitive dynamic introduced by the UAE's departure from the OPEC+ alliance and its subsequent production behaviour. In its second month as an independent operator, the UAE recorded output of 3.82mn b/d in June, a month-on-month rise of approximately 1.71mn b/d and a new production record.
This level exceeded the quota the UAE would likely have held under the alliance by roughly 360,000 b/d, and critically, it represents output above pre-war production baselines rather than simply a recovery to them.
Strategic Implication: The UAE is not merely recovering lost barrels. It is actively expanding its market position beyond pre-conflict levels at the precise moment when core OPEC+ members are still attempting to return to their own pre-war output. This creates an asymmetric competitive dynamic that could pressure Saudi Arabia, Iraq, and Kuwait to prioritise volume recovery over price discipline as the strait reopens.
| Scenario | UAE Output Path | OPEC+ Response | Market Impact |
|---|---|---|---|
| Cooperative Recovery | UAE moderates expansion to avoid market flooding | Core members accept UAE growth given overall supply deficit | Gradual price stabilisation, reduced war risk premium |
| Competitive Escalation | UAE continues aggressive expansion above pre-war levels | Saudi Arabia and Iraq accelerate their own recovery targets | Downward price pressure, potential quota discipline erosion |
| Conflict Re-escalation | UAE curtails exports due to renewed Hormuz threat | All Gulf producers face renewed output constraints | Sharp price spike, global supply deficit widens further |
Russia's Independent Output Problem: The Second Supply Drag
Any analysis of the OPEC+ production rebound at risk from renewed war must account for the alliance's second simultaneous supply underperformance, which is structurally unrelated to Hormuz. Russia's June output of 9.00mn b/d placed it approximately 760,000 b/d below its assigned production target of 9.76mn b/d.
The shortfall is driven by sustained Ukrainian strikes on Russian energy infrastructure, including refineries, export terminals, and pipeline nodes. Unlike the Hormuz situation, this damage accumulates over time and is not reversible by a ceasefire agreement in a different theatre of conflict. The dual-front supply disruption creates a compounding deficit scenario.
OPEC+'s formal quota framework was not engineered to simultaneously absorb a near-complete Hormuz closure and persistent Russian infrastructure degradation. The result is that the alliance's announced target architecture has become increasingly theoretical, describing an aspirational production landscape rather than a deliverable near-term outcome. Consequently, the oil price geopolitics surrounding both theatres of conflict are feeding directly into benchmark pricing uncertainty.
The next major ASX story will hit our subscribers first
IEA Supply and Demand Projections: Conditional Recovery
The International Energy Agency's July 2026 Oil Market Report captures both the partial progress achieved and the fragility of the path forward. Global oil demand reached a trough of approximately 97.9mn b/d in May 2026, representing a year-on-year decline of roughly 5.3mn b/d at the conflict's peak.
The IEA's updated forecast projects a full-year 2026 demand decline of approximately 1mn b/d, arriving at roughly 103.5mn b/d, approximately 70,000 b/d less than the prior month's estimate. Demand recovery is being driven by pent-up Asian consumption absorbing progressively increasing Hormuz exports, alongside lower crude prices and improving economic sentiment.
| Metric | 2026 Estimate | 2027 Projection | Key Assumption |
|---|---|---|---|
| Global oil supply | ~102.6mn b/d (−3.7mn b/d YoY) | Rebound of ~7.5mn b/d | Hormuz exports continue improving |
| Supply balance | ~900,000 b/d deficit | ~4.6mn b/d surplus | No return to full-scale conflict |
| Mideast Gulf exports (June) | 16.1mn b/d | n/a | 8.3mn b/d below February levels |
| Global observed oil stocks | Rose by ~21mn bl in June | n/a | First increase since conflict began |
The June stock build of 21 million barrels marked the first increase in observed global inventories since the war began, driven by higher oil volumes in transit rather than onshore storage additions. The IEA also flagged a notable lag between crude flow recovery and product supply normalisation: key Mideast Gulf refinery loadings had not yet resumed as of the reporting period, and Ukrainian attacks on Russian refining infrastructure were adding secondary tightness to global product markets.
The 2027 surplus projection of 4.6mn b/d is entirely contingent on a single variable: whether Hormuz remains open to commercial traffic without sustained military interference. In addition, WTI and Brent futures have continued to reflect this uncertainty through elevated volatility premiums. The renewed US-Iran exchange that began on 8 July directly tests that assumption.
According to analysis from Forex.com, the crude oil rebound faces tough structural headwinds even as OPEC supply begins to return, reinforcing the conditional nature of any recovery projection.
How Energy-Importing Nations Are Responding
The Hormuz closure has accelerated a structural reassessment among major oil-importing nations about the adequacy of their strategic petroleum reserves and the concentration of their supply chain risk. India's state-owned ONGC announced plans to add approximately 1.75 million tonnes (12.83 million barrels) of strategic petroleum reserve capacity at Mangalore.
This addition would bring total storage capacity in that region to approximately 3.25 million tonnes (23.8 million barrels), sitting above the existing 1.5 million tonne underground cavern managed by India's Strategic Petroleum Reserves facility. ONGC characterised the project as being of national importance and confirmed it would invest its own capital, a departure from the previous model where only state-owned refiners built commercial storage.
Simultaneously, Abu Dhabi's ADNOC is pursuing a doubling of its crude storage footprint in India, targeting up to 4 million tonnes (30 million barrels), building on its existing 2.05 million tonne Indian storage presence that includes facilities at both Mangalore and Padur. The strategic rationale shared by both programmes is explicitly supply-shock driven: New Delhi has been actively working toward building a domestic buffer capable of absorbing at least one month of demand disruption, a direct policy response to the experience of Hormuz's de facto closure.
Scenario Analysis: Three Paths Through to Year-End 2026
Scenario 1: Diplomatic Re-engagement and Gradual Normalisation
A new ceasefire framework is negotiated, with Hormuz traffic progressively recovering toward pre-war volumes through Q3 2026. OPEC+ executes the planned voluntary cut unwinding, with output approaching but not fully recovering to pre-war levels by year-end. A residual deficit of 3 to 4mn b/d persists.
Price implication: Brent crude stabilises in the $60 to $68/bl range as the supply deficit narrows and risk premium compresses.
Scenario 2: Sustained Low-Intensity Conflict With Intermittent Hormuz Disruption
Periodic attacks on commercial shipping continue without escalating to full-scale closure. Producers maintain partial export capability but cannot execute the full quota unwind. The 7mn+ b/d cumulative deficit versus pre-war output persists through most of 2026.
Price implication: Elevated risk premium sustains Brent in the $70 to $80/bl range with significant volatility.
Scenario 3: Full Re-escalation and Extended Hormuz Closure
Active military exchange intensifies, commercial shipping halts through the strait, and production gains achieved in June are partially or fully reversed. The record 8.1mn b/d monthly output decline seen at the conflict's onset could be approached again. The EIA's global oil outlook underscores how quickly supply balances can deteriorate under such conditions.
Price implication: Brent crude spikes toward $90 to $100/bl or above, triggering demand destruction and coordinated emergency strategic petroleum reserve releases.
The market's immediate response to renewed hostilities provided an early indicator of which scenario investors were pricing. Nymex WTI rose by $3.08/bl in a single session following confirmation that the US-Iran ceasefire had ended, settling at $73.52/bl as US forces launched new strikes on Iranian military targets.
The Critical Distinction Markets Must Understand
One of the most important analytical points that tends to get lost in coverage of OPEC+ quota decisions is the three-way distinction between what the alliance announces, what it can physically produce, and what it can actually deliver to market.
- Production ceiling: The agreed maximum the alliance may produce under its quota framework
- Sustainable capacity: The physical maximum achievable given current infrastructure, investment levels, and maintenance status
- Actual market-deliverable output: What producers can realistically export given prevailing geopolitical and logistical conditions at any given moment
In June 2026, OPEC+ members collectively remained approximately 7.14mn b/d below their combined production target despite recording the largest month-on-month output gain since the conflict began. This gap is the defining challenge of the current recovery period, and it exists precisely because the strait converts every barrel production decision into a conditional proposition.
For market participants and energy analysts: The OPEC+ production rebound at risk from renewed war is not simply a news cycle event. It represents a structural stress test of the alliance's capacity to manage supply recovery under conditions of persistent geopolitical uncertainty. The June numbers demonstrated that recovery is physically possible when Hormuz traffic improves. What they could not demonstrate is that such improvements are durable.
The difference between the IEA's projected 2026 supply deficit of approximately 900,000 b/d and its 2027 surplus projection of approximately 4.6mn b/d is not a matter of production capacity or quota strategy. It is a function of whether a 33-kilometre waterway remains navigable for commercial traffic. That is an unusually concentrated geopolitical risk for a market that supplies the energy needs of the global economy.
This article is based on publicly available market data and analytical frameworks. It contains forward-looking projections and scenario analyses that are subject to significant uncertainty. Readers should not interpret any content here as financial or investment advice. All production figures are Argus Media estimates as reported in July 2026. Further market intelligence on OPEC+ production dynamics and Hormuz shipping conditions is available via Argus Media at argusmedia.com.
Want to Stay Ahead of the Next Major Commodity Disruption?
When geopolitical shocks like the Hormuz crisis reshape global energy supply overnight, the investors who act first gain the greatest advantage — Discovery Alert's proprietary Discovery IQ model delivers real-time alerts on significant ASX mineral discoveries, instantly translating complex market signals into actionable opportunities across 30+ commodities. Explore how historic discoveries have generated substantial returns and begin your 14-day free trial at Discovery Alert to ensure you are positioned ahead of the market when the next major opportunity emerges.