August 5, 2026
The Productivity Paradox at the Heart of American Drilling
The relationship between drilling activity and oil production has rarely been more misunderstood. Conventional logic suggests that more rigs equal more barrels, and fewer rigs signal falling output. But the modern US upstream sector has quietly dismantled that assumption over the past decade, engineering a productivity revolution that allows operators to produce record volumes with a fraction of the equipment once required.
Understanding where the US oil and gas rig count stands today, and what it actually signals about the health of the upstream sector, requires looking beyond the headline number.
When big ASX news breaks, our subscribers know first
Understanding the Baker Hughes Rig Count: The Industry's Most-Watched Weekly Indicator
Every Friday at noon Central Time, Baker Hughes releases its weekly US rig count, a dataset compiled continuously since 1944, making it one of the longest-running operational benchmarks in the global energy industry. The report tallies all active drilling rigs engaged in exploring for or developing oil and gas resources across the United States, segmented into three categories:
- Oil rigs: Units actively drilling wells targeting crude oil production
- Gas rigs: Units focused on natural gas formations
- Miscellaneous rigs: A smaller category capturing rigs not clearly classified as oil or gas-directed, often including geothermal or exploratory programmes
The rig count is widely regarded as a leading indicator of future supply trends rather than a lagging one. Because rigs must be deployed months before production begins flowing, changes in the weekly count provide advance warning of supply trajectory shifts. Traders, portfolio managers, oilfield services companies, and government agencies all use the data to calibrate expectations about upstream momentum.
Where Does the US Rig Count Stand Right Now?
Current Weekly Snapshot: Week Ending July 3, 2026
The latest Baker Hughes rig count data reflects a measured but meaningful uptick in US drilling activity across all three rig categories.
| Rig Category | Current Count | Week-on-Week Change | Year-on-Year Change |
|---|---|---|---|
| Oil Rigs | 445 | Flat | +21 |
| Gas Rigs | 126 | Flat | +18 |
| Miscellaneous Rigs | 10 | +1 | — |
| Total US Rig Count | 581 | +1 (net) | +44 |
The total count of 581 active rigs represents a gain of 44 rigs compared to the same period in 2025, a figure that sounds substantial until placed against historical context. The week's marginal net gain was driven entirely by the miscellaneous rig category, while oil and gas rig counts held steady.
Week-on-week stability in oil and gas rigs, combined with a solid year-on-year improvement, paints a picture of gradual re-engagement rather than aggressive expansion. Operators are maintaining existing programmes rather than committing new capital to fresh drilling campaigns.
Is the US Drilling Sector Expanding or Pulling Back?
Decoding the Cautious Posture Among American Drillers
A flat-to-modest rig count trajectory in a week where oil prices remained under pressure tells its own story. WTI crude was trading at approximately $71.26 per barrel and Brent at $75.72 per barrel as of the latest reporting period, levels that are economically viable for most US shale operators but insufficient to trigger aggressive new drilling commitments.
The concept of capital discipline has become the defining characteristic of the modern US shale industry. Following the catastrophic 2020 price collapse and years of investor frustration with cash-burning growth strategies, US exploration and production companies have structurally reorganised their capital allocation frameworks. The primary objectives have shifted decisively:
- Generating free cash flow over volume growth
- Returning capital to shareholders through buybacks and dividends
- Maintaining rig programmes rather than expanding them during price uncertainty
- Prioritising balance sheet strength over production targets
This behavioural shift has a direct suppressive effect on the rig count. Furthermore, even when commodity prices are technically supportive of new drilling, operators are now rewarded by institutional investors for restraint. The feedback loop between shareholder return priorities and drilling budgets has fundamentally altered how the sector responds to price signals. The US drilling activity decline observed in recent periods reflects precisely this structural recalibration.
"When oil prices are in flux and geopolitical risks are elevated, operators tend to maintain existing rig programmes rather than commit to new ones. A flat-to-modest rig count increase in this environment often reflects operational continuity, not strategic acceleration."
How Does US Crude Production Relate to Rig Count Movement?
The Rig-to-Production Lag: Why More Rigs Don't Immediately Mean More Barrels
One of the most misunderstood dynamics in upstream oil markets is the 3 to 6 month lag between rig deployment and first production. A rig begins drilling a wellbore, but that well must then be cased, cemented, and hydraulically fractured before hydrocarbons flow to the surface. This sequential process means today's rig count tells you what production will look like several months from now, not today.
US crude oil production averaged 13.860 million barrels per day during the week ending July 3, 2026, according to the Energy Information Administration. This was up from 13.810 million bpd the prior week and represents a year-on-year increase of approximately 475,000 bpd — a meaningful supply gain achieved despite rig counts sitting well below historical peaks.
The explanation for this apparent contradiction lies in the dramatic efficiency transformation of US shale drilling. However, it is worth examining each factor individually:
- Longer lateral wells: Modern horizontal wells routinely extend 3 to 4 kilometres laterally through the reservoir, dramatically increasing the productive zone accessed by a single wellbore
- Pad drilling: Multiple wells drilled from a single surface location reduce mobilisation costs and accelerate programme execution
- Faster drill times: Technological improvements in drill bits, downhole motors, and real-time data analytics have cut average well spud-to-total-depth times significantly
- Improved completions: Higher proppant loadings and more sophisticated hydraulic fracturing stage designs extract more hydrocarbons per well
The US oil production outlook remains closely tied to how efficiently operators can leverage these technological gains across their active drilling portfolios.
The Role of Frac Spread Activity in Bridging Rigs to Barrels
The Primary Vision Frac Spread Count provides a complementary dataset that sits closer to real-time production signals than the rig count alone. Rather than measuring active drilling, it counts the number of hydraulic fracturing crews completing already-drilled wells.
As of the week ending July 2, 2026, the frac spread count rose by 5 to reach 205 active crews. This figure is significant because well completions are the final step before production begins. A rising frac spread count suggests that the inventory of drilled-but-uncompleted wells (commonly called the DUC inventory) is being drawn down, translating previously deployed drilling capital into near-term production additions.
The relationship between rig count and frac spread activity is therefore critical. A high rig count with low frac spread activity can indicate wells are being drilled faster than they are being completed, building a DUC backlog. Conversely, a stable rig count accompanied by rising frac spread activity — as seen in the current data — suggests the production pipeline is healthy and completions are keeping pace with new drilling.
Which US Basins Are Driving Rig Count Shifts?
Basin-by-Basin Breakdown: Where Drillers Are Adding and Pulling Back
| Basin | Current Rig Count | Week-on-Week Change | Year-on-Year Change |
|---|---|---|---|
| Permian Basin | 256 | -5 | -9 |
| Eagle Ford | 47 | +3 | +6 |
Permian Basin: Still Dominant, But Showing Restraint
The Permian Basin in West Texas and southeastern New Mexico remains by a wide margin the most active drilling region in the United States, accounting for nearly 44% of the total US rig count. Yet the basin shed 5 rigs in the latest reporting week and sits 9 rigs below year-ago levels — a divergence that deserves careful interpretation.
Several structural forces are contributing to Permian restraint:
- Operator consolidation: A wave of mergers and acquisitions among major Permian producers has created larger entities that are inherently more disciplined about capital deployment
- Parent-child well interference: As the basin matures, new wells drilled near existing producers increasingly communicate with legacy wellbores, reducing the productivity of both
- Water management costs: The Permian generates enormous volumes of produced water, and disposal costs have risen materially, adding to well-level economics calculations
- Infrastructure constraints: In certain sub-basins, takeaway capacity limitations periodically constrain the urgency of new drilling
Eagle Ford: A Basin Gaining Relative Momentum
While the Permian pulls back modestly, the Eagle Ford Shale in South Texas is gaining ground. A 3-rig weekly addition and a 6-rig year-on-year improvement signals renewed operator interest in a basin that had been somewhat overshadowed by Permian enthusiasm in recent years.
The Eagle Ford's appeal in the current price environment stems from several factors. Its oil-weighted production profile generates strong near-term cash flow, and its well economics are competitive with Permian locations when water costs and land prices are factored into the comparison. In addition, the basin benefits from mature infrastructure and established midstream relationships, reducing the time and capital required to bring new production online.
The next major ASX story will hit our subscribers first
How Does Market Volatility Shape US Drilling Decisions?
Oil Price Dynamics and Their Influence on Rig Deployment
With WTI hovering near $71/barrel, the current price environment sits above the breakeven thresholds of most major US shale operators, which typically range between $50 and $65 per barrel depending on basin and operator efficiency. Positive economics, however, do not automatically translate into aggressive rig additions.
Geopolitical risk is a compounding factor. Escalating tensions involving the Strait of Hormuz have injected significant uncertainty into near-term price forecasts. When operators cannot confidently predict where prices will be in 12 months, the calculus of committing to a multi-well drilling programme becomes considerably more complex.
The futures curve structure also plays an understated role. When the forward curve is in backwardation — near-term prices higher than future prices — operators who hedge production lock in lower prices for future output, reducing the effective price they receive for new wells drilled today. This dynamic can deter drilling commitments even when spot prices appear supportive.
Monitoring crude oil price trends remains therefore essential for any accurate assessment of where the US rig count is headed in the coming quarters.
Why Capital Discipline Has Replaced the Growth-at-All-Costs Shale Playbook
The 2014 to 2016 downturn and, more decisively, the 2020 collapse permanently restructured how US E&P companies think about capital allocation. Institutional investors, burned by years of value destruction from high-growth, low-return shale strategies, now actively penalise companies that prioritise production volume over cash generation.
"If WTI sustains a move below $65 per barrel, analysts expect many US operators to begin trimming rig programmes within 60 to 90 days — a threshold that could materially alter the second half of 2026 production trajectory."
This investor-driven restraint means the US oil and gas rig count now responds more slowly to price increases than it did during the 2010s shale boom, and responds more quickly to price decreases. The asymmetry has important implications for how global oil markets should model the US supply response function going forward.
What Does a Year-on-Year Rig Count Increase of 44 Actually Mean?
Contextualising the Gain Against Historical Benchmarks
The +44 year-on-year improvement in the total US rig count is genuinely positive, but it must be understood against a dramatically transformed industry baseline. The US is producing more oil than ever before with a fraction of the rigs that were once required.
| Period | Active US Rigs (Approx.) | US Crude Output (Approx.) |
|---|---|---|
| 2014 Peak | ~1,900 | ~9.6 million bpd |
| 2018–2019 Peak | ~1,050 | ~12.9 million bpd |
| 2023 Average | ~625 | ~12.9 million bpd |
| July 2026 | ~581 | ~13.86 million bpd |
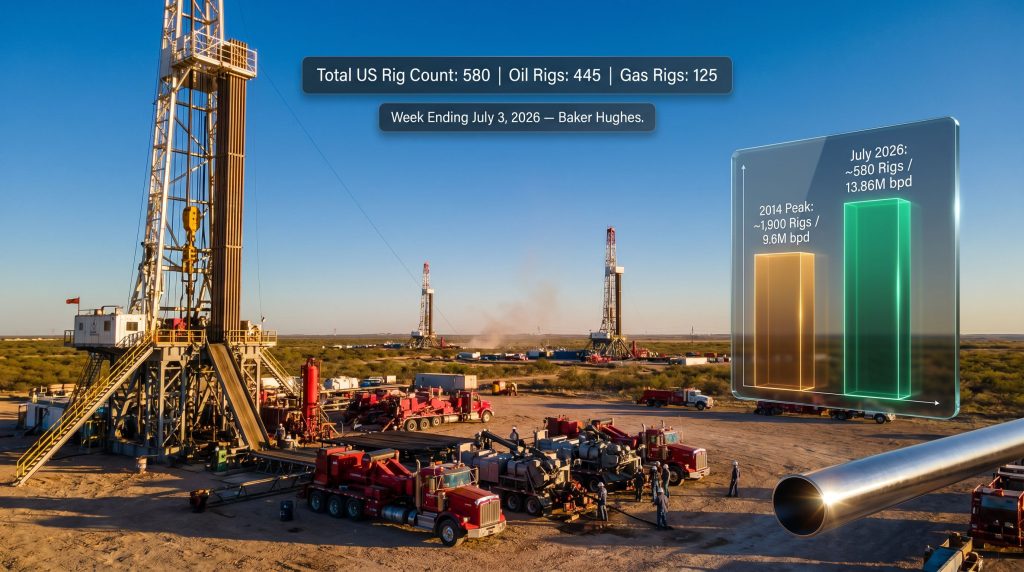
The productivity transformation embedded in these numbers is striking. In 2014, the US required nearly 1,900 active rigs to produce 9.6 million bpd. Today, approximately 581 rigs are sustaining output of 13.86 million bpd — a productivity improvement of roughly 4 to 5 times on a per-rig basis. This is the defining structural story of modern American oil production.
For OPEC's market influence strategists, this creates a persistent challenge. The cartel can influence prices through production management, but the US shale response function has become both more efficient and harder to predict, as capital discipline can delay the rig count response to higher prices even when the economics of new drilling are clearly favourable.
How Does the US Rig Count Compare Internationally?
Global Drilling Context: Where the US Sits in the Worldwide Picture
The United States consistently accounts for the largest share of active land drilling rigs globally, typically representing 40 to 50 percent of the worldwide ex-offshore count. This dominance gives US rig count trends an outsized influence on global oilfield services markets, including equipment availability, day rates, and specialist labour.
When US activity contracts, oilfield services pricing softens globally as equipment migrates to other markets. When it expands, pricing power shifts back to service companies. Canada, the Middle East, and Latin America all compete for the same pool of specialised rigs and crews that US operators draw upon.
A key structural advantage of US shale over conventional projects elsewhere is its short-cycle nature. While a deepwater project in Brazil or a conventional development in the Middle East may require 5 to 10 years from discovery to first production, a US shale well can go from drill decision to flowing hydrocarbons in under 6 months. This responsiveness makes the US the global swing producer of last resort and explains why the weekly rig count remains so closely watched worldwide. Furthermore, LNG demand growth adds another dimension to how global energy markets assess US upstream momentum.
Frequently Asked Questions: US Oil and Gas Rig Count
What is the current US oil and gas rig count?
As of the week ending July 3, 2026, the total active US oil and gas rig count stands at 581 rigs, comprising 445 oil rigs, 126 gas rigs, and 10 miscellaneous rigs, according to Baker Hughes weekly data. Comprehensive US rotary rig metrics alongside historical comparisons are also available through independent financial data providers.
Who publishes the US rig count data?
Baker Hughes, a leading oilfield services company, has published the weekly US rig count report since 1944. Data is released every Friday at noon Central Time and serves as the primary benchmark for upstream drilling activity.
Why did the Permian Basin rig count fall while the total count rose?
The Permian shed 5 rigs in the latest week, reflecting operator caution amid price volatility and capital discipline priorities. Meanwhile, gains in the Eagle Ford and miscellaneous categories offset this decline, resulting in a marginal net positive for the week.
What is a frac spread count and how does it differ from a rig count?
A rig count measures active drilling rigs creating new wellbores. A frac spread count, published by Primary Vision, measures active hydraulic fracturing crews completing already-drilled wells. At 205 active crews, the frac spread count provides a more immediate signal of near-term production additions than the rig count alone.
What oil price level triggers new US drilling activity?
Most US shale operators can generate positive returns at WTI prices between $50 and $65 per barrel, though this varies considerably by basin, operator efficiency, and hedging programme. At current levels near $71 per barrel, the economics support new drilling, but capital discipline and shareholder return priorities mean operators are not aggressively accelerating rig deployment.
What the Rig Count Signals for the Second Half of 2026
Forward-Looking Implications for US Supply and Global Oil Markets
The trajectory of the US oil and gas rig count through the remainder of 2026 will be shaped by several converging variables, none of which are operating in isolation.
Key factors to monitor include:
- WTI price trajectory: A sustained move below $65 per barrel would likely trigger rig count reductions within 60 to 90 days as operators revise capital programmes
- Frac spread trends: Continued growth toward or beyond 210 active crews would support production growth even without rig additions
- Permian Basin operator guidance: Major Permian producers will provide updated capital expenditure guidance in coming quarterly results, which will clarify whether the basin's modest rig reduction is temporary or the beginning of a longer pullback
- EIA weekly production data: Weekly output figures will indicate whether the efficiency gains embedded in current rig programmes are sustaining the production growth observed in early 2026
- OPEC+ production decisions: Any acceleration in OPEC+ output increases would add supply pressure to an already uncertain price environment, potentially accelerating US operator caution
- LNG export demand growth: Rising global LNG demand could provide a tailwind for the gas rig count, which at 126 still has meaningful upside if pricing improves
The broader picture is one of a structurally transformed US upstream sector operating with extraordinary efficiency but governed by capital discipline that limits its responsiveness to short-term price signals. The US oil and gas rig count in mid-2026 tells a story not of an industry in retreat, but of one that has learned to produce more while deploying less — a shift with lasting consequences for global supply forecasts, OPEC+ strategy, and energy market dynamics through the end of the decade.
This article is intended for informational and educational purposes only and does not constitute investment advice. Forecasts, price projections, and production estimates involve inherent uncertainty and should not be relied upon as the basis for investment decisions. Readers are encouraged to consult qualified financial professionals before making any investment-related decisions.
Want to Capitalise on the Next Major Mineral Discovery Before the Broader Market Reacts?
While capital discipline and rig count efficiency are reshaping US oil and gas markets, significant mineral discoveries on the ASX represent a different class of opportunity entirely — and Discovery Alert's proprietary Discovery IQ model delivers real-time alerts the moment those discoveries are announced, turning complex geological data into actionable insights for investors at every experience level. Explore historic examples of exceptional discovery returns and begin your 14-day free trial at Discovery Alert to position yourself ahead of the market.