August 21, 2026
The Structural Forces Reshaping Long-Term Copper Supply
Commodity markets rarely move in straight lines, and copper supply is no exception. Decades of underinvestment in new mine development, combined with accelerating demand from electrification and grid modernisation, have created a structural tension that analysts are increasingly watching across key producing nations. Among those nations, Peru occupies a uniquely consequential position, not just as a current top-three global copper producer, but as the country holding one of the world's most substantial project backlogs waiting to convert from paper to production.
Understanding the Peru mining investment pipeline requires moving beyond the headline numbers. The figures are large, the ambitions are clear, and the commodity fundamentals are supportive, but the distance between announced pipeline value and executed capital is where the real analytical work begins.
When big ASX news breaks, our subscribers know first
How Large Is Peru's Mining Investment Pipeline in 2026?
Breaking Down the $64 Billion Portfolio
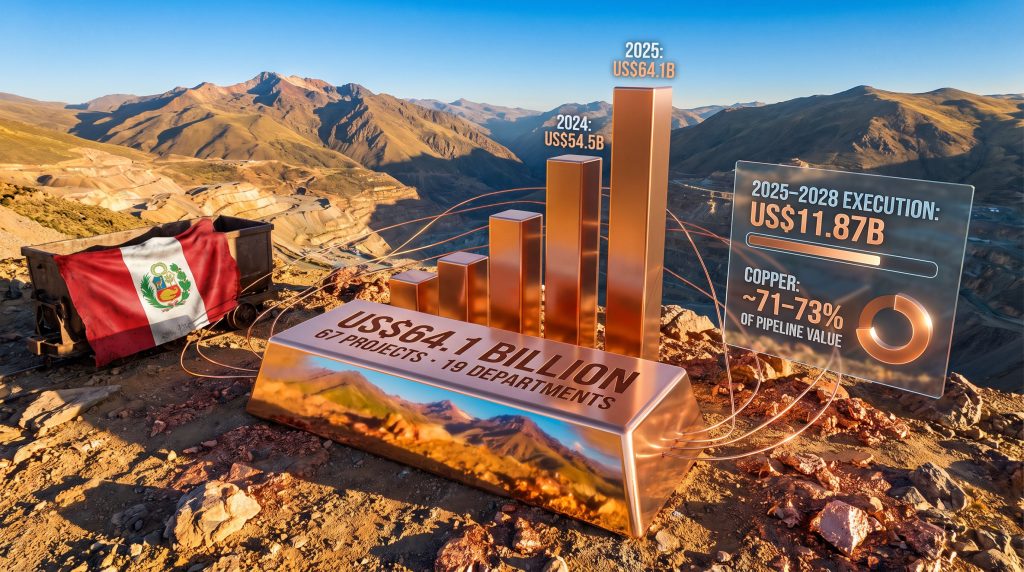
Peru's Ministry of Energy and Mines has published a 2025 project portfolio that lists approximately 67 projects with a combined stated value of US$64.1 billion, distributed across 19 of the country's departments. This figure has attracted significant attention from investors, analysts, and commodity strategists seeking to understand the country's long-term productive capacity.
However, context is essential. The portfolio is not a spending plan. It is a structured inventory of projects at varying stages of development, many of which will not see meaningful capital deployment for years or even decades.
| Metric | Figure |
|---|---|
| Total pipeline value (2025 portfolio) | US$64.1 billion |
| Total projects listed | 67 projects |
| Geographic spread | 19 departments |
| Greenfield projects | 36 |
| Brownfield projects | 31 |
| Near-term execution (2025-2028) | US$11.87 billion |
| Post-2028 pipeline value | Majority of US$64.1 billion |
| 2024 comparison portfolio | US$54.5 billion across 51 projects |
The year-on-year trajectory is notable. In 2024, Peru's published pipeline stood at 51 projects valued at US$54.5 billion. By 2025, the count had grown to 67 projects at US$64.1 billion, representing a material increase in both project volume and aggregate value. A separate EY mining investment guide for Peru cites a figure closer to US$63.0 billion, reflecting ongoing project reclassification as some assets progress through development stages while others are revised or deferred.
What "Pipeline" Actually Means in Practice
One of the most common analytical errors made when evaluating national mining pipelines is treating aggregate project value as equivalent to near-term spending. In Peru's context, the distinction is critical:
- Projects listed in the portfolio span the full development spectrum, from early-stage exploration through to construction and ramp-up
- Inclusion in the official portfolio does not represent a financing commitment, a construction decision, or a regulatory approval
- The critical conversion variables are permitting timelines, community consultation outcomes, commodity price conditions, and available project financing
- Of the total US$64.1 billion pipeline, only approximately US$11.87 billion is projected for execution between 2025 and 2028, meaning roughly 81% of the stated pipeline value is scheduled for post-2028 deployment
This distinction between headline pipeline value and near-term capital deployment is the single most important analytical filter for investors evaluating Peru's mining sector. The US$64 billion figure describes optionality, not imminent activity.
What Commodities Drive Peru's $64 Billion Mining Portfolio?
Copper's Dominant Share
Copper accounts for approximately 71 to 73% of Peru's total mining investment pipeline by value. This concentration is not accidental. Peru's geological endowment, particularly in the southern and central highland regions, is exceptionally well-suited to large-scale porphyry copper deposits, which are the same geological formation that hosts the largest copper mines in Chile and the southwestern United States.
| Commodity | Estimated Share of Pipeline Value |
|---|---|
| Copper | ~71-73% |
| Gold | Secondary contributor |
| Silver | Secondary contributor |
| Zinc, Lead, and Others | Smaller allocations |
Porphyry copper deposits are characterised by large tonnage at relatively low grades, typically ranging from 0.3% to 0.8% copper in proven reserves, but their sheer scale makes them economically viable over multi-decade mine lives. Furthermore, the capital intensity required to develop these deposits is substantial, which explains why greenfield project timelines from discovery to first production routinely extend to 10 to 20 years.
Why Copper Concentration Is a Double-Edged Dynamic
The pipeline's copper weighting creates both strategic alignment and vulnerability:
- Structural demand from electric vehicles (which require approximately 2.5 to 4 times more copper per unit than conventional internal combustion vehicles), grid infrastructure upgrades, and renewable energy systems provides a long-duration demand tailwind
- Data centre construction, driven by artificial intelligence infrastructure investment, is emerging as an additional copper demand driver that was not factored into earlier supply-demand models and is increasingly pressuring existing supply forecasts
- Conversely, any sustained copper price correction would materially affect project financing decisions, potentially pushing already extended greenfield timelines further into the post-2030 window
- High commodity concentration also means that macroeconomic shocks affecting copper demand, such as a sharp slowdown in Chinese industrial activity, would disproportionately affect Peru's pipeline execution rate
Greenfield vs. Brownfield: The Project Mix That Determines Near-Term Spending
The distinction between greenfield and brownfield projects within Peru's portfolio has direct implications for understanding where actual capital spending is occurring in 2026:
- 36 greenfield projects require full environmental impact assessments, indigenous consultation processes, multi-agency regulatory approvals, and often significant enabling infrastructure before construction can begin
- 31 brownfield projects involve expansions or technical optimisations at existing operations, benefiting from established infrastructure, existing community relationships, and prior regulatory approvals that reduce lead times substantially
- In the current 2025-2026 investment environment, brownfield expansions and sustaining capital programs at established operations are driving the majority of actual disbursements
- Most large greenfield copper developments in Peru are realistically targeting first production in the early-to-mid 2030s at the earliest, with several major projects still navigating pre-feasibility and permitting phases
What Is Peru's Regulatory Environment Doing to Unlock the Pipeline?
The Permitting Bottleneck: Where Projects Stall
Peru's regulatory framework for mining approvals involves overlapping jurisdictional layers between national agencies, regional governments, and local authorities. This creates approval processes that have historically extended over multiple years, even for projects with strong environmental credentials and active community engagement programs.
Environmental impact assessments for large-scale mining operations in Peru require review by multiple ministries simultaneously, including the Ministry of Energy and Mines, the Ministry of Environment, and the Ministry of Culture when indigenous consultation is triggered. Each agency operates on its own procedural timeline, and the absence of a unified coordination mechanism has been a persistent source of delay.
The current government has publicly committed to reducing procedural duplication across these agencies while maintaining environmental and social protection standards, a balance that is institutionally difficult to achieve without additional resourcing and coordination infrastructure. Indeed, mining permitting challenges of this nature are not unique to Peru, but their cumulative effect on project timelines is particularly pronounced given the scale of the backlog.
The Government's Role: Framework Provider, Not Capital Deployer
Peru's mining investment strategy rests on a clear division of responsibilities. The state's articulated function is to provide:
- Legal certainty for resource rights and project tenure
- Predictable permitting timelines with clear decision milestones
- Timely inter-agency coordination to reduce procedural delays
- A stable royalty and fiscal framework that allows long-term project economics to be modelled with confidence
Private sector companies are expected to originate, finance, and execute the entire investment pipeline. The government's performance is measured by the quality of the regulatory environment it creates, not by direct capital contribution.
The 240-Project Approval Target: Ambitious Benchmark or Realistic Forecast?
Peru's Prime Minister has stated a target of authorising 240 exploration and extraction projects within a single year, a figure that would represent a substantial acceleration relative to historical permitting throughput.
Several factors determine whether this target is achievable:
- The 240 projects encompass both exploration permits (lower procedural complexity) and extraction authorisations (significantly higher complexity), so the mix matters considerably for feasibility assessment
- Staffing levels and technical capacity within the Ministry of Energy and Mines directly constrain processing throughput
- Digitisation of permitting workflows and inter-agency data sharing could accelerate review timelines if implemented effectively
- Community consultation requirements, particularly under ILO Convention 169 for projects affecting indigenous communities, involve timelines that are determined by community engagement processes rather than administrative targets
The 240-project approval target is best treated as an aspirational policy benchmark that signals administrative intent rather than a guaranteed operational outcome. Analysts should monitor quarterly permitting data to assess whether throughput rates are tracking toward this objective.
How Does Near-Term Spending Compare to the Total Pipeline Value?
The Execution Gap Explained
The most analytically significant feature of the Peru mining investment pipeline is the substantial gap between the headline US$64.1 billion figure and the US$11.87 billion projected for execution during 2025-2028. This gap reflects the genuine early-stage nature of the majority of listed projects, not a data discrepancy.
Investors evaluating exposure to Peru's mining sector should distinguish between three distinct categories of capital:
- Active capital deployment: Brownfield expansions, processing upgrades, and sustaining capex programs at currently producing operations, representing the bulk of 2025-2026 actual spending
- Committed development capital: Projects with approved environmental permits, secured financing arrangements, and active construction programs, a relatively small subset of the total portfolio
- Pipeline optionality: Projects in early feasibility, exploration, or pre-permitting stages that may not enter active development for five to fifteen years, representing the majority of the US$64.1 billion headline figure
What Is Actually Being Built in Peru Right Now?
The 2026 construction and capital spending picture in Peru is characterised by incremental activity rather than transformational new project launches:
- Brownfield expansions at established copper and polymetallic operations are absorbing meaningful capital, particularly in processing throughput increases and tailings management upgrades
- Sustaining capital programs at major producing mines represent a consistent and significant share of annual disbursements
- Several mid-sized gold and silver operations are advancing optimisation projects focused on energy efficiency and recovery rate improvements
- Large greenfield copper projects with production potential measured in hundreds of thousands of tonnes per year remain in permitting or pre-feasibility, with construction timelines realistically extending into the early 2030s
How Does Peru's Pipeline Fit Into the Global Copper Supply Outlook?
Peru's Strategic Position in Global Copper Markets
Peru consistently ranks among the world's top two or three copper producers, a position underpinned by geological endowment that rivals Chile's Atacama region in terms of resource quality and scale. The country's copper reserves support mine life projections that extend well into the second half of this century at existing operations, providing a durable foundation for long-term supply relevance.
A fully executed US$64 billion pipeline would represent a transformational expansion of Peru's copper productive capacity. However, the multi-decade execution timeline means supply impacts will be gradual, with meaningful volume additions from current greenfield projects unlikely to reach markets before the early-to-mid 2030s. Consequently, the copper supply crunch that analysts have been forecasting may intensify before Peru's greenfield projects are capable of delivering relief.
Demand Drivers That Underpin the Long-Term Investment Case
Several converging demand factors strengthen the long-term investment rationale for Peruvian copper development:
- Electric vehicle adoption is accelerating globally, with each battery-electric vehicle requiring approximately 2.5 to 4 times more copper than a conventional petrol or diesel vehicle
- Grid infrastructure upgrades required for renewable energy integration represent a large-scale, sustained demand driver independent of vehicle electrification trends
- Artificial intelligence data centre construction is emerging as a significant and previously underestimated copper demand source, as each large-scale facility requires substantial electrical infrastructure
- Desalination and water infrastructure projects in water-stressed regions are adding a further demand layer that copper supply models developed before 2020 did not adequately incorporate
Geopolitical Positioning: Peru's Asia-Pacific Trade Strategy
Peru maintains open-market trade policy as a stated national priority, and its strategic orientation toward Asia-Pacific markets reflects a deliberate alignment with where the majority of its copper concentrate is consumed. China, Japan, and South Korea collectively represent the dominant destination markets for Peruvian copper exports.
Active work on a free trade agreement with Hong Kong, building on a treaty signed in Lima in 2024 that has not yet entered into force, reflects Peru's ambition to deepen economic integration with Asia-Pacific financial and trading centres. The longer-term strategic objective is to position Peru as a connective hub linking South American resource supply with Asia-Pacific demand, a framing that has geopolitical as well as commercial dimensions.
The next major ASX story will hit our subscribers first
What Are the Key Risks That Could Constrain Pipeline Execution?
Four Dimensions of Execution Risk
1. Permitting and Regulatory Risk
Delays in environmental impact assessment approvals remain the most statistically consistent cause of project timeline slippage in Peru. Political transitions between administrations can alter regulatory interpretation and enforcement priorities mid-process, introducing uncertainty for projects in advanced permitting stages. The current government's reform commitments require institutional embedding to survive electoral cycles.
2. Social License and Community Relations Risk
Peru has experienced significant operational disruptions at mining projects due to community opposition, particularly in highland regions where water rights, agricultural land impacts, and revenue-sharing arrangements are recurring sources of conflict. According to Mining.com, social unrest risks clogging billions of dollars in investment across the country's project pipeline. Projects without robust and genuinely participatory community engagement frameworks face elevated suspension risk regardless of their regulatory approval status.
3. Commodity Price and Financing Risk
Copper price volatility directly affects greenfield project economics and the availability of debt financing. Rising global interest rates over recent years have increased the cost of project financing, compressing returns on capital-intensive developments with long payback periods. Equity capital availability for junior and mid-tier mining companies pursuing Peruvian exploration and development assets has tightened materially in the current market environment.
4. Execution and Infrastructure Risk
Many pipeline projects are located in remote, high-altitude environments requiring significant enabling infrastructure investment in roads, power supply, water management, and worker accommodation. In addition, copper project partnerships between majors and juniors are increasingly being used to share these infrastructure costs and execution risks across the portfolio. Logistics costs in Peru's highland regions add meaningful capital requirements to project budgets that are not always fully reflected in early-stage cost estimates.
Frequently Asked Questions: Peru Mining Investment Pipeline
What is the total value of Peru's mining investment pipeline?
Peru's Ministry of Energy and Mines lists approximately 67 projects with a combined value of US$64.1 billion in its 2025 portfolio, distributed across 19 departments nationally. This figure represents total potential investment across all development stages, not committed near-term spending.
How much of Peru's mining pipeline will be deployed by 2028?
Approximately US$11.87 billion of the total pipeline is projected for execution during the 2025-2028 period. This represents roughly 19% of the headline figure, with the balance extending into post-2028 timelines subject to permitting, financing, and market conditions.
Which commodity dominates Peru's mining investment pipeline?
Copper accounts for approximately 71 to 73% of pipeline value by commodity, reflecting Peru's geological profile and the commodity's centrality to energy transition supply chains.
What is the difference between greenfield and brownfield projects in Peru's pipeline?
The 2025 portfolio includes 36 greenfield developments requiring full permitting and social licensing from scratch, and 31 brownfield projects involving expansions or optimisations at existing operations. Brownfield projects carry substantially lower execution risk and shorter development timelines.
Why is Peru strategically important to global copper supply?
Peru's geological endowment, existing productive capacity, and large project backlog position it as one of a small number of countries capable of contributing meaningfully to global copper supply growth over the next two decades, a period when structural demand from electrification is expected to significantly outpace supply additions from existing mines.
Key Takeaways: Reading Peru's Mining Pipeline as a Long-Duration Investment Signal
The Peru mining investment pipeline is best understood as a long-duration option on copper demand growth rather than a near-term capital event. The analytical framework for evaluating its significance should incorporate several layered perspectives:
- The US$64.1 billion headline figure describes aggregate optionality across a 67-project portfolio at various development stages, with only US$11.87 billion projected for the 2025-2028 execution window
- Copper's 71 to 73% share of pipeline value ties Peru's investment trajectory directly to energy transition demand dynamics, creating strong long-term alignment but also concentrated commodity risk
- Brownfield expansions and sustaining capital programs are driving actual 2026 spending, while large greenfield developments remain in permitting or pre-feasibility
- Permitting reform is the critical conversion variable determining how much of the pipeline transitions from backlog to production, and the 240-project approval target provides a measurable policy benchmark to track
- The pipeline grew from US$54.5 billion across 51 projects in 2024 to US$64.1 billion across 67 projects in 2025, signalling accelerating institutional interest in Peru's resource sector
- Geopolitical alignment with Asia-Pacific copper demand centres strengthens Peru's long-term strategic positioning as a supplier to the world's most copper-intensive manufacturing economies
Investors approaching Peru's mining sector should resist anchoring to the headline pipeline figure and instead focus on the permitting reform trajectory, brownfield capital deployment rates, and the commodity price environment that determines when greenfield optionality converts to committed investment. The pipeline's value is real, but its realisation unfolds across decades, not quarters.
This article is for informational purposes only and does not constitute financial or investment advice. Mining project timelines, capital estimates, and commodity market forecasts involve significant uncertainty and should not be relied upon as the sole basis for investment decisions.
Want to Track the Next Major Copper Discovery Before the Market Does?
Discovery Alert's proprietary Discovery IQ model delivers real-time alerts on significant ASX mineral discoveries, instantly converting complex geological and commodity data into actionable investment insights — particularly relevant as structural copper supply constraints intensify across global markets. Explore how historic mineral discoveries have generated substantial returns on Discovery Alert's dedicated discoveries page, and begin your 14-day free trial today to position yourself ahead of the broader market.