June 27, 2026
The Structural Forces Reshaping a Market the World Cannot Live Without
Few commodity markets reveal the fragility of modern civilisation quite like phosphate. Every kilogram of food protein consumed globally traces back, in some measure, to phosphate's role in soil fertility. Yet unlike oil, which can theoretically be substituted with renewables over time, phosphate has no functional replacement in biological systems. Plants cannot photosynthesize and grow without it. That inescapable biological reality is now colliding with a set of geopolitical, logistical, and geological constraints that are redefining the phosphate market outlook for the decade ahead.
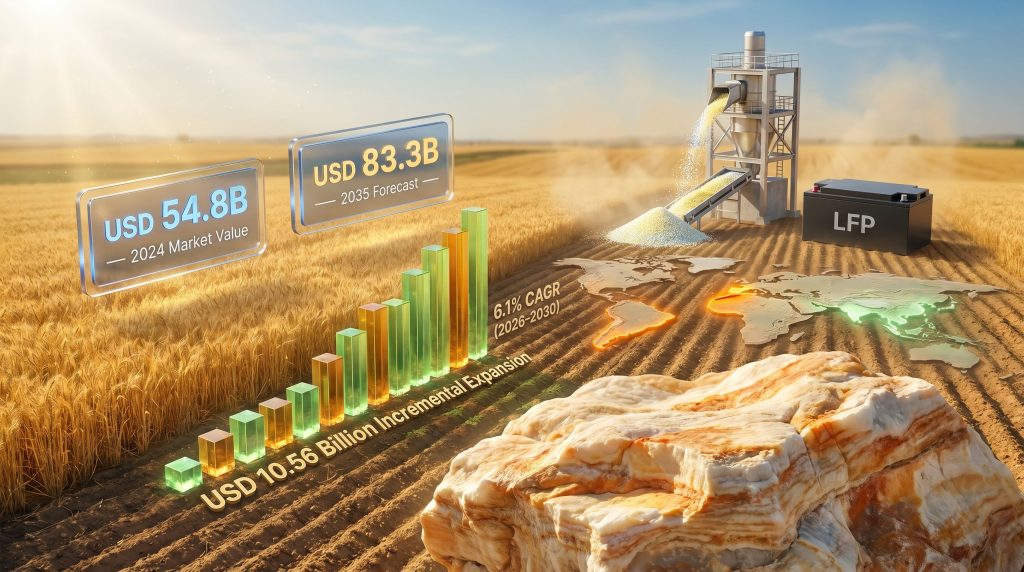
The global phosphate market was valued at approximately USD 54.8 billion in 2024. Projections place it at USD 83.3 billion by 2035, representing a long-term compound annual growth rate of 3.88%. More immediately, the 2026 to 2030 window is forecast to deliver an incremental expansion of USD 10.56 billion at an accelerated CAGR of 6.1%, signalling that the near-term growth trajectory is considerably steeper than the long-run average. These figures are not simply fertilizer market statistics. They represent the converging pressures of population growth, soil degradation, geopolitical disruption, and an emerging battery chemistry demand vector that most conventional agricultural analysts have not yet fully priced into their models.
When big ASX news breaks, our subscribers know first
Agricultural Demand: The Foundation That Never Stops Growing
The agricultural sector absorbs over 190 million metric tonnes of phosphate fertilizers annually, making it the overwhelming driver of global demand. This figure, however, understates the complexity of what is happening beneath the surface of that aggregate number.
In advanced agricultural markets, precision farming technologies are beginning to reduce per-hectare phosphate application rates. Variable-rate spreaders guided by soil mapping algorithms and AI-driven agronomic platforms are allowing farmers to apply phosphate more precisely, reducing waste and input costs. However, this efficiency story in developed markets is being more than offset by a volume story in developing ones. The expansion of cultivated land across Sub-Saharan Africa, Southeast Asia, and parts of South America is adding new demand at a pace that precision agriculture in Iowa or the Netherlands cannot neutralise.
Three structural demand drivers compound this picture:
- Dietary protein transition: As emerging market populations become wealthier, dietary patterns shift toward animal protein. Producing one kilogram of beef requires approximately 7 to 10 kilograms of grain, amplifying phosphate demand per unit of food consumed.
- Soil degradation in emerging markets: Decades of intensive monoculture without adequate nutrient replacement have left large areas of agricultural land in South Asia and Sub-Saharan Africa phosphate-depleted, requiring remediation inputs above baseline maintenance levels.
- Population mathematics: The global population is projected to reach 9.7 billion by 2050 (UN, World Population Prospects 2022), with the vast majority of incremental growth occurring in regions already under nutritional stress.
Regional Growth Architecture: Where the Demand Is Coming From
| Region | Share of Incremental Growth | CAGR (2026-2030) | Primary Demand Drivers |
|---|---|---|---|
| Asia-Pacific | ~57.6% | Highest globally | China, India, Indonesia agricultural expansion |
| North America | Established market | ~5.0% | Soil health programs, replacement demand |
| Latin America | Emerging corridor | Above average | Brazilian soy and corn belt intensification |
| Europe | Mature, constrained | Moderate | Circular economy recovery mandates |
| Middle East and Africa | Supply-side participant | Variable | Domestic use plus export orientation |
Asia-Pacific's dominance is not simply a function of scale. India's government fertilizer subsidy architecture, China's food self-sufficiency policy goals, and Indonesia's rapid agricultural land expansion are all independently powerful demand engines that are unlikely to reverse direction over the forecast period. Furthermore, understanding the distribution of global phosphate reserves adds important context to how regional demand pressures translate into supply risk for import-dependent nations.
Industrial Phosphate: The Demand Vector Most Analysts Underweight
Beyond agriculture, industrial phosphate consumption is growing across several segments that rarely feature in conventional fertilizer market analyses:
- Sodium tripolyphosphate (STPP) in detergent and cleaning product formulations
- Phosphate-based corrosion inhibitors in water treatment infrastructure
- Food-grade phosphate additives in processed meats, dairy products, and beverages
- Lithium iron phosphate (LFP) battery chemistry, where phosphate is a core cathode material for electric vehicle and stationary storage applications
The LFP demand vector deserves particular attention. As EV manufacturers increasingly favour iron-based cathode chemistry over nickel-manganese-cobalt alternatives due to cost, cycle life, and thermal stability advantages, phosphate is being drawn into the energy transition narrative. In addition, battery storage expansion at grid scale is creating a structurally growing demand vector that could become material by the early 2030s.
Supply Concentration: Understanding the Geographic Chokepoint
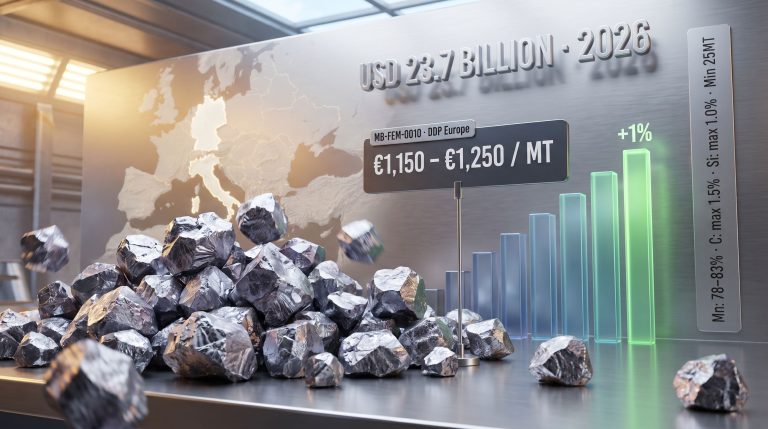
Critical Supply Insight: Morocco's OCP Group controls an estimated 70% or more of the world's economically recoverable phosphate rock reserves. No other agricultural input commodity of comparable global importance is subject to this degree of geographic concentration. For context, Saudi Arabia's share of global oil reserves is approximately 17%. Morocco's position in phosphate is categorically more dominant.
This concentration creates a structural dependency that buyers, governments, and investors must treat as a permanent feature of the landscape, not a transitional condition. The global phosphate supply chain operates across two geographic arcs that industry practitioners refer to as east and west of Suez. Understanding how disruption in either arc propagates through the system is fundamental to interpreting price movements.
West of Suez producers include Morocco's OCP Group, Senegal, and legacy operations in Florida and North Carolina. East of Suez producers include Chinese producers, Saudi Arabia's Ma'aden, Jordan, and Russia's PhosAgro. Each arc serves different regional buyer bases, and disruption in either creates asymmetric price consequences depending on the importing region.
The US Supply Deficit: A Structural Problem With No Quick Fix
Domestic US phosphate production has been declining for decades as Florida's legacy mining districts face progressively tighter environmental constraints. The state's phosphate operations generate phosphogypsum as a byproduct at a ratio of approximately five tonnes per tonne of phosphoric acid produced. This mildly radioactive material must be managed in large surface impoundments called stacks, which are subject to increasingly stringent US Environmental Protection Agency oversight.
Water discharge regulations targeting eutrophication prevention add further compliance cost pressure. Combined, these regulatory dynamics are acting as a soft capacity ceiling on US phosphate production, forcing buyers into spot import markets during periods of global tightness. New project development timelines of 7 to 10 years mean that domestic supply relief is structurally delayed even if investment decisions are made today.
China's Export Policy: The Market's Most Powerful Short-Term Price Lever
China's periodic restrictions on diammonium phosphate (DAP) and monoammonium phosphate (MAP) exports represent arguably the single most powerful short-term variable in global phosphate pricing. When Chinese export volumes are constrained, the global market pivots toward Moroccan OCP, Saudi Ma'aden, and Russian PhosAgro, each of which carries its own logistical and geopolitical complexity.
China's export policy posture in 2025 and into 2026 has maintained a structurally elevated global price environment. The mechanism is relatively simple: China accounts for a significant share of global DAP and MAP production capacity, and when that capacity is redirected toward domestic consumption or held back by export tariffs and licensing restrictions, the global spot market tightens rapidly.
The Multi-Input Cost Stack: Why Phosphate Prices Are More Volatile Than Rock Supply Alone Suggests
Phosphate fertilizer pricing is not determined solely by phosphate rock availability. The production of phosphoric acid, the critical intermediate product, requires substantial sulphuric acid inputs derived from sulphur, alongside ammonia for DAP and MAP synthesis. This creates a multi-input cost stack that amplifies price volatility:
- Natural gas prices drive ammonia synthesis costs, linking phosphate fertilizer pricing to LNG and pipeline gas markets
- Sulphur supply is a byproduct of oil refining, meaning refinery utilisation rates affect phosphate production economics
- Energy costs for the electric arc furnaces and reaction vessels used in wet-process phosphoric acid production vary significantly by region
DAP ex-works production cost differentials between integrated rock-to-fertilizer operations and those relying on purchased rock inputs can be substantial, and the gap has been widening as feedstock access becomes a more pronounced competitive advantage.
The Middle East Conflict and Its Lasting Impact on Trade Flows
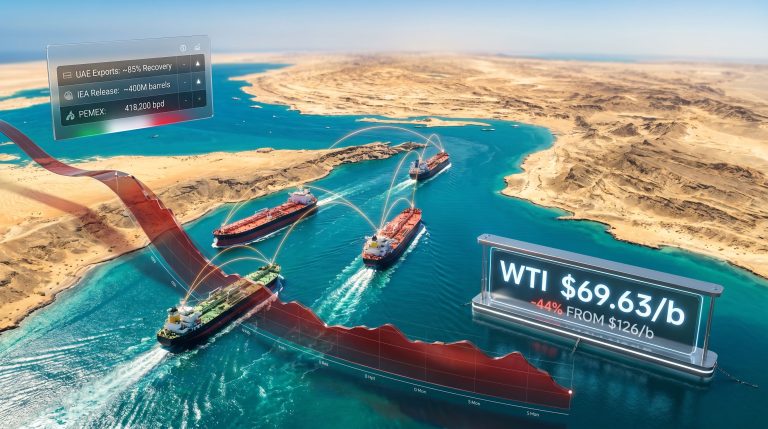
The ongoing Middle East conflict has introduced sustained disruption to Red Sea and Suez Canal shipping lanes, which are the principal arteries connecting North African and Middle Eastern phosphate producers to their Asian and European customer bases. Vessels rerouting around the Cape of Good Hope add approximately 10 to 14 days to voyage times and materially increase freight costs, functioning as a de facto tax on every tonne of phosphate moving through affected trade corridors.
The market response has not been passive. Importers in South and Southeast Asia have accelerated strategic stockbuilding during periods of relative shipping calm, creating demand pull-forward dynamics that distort near-term price signals. This behaviour is rational at the individual buyer level but collectively exacerbates price volatility by compressing demand into narrower windows.
Ceasefire arrangements introduce temporary logistical relief, but the structural uncertainty around route safety has already prompted longer-term procurement strategy changes. Buyers are diversifying supplier relationships and extending contract tenor to reduce spot market exposure. Consequently, this reshaping of procurement architecture is likely to persist regardless of whether the immediate conflict resolves.
Producers west of Suez, particularly Morocco's OCP, have been the primary commercial beneficiaries of this reorientation. Atlantic Basin supply has tightened as buyers seek to bypass Red Sea exposure, widening the price premium for Atlantic cargoes relative to historical norms. Eastern producers face a freight cost disadvantage that partially offsets their competitive production cost advantages during periods of elevated shipping risk.
Price Dynamics: What the Forecast Framework Reveals
Analytical Framing: The most useful lens for evaluating phosphate price trajectories is not absolute price level but the relationship between fertilizer prices and crop commodity prices. The fertilizer-to-crop price ratio determines whether demand destruction is likely to materialise, and where in the global agricultural system it will hit hardest.
Historically, DAP prices exceeding approximately 2.5 times the corn equivalent price have triggered measurable application rate reductions in price-sensitive markets. Affordability stress is most acute among smallholder farmers in Sub-Saharan Africa and South Asia, where credit access is limited and hedging instruments are unavailable. Indeed, high phosphate prices pose serious food security risks for the world's most vulnerable agricultural communities.
Near-Term Price Outlook by Product Segment
| Product | Price Direction (2026-2027) | Key Upside Drivers | Key Downside Risks |
|---|---|---|---|
| DAP (bulk, CFR) | Elevated and volatile | Chinese export restrictions, freight costs | Demand slowdown, logistical stabilisation |
| MAP | Correlated with DAP | Similar supply constraints | Substitution toward urea-based alternatives |
| TSP (triple superphosphate) | Moderate | Niche demand stability | Limited new capacity additions |
| Phosphate rock (benchmark) | Firm | Moroccan pricing discipline | New project commissioning timelines |
| MCP/DCP (industrial grades) | Steady growth | Industrial demand diversification | Regulatory headwinds in detergent markets |
Long-Term Supply Constraints: Separating Genuine Risk From Alarmism
The peak phosphate narrative requires careful handling. Absolute depletion of global phosphate reserves is not an imminent threat. Morocco's OCP holds deposits with reserve lives measurable in centuries at current extraction rates. The genuine long-term supply risk is not exhaustion but rather the combination of geographic concentration, environmental compliance constraints, and the capital intensity of developing new sources in non-traditional jurisdictions.
New phosphate projects in West Africa, Central Asia, and Oceania face development timelines of 7 to 12 years and capital requirements that challenge the economics of all but the highest-grade deposits. Phosphate ore grade matters enormously to project economics. High-grade sedimentary deposits typically grade above 28% P2O5, while lower-grade igneous deposits may require more complex beneficiation to reach marketable concentrate specifications. For instance, the Ammaroo phosphate project in Australia illustrates how high-quality sedimentary deposits in non-traditional jurisdictions are attracting renewed investor attention given prevailing supply dynamics.
This geological quality dimension is frequently underappreciated by generalist investors evaluating phosphate project companies. Not all phosphate rock is interchangeable, and deposit mineralogy, impurity profiles (particularly cadmium and uranium content, which affect regulatory acceptance in European markets), and proximity to sulphuric acid supply all materially affect project bankability.
The next major ASX story will hit our subscribers first
Sustainability Pressures and the Green Phosphate Transition
Producers across the sector are directing growing portions of annual revenue toward lower-carbon fertilizer development pathways, with industry estimates suggesting that leading producers are allocating upward of 5% of annual revenue toward sustainable fertilizer innovation. The EU's Carbon Border Adjustment Mechanism is beginning to create tangible pricing incentives for lower-carbon phosphate inputs entering European markets, accelerating this transition. Furthermore, the broader demand for green transition materials is reshaping how phosphate fits within the global critical minerals agenda.
Phosphate recycling represents a structurally important long-term supply complement. Struvite recovery from wastewater treatment, urban mining from sewage sludge, and phosphate extraction from food processing and animal waste streams are all advancing toward commercial scale, particularly in phosphate-scarce economies such as Japan, the Netherlands, and the Scandinavian nations. While recycled phosphate currently represents a small fraction of primary supply, the regulatory trajectory within the EU's Circular Economy Action Plan is firmly oriented toward closing the phosphorus loop over the coming decades. The Toolse phosphate project in Estonia is one example of how European nations are actively seeking domestic supply solutions in response to these pressures.
Three Scenarios for the Phosphate Market Through 2035
Scenario A: Constrained Supply, Structurally Elevated Prices (Base Case)
Chinese export restrictions persist intermittently, Red Sea disruptions continue through 2026 and beyond, and the market grows to USD 83.3 billion by 2035 at a CAGR of 3.88%. Prices remain elevated, incentivising new project development while compressing margins for import-dependent agricultural economies.
Scenario B: Supply Normalisation, Moderated but Broader Growth
Geopolitical stabilisation restores more normalised trade flows, and new projects in West Africa and Central Asia begin commissioning between 2028 and 2030. Price competition intensifies, but volume growth accelerates as affordability improves. Phosphate recycling begins displacing marginal primary production in European markets.
Scenario C: Demand Acceleration and Strategic Resource Competition
LFP battery chemistry creates a new, structurally growing demand vector. Governments across multiple jurisdictions designate phosphate as a critical mineral, triggering strategic stockpiling programs and supply chain localisation investment. Market value significantly exceeds the base case USD 83.3 billion forecast, and resource nationalism intensifies among the handful of nations controlling world-class reserves. According to phosphate market forecasts, this scenario is increasingly reflected in longer-term industry projections.
| Strategic Theme | Scenario A | Scenario B | Scenario C |
|---|---|---|---|
| Moroccan OCP pricing power | Very High | Moderate | Extreme |
| New project development returns | Attractive | Marginal | Very Attractive |
| Recycling technology investment | Moderate | High | High |
| Food security and affordability risk | Elevated | Managed | Severe in import-dependent nations |
| LFP battery demand contribution | Minimal | Emerging | Transformative |
Key Data Summary: Phosphate Market Outlook
| Metric | Data Point |
|---|---|
| 2024 Market Value | USD 54.8 billion |
| 2035 Market Value (Forecast) | USD 83.3 billion |
| Long-Term CAGR (2024-2035) | 3.88% |
| Short-Term CAGR (2026-2030) | 6.1% |
| Incremental Market Growth (2026-2030) | USD 10.56 billion |
| Annual Agricultural Consumption | 190+ million metric tonnes |
| Asia-Pacific Share of Incremental Growth | ~57.6% |
| Morocco's Share of Global Reserves | ~70%+ |
| Phosphogypsum Generation Ratio | ~5 tonnes per tonne of phosphoric acid |
| Cape of Good Hope Rerouting Time Addition | 10-14 days |
Disclaimer: All market size figures, CAGR projections, and price forecasts referenced in this article are drawn from third-party market research and commodity analysis sources and are provided for informational purposes only. They do not constitute financial advice or investment recommendations. Forecast figures are inherently subject to uncertainty, and actual market outcomes may differ materially from projections. Readers should conduct independent due diligence before making any investment or commercial decisions based on this content.
The phosphate market outlook through 2035 is not a simple fertilizer story. It is the intersection of food security, geopolitical fragility, geological scarcity, environmental regulation, and an emerging clean energy demand vector. Investors and strategists who treat it as a cyclical agricultural commodity risk fundamentally mischaracterising both the opportunity and the systemic exposure embedded in this market.
Want to Catch the Next Major ASX Mineral Discovery Before the Market Moves?
Discovery Alert's proprietary Discovery IQ model delivers real-time alerts on significant ASX mineral discoveries — including emerging opportunities across critical commodities like phosphate — turning complex geological and market data into actionable insights for investors at every level. Explore historic discoveries and the returns they generated, then begin your 14-day free trial to position yourself ahead of the broader market.