June 18, 2026
The Hidden Signal That Commodity Traders Often Miss Before the Big Move
In commodity markets, the most decisive price moves rarely announce themselves in advance. They emerge from periods of apparent stillness, where price action compresses, indicators reset, and the underlying supply-demand balance quietly shifts beneath the surface. Experienced traders understand that sideways price action is not a failure of momentum; it is frequently the market's way of gathering energy for the next leg. This dynamic is central to understanding the platinum and copper consolidation outlook as it stands today.
This dynamic is precisely what is unfolding across platinum and copper markets in mid-June 2026. Both metals are navigating a consolidation phase following significant directional moves, and the platinum and copper consolidation outlook has become one of the more technically and fundamentally rich setups across the entire commodity complex. Understanding the architecture of these pauses, rather than reacting impatiently to the absence of immediate direction, is where genuine analytical advantage lies.
When big ASX news breaks, our subscribers know first
Why Commodity Consolidation Phases Are Structurally Significant
Most market participants focus their analytical energy on breakouts and breakdowns, underweighting the consolidation periods that precede them. This is a systematic error. Consolidation phases perform several critical market functions simultaneously:
- Volatility compression resets momentum oscillators, allowing fresh buy or sell signals to develop from neutral conditions rather than overextended readings
- Institutional positioning shifts occur with less price impact during range-bound conditions, as large participants accumulate or distribute without triggering the momentum-chasing behaviour that accompanies trending markets
- Supply-demand rebalancing happens in real time during consolidation, with physical market participants adjusting inventory levels, refinery throughput, and hedging programmes based on evolving price expectations
- Psychological recalibration among retail and speculative traders occurs as initial excitement from a prior move fades and more patient, conviction-based participants replace momentum-driven positioning
For both platinum and copper, current consolidation is unfolding against a backdrop where bullish technical structures remain largely intact. This is the critical distinction between continuation consolidation, which favours resumption of the prior trend, and reversal consolidation, which signals exhaustion. The evidence across both metals currently points toward the former.
The Dollar as the Master Variable: Understanding DX.F Dynamics
Before examining either metal in isolation, it is essential to frame the macro environment uncertainty that will ultimately determine whether technical breakouts succeed or fail. The U.S. Dollar Index operates as the primary gating variable for commodity price momentum, and its current technical structure carries direct implications for the platinum and copper consolidation outlook.
The DX.F is exhibiting what technical analysts describe as a developing head and shoulders pattern on the daily chart. This is a reversal formation with specific structural requirements: a dominant peak (the head) flanked by two smaller peaks (the shoulders), with a neckline connecting the troughs between them. The pattern is only confirmed when price closes decisively below that neckline, not merely touches it intraday.
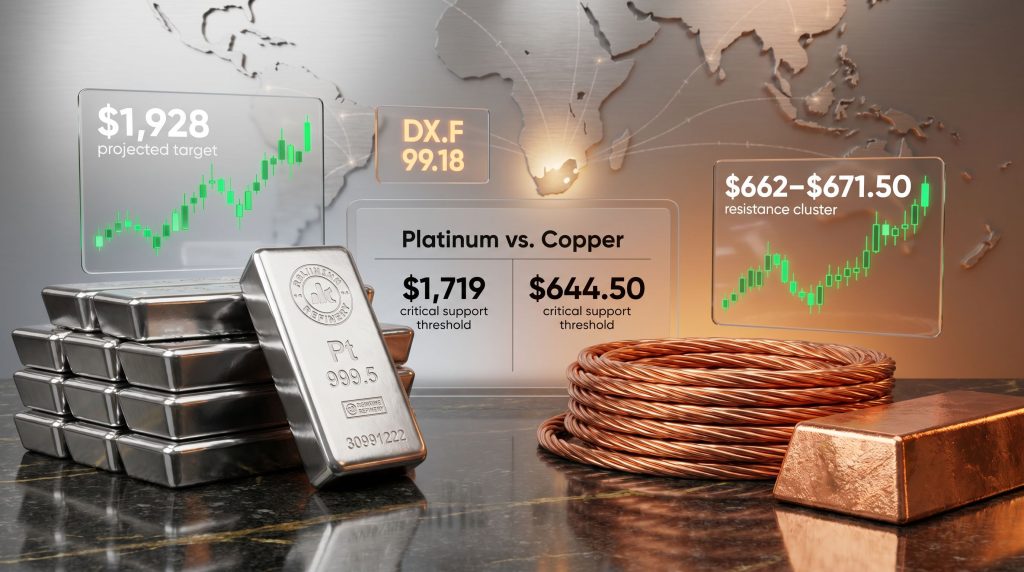
Critical threshold: The neckline on the DX.F currently sits near the 99.18 level. A confirmed daily close below this level would activate the head and shoulders formation and project a minimum downside target toward the 98.00 area. This scenario would provide meaningful macro tailwind for both platinum and copper by reducing the effective cost for non-dollar buyers globally.
Conversely, a sustained break above 99.85 would invalidate the bearish dollar setup and shift macro momentum toward dollar strength, compressing upside potential for metals in the near term. The dollar remains caught between these two levels, producing a macro environment best described as genuinely uncertain rather than directionally clear.
The inverse relationship between the dollar and commodity prices is not a simple or linear one. In practice, a weakening dollar stimulates commodity demand through several concurrent channels: it increases purchasing power for international buyers, reduces the cost of dollar-denominated debt for commodity-producing nations, and historically signals looser global financial conditions that encourage inventory building across industrial supply chains.
Platinum Price Outlook: Supply Deficits, Technical Structure, and the Path to $1,928
The Fundamental Case: Why Platinum's Supply Architecture Matters
Platinum occupies a uniquely constrained position in global commodity markets. Unlike copper, whose supply base spans multiple continents and mining jurisdictions, platinum production is extraordinarily geographically concentrated. South Africa accounts for approximately 70–75% of global annual mine supply, with Russia contributing a further 10–12%. This concentration means that labour disruptions, power constraints, or geopolitical developments affecting a single country can fundamentally alter the global supply picture for an extended period.
The structural supply deficit in platinum markets has persisted across multiple consecutive years. The World Platinum Investment Council has documented that above-ground inventory levels, which act as a buffer between mine supply and fabrication demand, have been declining as the market consistently consumes more platinum than it produces. This is not a temporary imbalance; it reflects a fundamental recalibration in the ratio of available supply to demand. Furthermore, platinum and palladium dynamics reinforce this picture of persistent structural tightness.
Platinum's demand profile is also more diversified than many investors recognise:
- Autocatalysts remain the single largest demand category, with platinum used in catalytic converters for diesel vehicles and increasingly in hybrid powertrains
- Hydrogen fuel cell technology represents the most structurally significant emerging demand driver, with proton exchange membrane fuel cells requiring platinum as a catalyst at both the anode and cathode
- Industrial applications across chemical production, petroleum refining, and electronics manufacturing provide a stable demand floor that is relatively insensitive to short-term economic cycles
- Investment demand, including exchange-traded products and physical bars and coins, adds a discretionary demand layer that can amplify price moves when sentiment turns constructive
What is less commonly understood is that platinum and palladium compete for certain autocatalyst applications, but their interchangeability is technically constrained and involves significant lead times for automotive manufacturers to reformulate catalyst systems. This means that even if palladium prices were to remain elevated, a rapid switch toward platinum substitution in gasoline autocatalysts would unfold over years rather than months, providing a structural demand growth pathway that is largely independent of near-term price dynamics.
Platinum Technical Scenario Framework
The current platinum consolidation is bounded by two clearly defined technical reference points. The lower boundary is the bullish gap established earlier in the trading week, spanning the $1,719–$1,730 range. Bullish gaps on daily charts represent zones where price advanced so quickly that no trading occurred between the closing level of one session and the opening of the next, creating visible spaces on the chart. These gaps function as support during subsequent consolidation because they represent areas where unfilled buy orders tend to cluster.
The upper boundary of the consolidation is defined by the 38.2% Fibonacci retracement level of the decline that began in mid-May. Fibonacci retracements are mathematically derived price levels based on the proportional relationships within the Fibonacci sequence, and the 38.2% level is one of the most commonly tested in commodity markets during consolidation within a broader uptrend.
| Scenario | Trigger | Price Target | Interpretation |
|---|---|---|---|
| Bullish Continuation | Hold above $1,719 + break above upper boundary | ~$1,928 (measured move) | Consolidation confirms as continuation |
| Extended Consolidation | Range-bound between $1,719 and upper boundary | No directional target | Market awaiting macro catalyst |
| Bearish Invalidation | Daily close below $1,719 | Reassess lower support | Bullish gap violated; momentum shifts |
The measured move projection to $1,928 is derived by taking the height of the prior impulsive advance and projecting it from the breakout point of the consolidation formation. This is a standard technical methodology and represents a price objective rather than a guarantee. It is worth noting that this target would represent a significant move from current levels, and such advances typically unfold over multiple sessions with intervening consolidation rather than in a single directional surge.
Longer-term context: Separate analytical frameworks focusing on platinum's macro cycle have identified a prior breakout above approximately $1,015/oz as a meaningful structural milestone, with some medium-term analyses pointing toward a trajectory that targets the 2023 spot price highs near $1,130/oz as an intermediate objective. The convergence of persistent supply deficits and improving technical structure creates what market practitioners refer to as a dual-catalyst environment, historically associated with sustained rather than episodic price appreciation. According to platinum's supply and demand outlook, this structural tightness is expected to persist well into the late 2020s.
Copper Price Outlook: Electrification Demand, Record Territory, and Consolidation Mechanics
Understanding Why Records Create Near-Term Complications
Copper's structural bull case is among the most thoroughly documented in commodity research. The metal sits at the intersection of virtually every major decarbonisation theme: electric vehicles require between 2.5 and 4 times more copper than conventional internal combustion engine vehicles, depending on the model and charging infrastructure specifications. Utility-scale solar installations require approximately 5.5 tonnes of copper per megawatt of capacity. Offshore wind installations are even more copper-intensive, requiring up to 8–10 tonnes per megawatt when accounting for the subsea cabling required to connect turbines to onshore grids.
However, the speed of copper's recent advance toward record territory introduces a dynamic that experienced commodity traders characterise as velocity-induced vulnerability. Markets that advance sharply over a compressed timeframe accumulate what technicians call overhead supply: positions established by participants who entered during the rally and who will sell into any recovery after a pullback, capping upside momentum. This is not a fundamental deterioration; it is a structural feature of how markets digest rapid price appreciation.
TD Securities, in its 2026 copper market outlook, has maintained a constructive view on copper prices while acknowledging that near-term dynamics may be influenced by a normalisation of the front-end tightness that has characterised the market in the first half of the year. The institutional view aligns with a scenario where the copper supply crunch keeps copper structurally elevated while experiencing tactical pullbacks as positioning adjusts.
The Two Bullish Gaps: Technical Architecture in Detail
Copper's current bullish technical case rests on two open gap zones that provide layered support beneath current price levels:
- June 12 gap zone: $627.50–$638.80 — This represents the first and deeper of the two support levels. A retracement to this zone would constitute a more meaningful pullback but would not necessarily damage the medium-term bullish thesis
- Most recent gap zone: $644.50–$651.00 — This is the more immediately relevant floor. As long as daily closes remain above this range, buyers retain technical control and the path toward the resistance cluster remains open
An additional technical positive that deserves attention is the invalidation of an earlier breakdown below a rising support trendline. Breakdown invalidations are among the more powerful short-term bullish signals in technical analysis because they represent a scenario where sellers appeared to gain control, triggered stop-loss orders, and then failed to follow through, leaving short positions exposed and creating forced covering demand as price recovers back above the broken level.
The Resistance Cluster: Understanding the Overhead Challenge
The path higher for copper is not unobstructed. A meaningful resistance cluster exists in the $662–$671.60 range, composed of several overlapping technical elements:
- Recent session highs at $671.60–$669.80 represent areas where sellers were previously active enough to reverse price advances
- A bearish gap from mid-May spanning $667.90–$691.95 creates overhead supply because participants who sold into that gap and subsequently watched price fall may look to exit their remaining positions if price recovers toward their entry levels
- A bearish engulfing candlestick pattern within this zone reinforces the resistance reading, as this candlestick formation reflects sessions where sellers overcame buyers convincingly enough to close below the previous session's open
A confirmed daily close above $671.60 would be required to consider this resistance cluster cleared. Until that occurs, the dominant near-term dynamic is a market testing its range boundaries without conclusive resolution.
Structural Demand Drivers: What the Numbers Reveal
| Demand Sector | Copper Intensity | Growth Trajectory |
|---|---|---|
| Electric Vehicles | 2.5–4x vs. ICE vehicles | Accelerating as EV penetration rises |
| Solar Power | ~5.5 tonnes per MW | Expanding with renewable targets |
| Offshore Wind | 8–10 tonnes per MW | Strong pipeline of new projects |
| Grid Modernisation | Variable; highly significant at scale | Multi-decade replacement cycle |
| Conventional Construction | Stable per-unit intensity | Dependent on macroeconomic conditions |
Supply constraints compound the demand picture. New copper mine development requires 10–15 years from initial discovery through permitting mine development and commissioning to first production. This means that even if mining companies were to dramatically increase exploration and development spending today, the resulting supply additions would not reach the market until the mid-to-late 2030s at the earliest. The structural mismatch between demand growth timelines and supply response timelines is the foundational reason why most institutional analysts maintain constructive multi-year copper price outlooks even when acknowledging near-term tactical risks. In addition, the copper growth drivers tied to electrification and grid modernisation only amplify this long-term supply-demand tension.
Comparing the Two Metals: Where Does the Asymmetric Opportunity Lie?
| Dimension | Platinum | Copper |
|---|---|---|
| Current consolidation type | Post-bullish gap pause | Post-record rally digestion |
| Primary demand growth driver | Hydrogen fuel cells, autocatalysts | Electrification, grid infrastructure |
| Supply constraint | Severe geographic concentration | Long development timelines |
| Immediate upside target | ~$1,928 (measured move) | $662–$671.50 resistance cluster |
| Critical support floor | $1,719–$1,730 (gap zone) | $644.50–$651.00 (gap zone) |
| Position in bull market cycle | Earlier stage; less extended | More extended; record territory |
| Macro sensitivity | Moderate | High (China demand, dollar) |
| Near-term pullback risk | Lower, given less extension | Higher, given record-level proximity |
Platinum's consolidation at a structurally earlier stage of its bull market cycle offers a different risk-reward profile than copper. The supply deficit dynamic provides a fundamental floor that limits downside, while the measured move target of $1,928 represents meaningful upside from the current gap zone. Copper's longer-term opportunity is structurally larger, but the near-term risk of a deeper pullback from record levels is correspondingly greater.
Investor perspective: For participants weighing both metals, the key distinction is time horizon. Copper's thesis is multi-decade and structural; platinum's thesis is also structurally sound but potentially closer to a near-term inflection point given its less extended technical positioning. Neither thesis requires abandoning the other; they serve different roles in a diversified commodity allocation. As noted in reporting on copper's rally, miners are already pricing in improved earnings visibility across both metals.
The next major ASX story will hit our subscribers first
Key Risk Scenarios That Could Alter the Outlook
Dollar Strengthening Above 99.85
A sustained break above 99.85 on the DX.F would shift the macro backdrop against metals broadly. Historically, periods of dollar strengthening compress commodity prices through both the demand channel (higher effective costs for international buyers) and the positioning channel (speculative funds rotate out of commodity-linked assets into dollar-denominated fixed income). Under this scenario, both platinum and copper would face headwinds beyond their individual technical support levels.
Copper Supply Normalisation in H2 2026
Institutional analysis has flagged the possibility that the front-end tightness driving copper's 2026 rally could ease in the second half of the year as inventory hoarding behaviour normalises and some supply disruptions resolve. This would not necessarily invalidate the multi-year bull case but could produce a more significant near-term pullback than the current technical structure anticipates.
Gap Zone Violations
The most immediate and actionable risk for both metals is a confirmed daily close below their respective gap zones:
- Platinum: Daily close below $1,719 undermines the bullish gap structure
- Copper: Daily close below $644.50 shifts near-term momentum bearish and directs attention toward the June 12 gap at $627.50–$638.80
Risk management principle: In consolidation environments, the most common error traders make is reacting to intraday price movements rather than waiting for confirmed daily closes. Intraday violations of support are frequent and often reverse before the session closes. The confirmed daily close is the evidence threshold that matters.
Frequently Asked Questions: Platinum and Copper Consolidation Outlook
What does continuation consolidation mean and why does it matter?
Continuation consolidation describes a sideways price phase that occurs within an established trend, after which price resumes in the original direction. It differs from reversal consolidation, where the sideways phase precedes a trend change. For both platinum and copper, current evidence favours continuation consolidation because bullish technical signals remain active and key support levels are holding.
What is the primary upside target for platinum?
Based on measured move projections from the current consolidation formation, the primary upside target for platinum is approximately $1,928. This target is activated by a confirmed daily close above the upper boundary of the consolidation range, with the $1,719–$1,730 gap zone remaining intact as support.
Why does copper face near-term resistance after a record rally?
Markets that advance sharply accumulate overhead supply in the form of participants looking to exit positions at breakeven or profit targets. The resistance cluster at $662–$671.60 is reinforced by a bearish gap from mid-May and a bearish engulfing candlestick pattern, both of which represent areas where sellers were previously dominant. A confirmed daily close above $671.60 would be required to clear this resistance convincingly. For additional context, analysis of copper soaring to record highs highlights how these breakout dynamics have played out in practice.
How long does it take to develop a new copper mine?
New copper mine development typically requires 10–15 years from initial discovery through environmental assessment, permitting, construction, and commissioning to first production at commercial scale. This extended development timeline is a core structural reason why copper supply cannot respond rapidly to demand surges, supporting the case for structurally elevated prices over the medium to long term.
What is the significance of the DX.F head and shoulders pattern?
The developing head and shoulders pattern on the U.S. Dollar Index daily chart would be confirmed by a daily close below the 99.18 neckline level, projecting a minimum downside target near 98.00. A weaker dollar historically benefits metals prices by reducing effective costs for international buyers and stimulating speculative demand. Until this pattern is either confirmed or invalidated, the platinum and copper consolidation outlook for both metals remains genuinely uncertain from a macro perspective.
What makes platinum's supply so structurally constrained?
Platinum mine supply is concentrated in a single geographic region to a degree that is unusual even by precious metals standards. South Africa accounts for approximately 70–75% of global annual platinum production, creating a situation where localised disruptions, including power supply constraints from Eskom, labour negotiations at major mining operations, and geological challenges in ageing deep-level mines, can materially affect global availability with limited ability for other producing regions to compensate.
Disclaimer: This article is for informational and educational purposes only and does not constitute financial, investment, or trading advice. The technical price levels, targets, and scenarios discussed represent analytical frameworks and should not be relied upon as guarantees of future price performance. Commodity markets involve significant risk, and past technical patterns are not necessarily predictive of future outcomes. Readers should conduct their own research and consult with a qualified financial adviser before making any investment decisions.
Want to Be First to Act on the Next Major Mineral Discovery Tied to Copper or Platinum?
Discovery Alert's proprietary Discovery IQ model delivers real-time notifications on significant ASX mineral discoveries across 30+ commodities — including copper and platinum — cutting through complex data to surface actionable opportunities the moment they emerge. Explore historic discoveries and the returns they generated, then begin your 14-day free trial at Discovery Alert to position yourself ahead of the broader market.