July 14, 2026
The Hidden Mechanics of a Market That Cannot Fix Itself
Most commodity shortfalls are self-correcting. Prices rise, capital flows toward new production, and supply eventually catches up with demand. The platinum market has spent four consecutive years proving that this logic does not always apply. What looks from the outside like an ordinary supply-demand imbalance is, on closer inspection, a structurally locked system where the dominant supplier cannot respond to price signals, the recycling pipeline carries structural limits, and replacement production remains years away from contributing meaningful ounces.
Understanding why the platinum deficit and South African supply decline is deepening requires setting aside the standard commodity framework and examining the geological, operational, and financial mechanics that make platinum supply uniquely inelastic in the current cycle.
When big ASX news breaks, our subscribers know first
Four Years of Deficits Have Fundamentally Changed the Market's Architecture
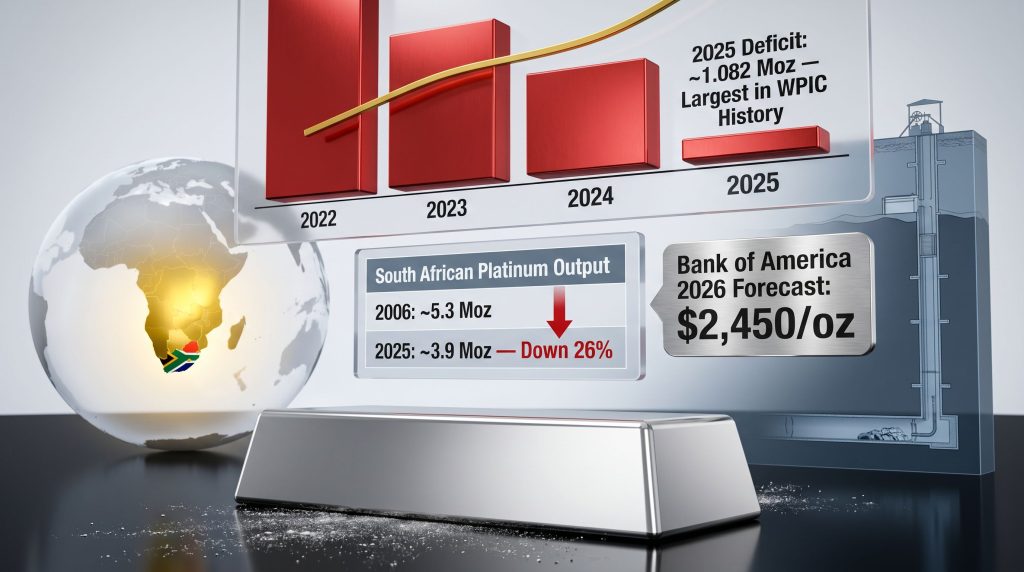
The World Platinum Investment Council confirmed a 1.082 million ounce platinum deficit for 2025, the largest annual shortfall recorded in WPIC data stretching back to 2014. This was not an isolated event. The three preceding years produced deficits of approximately 500,000 ounces in 2022, roughly 896,000 ounces in 2023, and approximately 992,000 ounces in 2024, forming a directional trajectory rather than cyclical noise.
The cumulative effect of four uninterrupted deficit years is the compression of above-ground platinum inventories to approximately four months of demand coverage. That figure carries specific operational significance. Above this threshold, the market absorbs short-cycle disruptions through inventory drawdowns without meaningful price response. Below it, any supply interruption transmits directly into spot price volatility.
The deficit trajectory is illustrated below:
| Year | Estimated Deficit (Moz) | Primary Driver |
|---|---|---|
| 2022 | ~0.50 | Post-COVID demand recovery |
| 2023 | ~0.896 | Mine supply underperformance |
| 2024 | ~0.992 | Sustained output contraction |
| 2025 | ~1.082 | Record shortfall; investment demand surge |
| 2026F | ~0.240 | Recycling offset; primary supply flat |
Source: WPIC Platinum Quarterly
Strong fourth-quarter 2025 investment demand was a significant contributor to the record 2025 shortfall. According to WPIC data, American Platinum Eagle and Canadian Platinum Maple coin volumes reached their highest levels since 2008, while exchange-traded fund flows turned net positive after years of stagnation. These flows entered a market where primary mine supply was already contracting, amplifying the inventory drawdown.
WPIC projects deficits persisting through 2029 at an annual average of 348,000 to 689,000 ounces, with the range narrowing only as recycling capacity expands rather than as primary output recovers. That projection alone contains an important market signal: institutional supply models have stopped expecting primary production growth in any near-term planning horizon. Furthermore, the platinum and palladium market dynamics suggest this structural tightness is unlikely to self-correct without fundamental changes in supply infrastructure.
Why South African Supply Cannot Rescue the Platinum Deficit
The central paradox of the platinum deficit and South African supply decline narrative is geographic. South Africa holds approximately 91% of global platinum reserves and accounts for roughly 70 to 80% of annual mined supply according to WPIC data. No other jurisdiction comes close. Yet national primary output contracted from approximately 5.3 million ounces in 2006 to approximately 3.9 million ounces in 2025, a reduction of roughly 26% sustained across multiple commodity price cycles, including periods when platinum traded above $2,000 per ounce.
Standard commodity theory predicts that sustained price appreciation should generate new supply within two to three production cycles. However, South Africa has consistently defied that prediction. Four compounding structural pressures explain the failure:
1. Electricity Cost Inflation
Electricity tariffs for South African mining operations increased approximately 60% between 2021 and 2026, driven by Eskom's ongoing financial restructuring and grid capacity constraints. Power-related production losses were reported across major shaft complexes throughout 2025 and into 2026, with load-shedding events extending operational downtime in ways that capital investment cannot easily offset. In addition, the renewable energy in mining sector is exploring solutions, but practical implementation at scale remains a longer-term prospect.
2. Diesel Logistics Exposure
Approximately 60% of South Africa's diesel imports transit the Strait of Hormuz. This routing concentration means that haulage, ventilation, and processing costs for deep-level platinum operations move directly with Middle East geopolitical risk, an exposure that intensified after 2022 and has no structural resolution on the horizon.
3. Deep-Level Mining Economics
Unlike near-surface open-pit operations in gold or copper, Bushveld platinum extraction occurs at depths requiring multi-year shaft development programmes. New shaft capital commitments must be financed against an operating cost base already compressed by energy and labour costs, creating a reinvestment trap that persists even at platinum prices above $2,000 per ounce.
4. Labour Cost Inflation and Workforce Complexity
South African PGM operations carry some of the highest labour-to-output ratios in global hard-rock mining. Wage escalation, safety compliance requirements, and community obligations layer additional fixed costs onto a margin structure already strained by energy inflation.
The primary mine production of platinum has been in decline over the last five years. In 2021 it peaked at just over 6 million ounces, and the forecast for the current year is around 5.5 million ounces, all in the context of a metal price that has doubled over the course of the last year. This demonstrates the inelasticity of supply and the difficulty of bringing new metal into the market. Nick Smart, Chief Executive Officer, ValOre Metals (as cited by Crux Investor, May 2026)
That observation from the ValOre Metals CEO captures the essential problem precisely. A doubling of the metal price produced a contraction in output, not an expansion. This is not a temporary mismatch. It is evidence of a supply system constrained by factors that price appreciation alone cannot resolve.
Some industry participants and analysts have begun characterising South Africa's platinum sector as facing a form of structural output ceiling driven not by geology but by the compounding economics of ageing shafts, rising input costs, and the capital intensity of replacement infrastructure. Whether that characterisation ultimately proves accurate, the data trajectory supports treating the South African supply response as effectively absent from near-term market balance calculations.
Price Strength Has Not Generated a Supply Response
The 2025 platinum spot rally delivered approximately 127% price appreciation, with the metal reaching approximately $2,878 per ounce in January 2026 before stabilising near $2,000 per ounce by late April 2026. In most commodity markets, a price move of this magnitude would unlock latent supply within twelve to eighteen months. In platinum, however, total global mine supply contracted 5% year-over-year to approximately 5.51 million ounces, running 10% below the pre-COVID five-year average.
This divergence between price and production is the clearest empirical proof of supply inelasticity available in the modern PGM record. The barriers to South African output growth are structural rather than economic, meaning higher prices are a necessary but entirely insufficient condition for supply recovery.
WPIC's 2026 base case projects total mine supply flat year-over-year. The headline 2% supply increase cited in WPIC commentary is attributable entirely to a projected 10% increase in secondary recycling, not to any primary production expansion:
| Supply Component | 2025 Actual | 2026 WPIC Forecast | Change |
|---|---|---|---|
| Primary mine supply | ~5.51 Moz | Flat | 0% |
| Recycling contribution | ~25% of total | +10% volume increase | ~+0.14 Moz |
| Total supply change | Baseline | +2% headline | Recycling-driven only |
Source: WPIC Platinum Quarterly
Bank of America Global Research responded to this environment by raising its 2026 platinum price forecast to $2,450 per ounce from $1,825 per ounce in January 2026, citing persistent market deficits and supply dislocations from ongoing trade disputes as the primary rationale rather than demand acceleration. The revision signals that institutional price models have stopped waiting for a supply response and are instead pricing for continued structural tightness — a pattern consistent with other supply-constrained precious metals markets in the current cycle.
Why Recycling Cannot Bridge the Gap Alone
Recycling currently provides approximately 25% of total annual platinum supply, predominantly from end-of-life automotive catalytic converters. Even a 10% volume increase in 2026, the WPIC base case assumption, adds only around 140,000 ounces to total supply, leaving the market in deficit by approximately 240,000 ounces for the year.
More importantly, two structural headwinds are compressing the long-run recycling pipeline:
- Lower vehicle scrappage rates as older, high-catalyst-loading vehicles are retained longer in emerging markets, delaying the return of platinum-rich converters to the secondary supply chain
- Reduced PGM loadings on newer-generation catalytic converters, meaning future scrap streams will carry lower platinum content per processed unit even as volumes grow
The combined effect is that recycling growth is a partial offset, not a structural solution. The platinum market's secondary supply ceiling is already visible in WPIC's forecasts, and it falls well short of the ounces needed to eliminate deficits through 2029.
The Replacement Supply Problem: A Development Pipeline Too Thin for the Deficit
The global universe of advanced greenfield PGM projects outside South Africa, Zimbabwe, and Russia is notably narrow. Most economically viable platinum-group resource scale is concentrated within three geological systems:
- Bushveld Igneous Complex, South Africa: approximately 91% of global reserves, output in structural decline
- Great Dyke, Zimbabwe: geopolitically constrained jurisdiction with regulatory and sovereignty risks
- Norilsk Complex, Russia: sanctions-exposed following 2022 geopolitical events, with material supply chain restrictions still in place
The supply concentration risk embedded in this structure is significant. Any disruption in a single jurisdiction carries disproportionate global market consequences, and that risk intensifies as above-ground inventories decline toward the four-month coverage threshold. Consequently, the broader energy transition mineral demand picture further compounds pressure on an already strained supply network.
The Metallurgical Challenge That Delays New Production
A less-discussed barrier to replacement supply is metallurgical. Conventional sulfide flotation, the dominant processing route for fresh Bushveld rock, delivers materially lower recoveries when applied to weathered, oxidised, or chromitite-hosted ores. Many of the near-surface PGM deposits accessible outside South Africa contain exactly these ore types, which standard processing approaches cannot efficiently treat.
Hydrometallurgical routes, including bioleaching and caustic pressure oxidation, have demonstrated meaningful progress at bench scale. Recent testwork on ValOre Metals' Pedra Branca project in Brazil achieved bench-scale recoveries of 72.88% platinum and 74.07% palladium via bioleaching on weathered material, and 66.42% platinum and 78.81% palladium via caustic cracking on chromitite material. These results represent genuine technical progress, but scale-up validation through stirred tank reactors and column leach testing remains the critical bridge between laboratory performance and bankable plant assumptions.
The practical implication is that investors and institutions cannot assign full recovery credit to near-surface oxidised deposits until industrial-scale metallurgical data is available.
How Long Before New Supply Can Reach Market?
Even with metallurgical validation in hand, the timeline from current development stage to first metal production is long. The mining feasibility study timeline adds further complexity to an already extended path to production:
| Development Stage | Typical Timeline to First Metal |
|---|---|
| Bench-scale metallurgy | Current |
| Stirred tank reactor / column testing | 6-18 months post bench |
| Preliminary Economic Assessment | 12-24 months post testwork |
| Feasibility Study | 2-4 years post PEA |
| Permitting and financing | 2-4 years post feasibility |
| Construction and commissioning | 2-3 years |
| Total: PEA to first metal | 5-10 years |
Against WPIC's deficit trajectory of 348,000 to 689,000 ounces annually through 2029, this timeline confirms that the supply gap will widen before new primary production meaningfully contributes, even for developers executing without delay.
The Valuation Disconnect in Development-Stage PGM Equities
Platinum surpassed $2,700 per ounce during the 2025-2026 rally and palladium crossed $2,000 per ounce, yet development-stage PGM equities broadly failed to re-rate proportionally to the underlying commodity appreciation. Three factors sustain the valuation discount:
- Metallurgical complexity: Near-surface oxidised deposits require hydrometallurgical processing validation before institutional capital assigns bankable recovery assumptions, creating an information gap that suppresses valuations
- Financing constraints: Junior PGM developers face capital requirements exceeding typical gold or copper exploration budgets, limiting the available pool of project finance and strategic partners
- Narrow investor familiarity: The PGM developer universe attracts a smaller institutional following than gold or copper, compressing the re-rating mechanism even when commodity fundamentals are supportive
The result is that projects capable of validating scalable metallurgy and producing a credible Preliminary Economic Assessment in this cycle trade at material enterprise-value-per-ounce discounts to peers carrying comparable resource scale.
To illustrate the valuation dispersion in the current market, the following comparison covers active PGM developers as referenced in Crux Investor analysis:
| Developer | Market Capitalisation (approx.) | Notes |
|---|---|---|
| ValOre Metals (Pedra Branca) | ~C$26 million | ~C$12/oz inferred; targeting Q4 2026 PEA |
| Stillwater Critical Minerals | ~C$126 million | Comparable PGM exposure |
| Generation Mining | ~C$236 million | Marathon PGM project, Ontario |
| Platinum Group Metals | ~C$389 million | Waterberg project, South Africa |
| Bravo Mining | ~C$440 million | Luanga PGM+Au project, Brazil |
Source: Crux Investor Analysis, May 2026
The dispersion between these figures suggests that investors are applying substantially different valuation frameworks depending on metallurgical validation status, jurisdiction, and development stage rather than resource scale alone.
The next major ASX story will hit our subscribers first
Energy Transition Is Adding a New Demand Layer
The platinum deficit and South African supply decline is not only a supply story. Demand is diversifying in ways that were largely absent from PGM market models five years ago. Platinum's central role in proton exchange membrane electrolysers and hydrogen fuel cells is introducing industrial demand that competes directly with automotive and investment channels for a supply base that is not growing.
Germany's legislated 2045 hydrogen mandate, alongside broader European and Asian hydrogen infrastructure commitments, is creating forward demand curves that institutional models are beginning to incorporate. This demand diversification is transforming platinum from a single-use autocatalyst metal into a multi-application industrial material with genuine scarcity characteristics, a transition now visible in WPIC inventory data and increasingly reflected in institutional price forecasts.
Disclaimer: This article contains forward-looking statements, price forecasts, and market projections sourced from third-party research including WPIC Platinum Quarterly reports and Bank of America Global Research. These projections involve assumptions and uncertainties that may not prove accurate. This article does not constitute financial advice. Investors should conduct independent research and seek qualified professional advice before making investment decisions. Past commodity price performance is not indicative of future results.
Want to Stay Ahead of the Next Major Mineral Discovery?
Discovery Alert's proprietary Discovery IQ model delivers real-time alerts on significant ASX mineral discoveries, instantly translating complex geological and commodity data into actionable investment insights — no specialist knowledge required. Explore why historic discoveries have generated extraordinary returns on Discovery Alert's dedicated discoveries page, and begin your 14-day free trial today to position yourself ahead of the broader market.