
June 11, 2026
The Commodity Paradox: When Price Signals Stop Working
In most commodity markets, price acts as the ultimate instruction. When the cost of a raw material rises sharply, producers respond by opening new mines, expanding existing operations, and accelerating development timelines. Capital flows toward the opportunity. Supply grows. Prices stabilise. This feedback loop is the foundational assumption of commodity economics.
Platinum has broken that assumption entirely.
Between 2021 and early 2026, platinum prices approximately doubled. Yet primary mine supply moved in the opposite direction. Rather than triggering a wave of new production, higher prices coincided with a measurable contraction in global output. Understanding why this happened, and what it means for the platinum market deficit and low-cost platinum projects, requires looking well beyond the price chart.
When big ASX news breaks, our subscribers know first
Supply Inelasticity: The Structural Feature Defining the Platinum Market
Why Higher Prices Have Not Unlocked New Production
The concept of supply inelasticity refers to a market condition in which production volumes fail to respond meaningfully to price increases. In platinum, this inelasticity is not temporary or cyclical. It is rooted in the physical and economic reality of where and how platinum is mined.
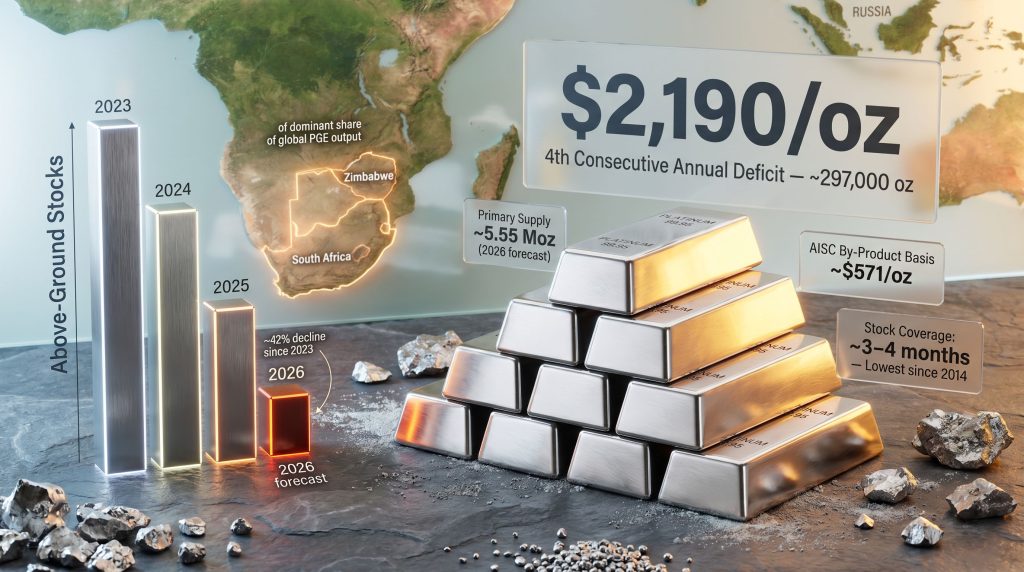
Global platinum mine supply peaked at just over 6 million ounces in 2021. The World Platinum Investment Council (WPIC) forecasts that 2026 primary supply will reach approximately 5.55 million ounces, representing a meaningful contraction from that peak. Over the same period, platinum prices roughly doubled. The inverse relationship between price and output is the defining characteristic of this market cycle.
The core explanation is structural cost escalation. Even as platinum prices rose, operating costs across the dominant producer base rose faster or in parallel, consuming margin gains that would otherwise have funded expansion. The result is a market where higher prices improve the economics of existing operations without generating the surplus capital needed to develop new ones.
Furthermore, understanding the broader platinum and palladium market dynamics helps contextualise why this supply response failure is not isolated to platinum alone but reflects deeper structural pressures across the PGM complex.
"The inelasticity of platinum supply is not a temporary anomaly driven by a single disruption. It reflects the cumulative weight of rising costs, aging infrastructure, and geographic concentration that has built up across decades of deep underground mining in Southern Africa."
The Geographic Concentration Problem
Approximately 80% of global platinum group element (PGE) supply originates from South Africa and Zimbabwe. Russian operations, principally Norilsk Nickel, contribute a further share of global output. This extreme concentration means disruptions in any one of these three regions can have outsized consequences for global availability.
| Supply Region | Estimated Share of Global PGE Output | Key Structural Risk |
|---|---|---|
| South Africa | ~70-75% | Aging deep mines, power and labour cost inflation |
| Zimbabwe (Zimplats) | ~5-8% | Infrastructure constraints, declining Q1 2026 output |
| Russia (Norilsk Nickel) | ~10-12% | Geopolitical risk, reported output decline |
| Rest of World | ~5-10% | Limited scalability |
WPIC data confirmed that both Norilsk Nickel and Zimplats recorded double-digit year-on-year output declines in the first quarter of 2026. This simultaneous contraction across two major producing regions, despite elevated platinum prices, reinforces the case that structural constraints rather than price signals are now driving supply outcomes. In addition, the broader PGM supply constraints facing the industry suggest these pressures are unlikely to ease in the near term.
The All-In Sustaining Cost Problem and Why It Matters
Cost Inflation at Depth
The dominant production model across Southern Africa relies on deep, aging underground mines. These operations are inherently expensive to maintain, and cost pressures have been compounding across three primary categories:
- Labour costs: Wage escalation in South African mining has consistently outpaced headline inflation, driven by union negotiations, skills shortages in specialist underground roles, and rising safety compliance requirements
- Power costs: Electricity supply instability and sustained tariff increases from Eskom have added significant and recurring cost pressure across the South African producer base
- Maintenance and infrastructure reinvestment: Aging shaft systems require increasing capital expenditure simply to sustain current output levels, before any expansion is considered
All-In Sustaining Cost (AISC) is the most comprehensive measure of mining profitability. It captures operating costs, sustaining capital, and corporate overhead, providing a realistic picture of the price required to maintain profitable production. As AISC rises across the incumbent producer base, the platinum price threshold for justifying continued output increases alongside it.
Metals Focus raised its 2026 platinum price forecast to approximately $2,190 per ounce, explicitly citing tightening inventory conditions as a driver. That revision reflects analyst recognition that cost-driven supply constraints are structural, not temporary.
The By-Product Credit Advantage
One of the least understood dynamics in platinum economics is the transformative impact of by-product revenue streams on effective production costs. Operations that generate revenue from chrome, nickel, palladium, rhodium, or gold alongside platinum can apply those revenues as offsets against total production costs, arriving at a net AISC figure that is dramatically lower than standalone platinum operations.
Chrome co-production models, used by certain Southern African operators, can reduce effective platinum AISC to approximately $571 per ounce on a by-product basis. This figure illustrates just how powerfully polymetallic credits can reshape project economics. A standalone platinum mine might require a $1,500 or $1,800 per ounce price environment to remain profitable, while a co-production model achieves comfortable margins at a fraction of that threshold.
This dynamic has direct implications for which new projects are most likely to advance through the development pipeline. The lowest-cost producers globally are almost universally co-production or by-product models, not pure-play platinum mines.
Four Consecutive Annual Deficits: The Inventory Drawdown in Context
Understanding the Structural Deficit
The WPIC projects a 2026 platinum market deficit of approximately 297,000 ounces, which would represent the fourth consecutive annual shortfall. This sustained run of deficits has progressively eroded the above-ground inventory buffers that the market relies on to absorb supply disruptions.
| Year | Annual Balance | Cumulative Impact on Stocks |
|---|---|---|
| 2023 | Deficit | Initial drawdown begins |
| 2024 | Deficit | Stocks fall below long-run average |
| 2025 | Deficit (~692,000 oz to over 1 million oz) | Record shortfall accelerates depletion |
| 2026 (forecast) | Deficit (~297,000 oz) | Coverage falls to approximately 3-4 months (lowest since 2014) |
Above-ground platinum stocks have now fallen by approximately 42% since 2023. Current inventory coverage sits at roughly three to four months of demand, the lowest level recorded since 2014. When a market's buffer stock falls to this level, it becomes acutely sensitive to disruptions. A single major power outage in South Africa, a labour dispute at a key mining complex, or further geopolitical escalation involving Russian supply could tip the market into a more acute supply crisis than the current deficit figures suggest. According to Sprott's platinum market analysis, this structural tightness positions platinum for a potential status upgrade among institutional investors.
The Q1 2026 Surplus: Reading the Signal Correctly
The platinum market recorded a temporary surplus of approximately 268,000 ounces in Q1 2026. At first glance, this appears to contradict the deficit narrative. Examined more closely, however, it confirms it.
The surplus was driven almost entirely by ETF and exchange-stock outflows of roughly 374,000 ounces, the largest single contributor to the quarterly swing. Physical supply did not improve. Industrial demand did not weaken materially. The surplus was a financial market phenomenon driven by investment liquidation, not a sign of improving supply-demand fundamentals. The WPIC's full-year 2026 deficit projection of approximately 297,000 ounces remains intact.
"When inventory drawdowns are driven by investment outflows rather than physical surplus production, the underlying market tightness is being masked rather than resolved. This distinction matters significantly for investors assessing whether current price levels reflect true fundamental value."
Macro Headwinds: How Rising Real Yields Suppress Platinum Prices
The Opportunity Cost Mechanism
Platinum generates no yield or income. Like gold, it is a pure store of value and industrial input. When real interest rates rise, the opportunity cost of holding non-yielding assets increases, and investment demand weakens. This creates a scenario where deteriorating physical fundamentals and improving financial market conditions push prices in opposite directions. The parallels with gold and bond dynamics are instructive here, as both asset classes face similar macro headwinds during rising real yield environments.
In May 2026, the US economy added 172,000 jobs against expectations of approximately 80,000, with prior months revised higher. This stronger-than-expected labour market data pushed Federal Reserve rate expectations in a more hawkish direction, lifting real yields and creating headwinds for platinum prices despite the ongoing physical market deficit.
| Driver | Q1 2026 Direction | Impact on Price |
|---|---|---|
| Physical mine supply | Declining | Bullish long-term |
| Industrial demand | Stable to growing | Neutral to bullish |
| ETF and investment flows | Outflows (~374,000 oz) | Bearish short-term |
| Real yield direction | Rising | Bearish short-term |
| Above-ground inventory | Declining (42% since 2023) | Bullish medium-term |
The divergence between short-term price action and long-term physical fundamentals is precisely the kind of dislocation that creates potential opportunity for investors with longer time horizons and the analytical framework to distinguish between sentiment-driven price moves and genuine fundamental shifts.
What Defines a Low-Cost Platinum Project in This Environment
The Cost Curve as the Primary Screening Tool
When existing producers cannot grow output, the question of which new projects can add supply becomes the central investment question in the platinum market deficit and low-cost platinum projects conversation. Not all projects are created equal. The global platinum cost curve shows significant dispersion between the most and least competitive operations, and the variables that determine a project's position on that curve are well understood by experienced mining analysts.
Key determinants of cost competitiveness include:
- Mining method: Open-pit operations targeting near-surface mineralisation can reduce both upfront capital and ongoing operating costs substantially compared to deep underground shaft development, which can require years of pre-production expenditure before a single ounce is extracted
- Head grade: Higher grams per tonne of PGE directly reduces the amount of rock that must be processed to produce each ounce, lowering unit costs
- By-product and co-product revenue streams: Polymetallic resource profiles that generate chrome, nickel, palladium, rhodium, or gold credits alongside platinum materially reduce net AISC
- Infrastructure proximity: Access to established power, water, road networks, and processing facilities reduces capital requirements and development timelines
- Jurisdictional operating environment: Labour law frameworks, royalty regimes, and permitting timelines vary significantly between jurisdictions and can have a material impact on project economics
Three Tiers of Low-Cost Platinum Exposure
| Tier | Description | Cost Advantage Source | Development Stage |
|---|---|---|---|
| Tier 1: By-product producers | Chrome or nickel operations with PGE credits | By-product offsets reduce AISC to ~$571/oz | Producing |
| Tier 2: Polymetallic developers | Projects with PGE, gold, and base metal resources | Co-product economics reduce standalone cost | Feasibility or Development |
| Tier 3: Near-surface explorers | Open-pittable PGE deposits at shallow depth | Lower capex and opex versus deep underground | Exploration or PEA stage |
Near-surface, open-pittable PGE deposits are relatively rare globally. The majority of known platinum resources are hosted in deep reef systems across Southern Africa, which means projects with shallow mineralisation sit in a genuinely differentiated category on the global cost curve. One example at the exploration stage is ValOre Metals Corp's Pedra Branca project in Brazil, which hosts an NI 43-101 inferred resource of 2.198 million ounces of platinum group elements and gold grading 1.08 grams per tonne across seven near-surface zones.
Because the mineralisation reaches surface, future development could potentially use open-pit mining methods if economic studies support that approach. However, the project has not yet published a Preliminary Economic Assessment or mineral reserves, and the project depends on a leaching process that remains at the laboratory stage, with preliminary recoveries of approximately 74% for platinum and 73% for palladium yet to be demonstrated at larger commercial scale. These remain unproven theses at this stage, not demonstrated economic outcomes.
The next major ASX story will hit our subscribers first
The Catalyst Ladder for Platinum Developers
How Technical Milestones Drive Valuation
For exploration-stage companies, valuation is not static. Each milestone that reduces technical uncertainty can trigger a re-rating, while setbacks can destroy value rapidly. Understanding the sequential logic of the development pathway is essential for positioning within the sector.
- Maiden resource estimate establishes the scale of the opportunity and enables preliminary peer comparison
- Infill and expansion drilling upgrades resource confidence categories and grows the total ounce count
- Preliminary Economic Assessment (PEA) provides first quantified estimates of NPV, IRR, capital expenditure, and AISC
- Metallurgical confirmation at scale validates processing assumptions beyond laboratory results, a critical and frequently underestimated risk in PGE projects
- Environmental Impact Assessment (EIA) initiates the formal permitting pathway and engages community stakeholders
- Pre-Feasibility Study (PFS) refines economics with greater engineering precision
- A definitive feasibility study produces the bankable document required for project financing discussions
- Construction decision and financing represents the final investment decision and the transition from developer to builder
"Investors in exploration-stage PGE companies are underwriting management capability and geological thesis, not demonstrated economic outcomes. Each step on the catalyst ladder reduces technical uncertainty but also introduces new execution risks. Metallurgical performance at scale, permitting timelines, and financing conditions can diverge materially from initial assumptions."
For companies like ValOre, the next major catalyst is a maiden PEA targeted for the fourth quarter of 2026, which will provide the first published estimates of project economics. An Environmental Impact Assessment is expected to follow in early 2027. Until those numbers are published and independently reviewed, the low-cost, open-pit thesis is precisely that: a thesis.
How Investors Are Valuing Platinum Developers
Enterprise Value Per Ounce as the Comparative Benchmark
Pre-production resource companies are commonly benchmarked using enterprise value (EV) per ounce of in-ground resource. This metric allows comparison across projects of different sizes, grades, and development stages. Large disparities in EV per ounce between comparable projects can signal either genuine quality differences or potential market mispricing, though distinguishing between the two requires careful due diligence.
Development-stage peers including Stillwater Critical Minerals and Generation Mining have, at certain points, traded at higher valuations despite reporting similar resource sizes and in some cases lower grades than earlier-stage peers. Ivanhoe's Platreef remains one of the few genuinely new greenfield PGE mines commissioned since 2019, illustrating just how thin the global pipeline of near-term new supply actually is.
Investors typically assign higher valuations to projects demonstrating:
- Higher resource grades expressed in grams per tonne of PGE
- Advanced economic studies including PEA, PFS, or feasibility level work
- Favourable mining method with open-pit preferred over deep underground
- Polymetallic resource profiles with multiple revenue stream potential
- Progress through formal permitting processes including community agreements
- Proximity to existing infrastructure reducing capital intensity
Furthermore, understanding cut-off grade economics is essential when evaluating how resource estimates are constructed, as different cut-off assumptions can materially alter the apparent size and quality of a platinum deposit.
Key Risks and Market Monitoring Framework
Variables That Could Alter the Deficit Outlook
The platinum market deficit thesis is not unconditional. Several variables could tighten or partially offset the structural imbalance:
- Recycling growth: Platinum recycling from autocatalysts and industrial applications represents a meaningful secondary supply source. Accelerating recovery rates could partially offset primary mine shortfalls
- Battery electric vehicle adoption: Ongoing BEV penetration reduces autocatalyst demand, while hydrogen fuel cell vehicle growth represents a potential new demand vector pulling in the opposite direction. The CME Group's analysis of hydrogen economy impacts highlights how this transition could materially reshape platinum demand over the medium term
- New mine commissioning: The Platreef development is among the very few greenfield PGE operations that have advanced to production in recent years, and the broader pipeline of near-term supply additions is genuinely thin
- Geopolitical disruption: With three countries controlling the vast majority of global PGE output, supply security risk is structurally elevated and could accelerate deficit conditions if disruptions coincide
Key Metrics to Track
| Indicator | Current Status (2026) | Bullish Threshold | Bearish Signal |
|---|---|---|---|
| Annual supply-demand balance | Deficit ~297,000 oz | Deficit widens beyond 400,000 oz | Surplus emerges |
| Above-ground stock coverage | ~3-4 months (lowest since 2014) | Falls below 3 months | Recovers above 6 months |
| Primary mine supply | ~5.55 Moz (below 2021 peak) | Continued contraction | New supply exceeds 6 Moz |
| Metals Focus price forecast | ~$2,190/oz for 2026 | Upgrades above $2,500 | Downgrades below $1,800 |
| ETF and investment flows | Net outflows in Q1 2026 | Sustained net inflows | Accelerating outflows |
| Real yield direction | Rising (hawkish Fed) | Real yields peak and decline | Further real yield increases |
Consequently, monitoring the platinum market deficit and low-cost platinum projects as a combined framework provides the most complete picture of where genuine investment opportunity may reside within the PGM sector over the medium term.
Disclaimer: This article is intended for informational purposes only and does not constitute financial advice. Forecasts, price projections, and resource estimates referenced in this article are sourced from third-party organisations including the World Platinum Investment Council and Metals Focus. Forward-looking statements involve inherent uncertainty. Readers should conduct their own due diligence before making any investment decisions. Exploration-stage mining companies carry elevated risk, including metallurgical, permitting, financing, and execution risks that can materially affect project outcomes.
Want To Identify The Next Major Mineral Discovery Before The Market Does?
Discovery Alert's proprietary Discovery IQ model delivers real-time alerts on significant ASX mineral discoveries, instantly translating complex data across 30+ commodities into actionable insights for both short-term traders and long-term investors. Explore Discovery Alert's dedicated discoveries page to understand how historic mineral discoveries have generated exceptional market returns, and begin your 14-day free trial today to position yourself ahead of the broader market.