
June 11, 2026
The Structural Forces Rewriting the US Natural Gas Investment Thesis
Global energy markets periodically enter cycles where multiple independent demand and supply variables collide simultaneously, creating conditions that are far more durable than any single catalyst could produce on its own. That convergence is unfolding right now across US natural gas. Iran war disruptions and AI power demand driving US natural gas investment represent two structurally unrelated forces — one rooted in Middle East geopolitics and the other in the computational demands of artificial intelligence — arriving at the same inflection point simultaneously. For investors tracking where large-scale capital is likely to flow over the next three to five years, understanding how these forces interact is essential.
When big ASX news breaks, our subscribers know first
How Hormuz Threat Mechanics Drive Global Energy Repricing
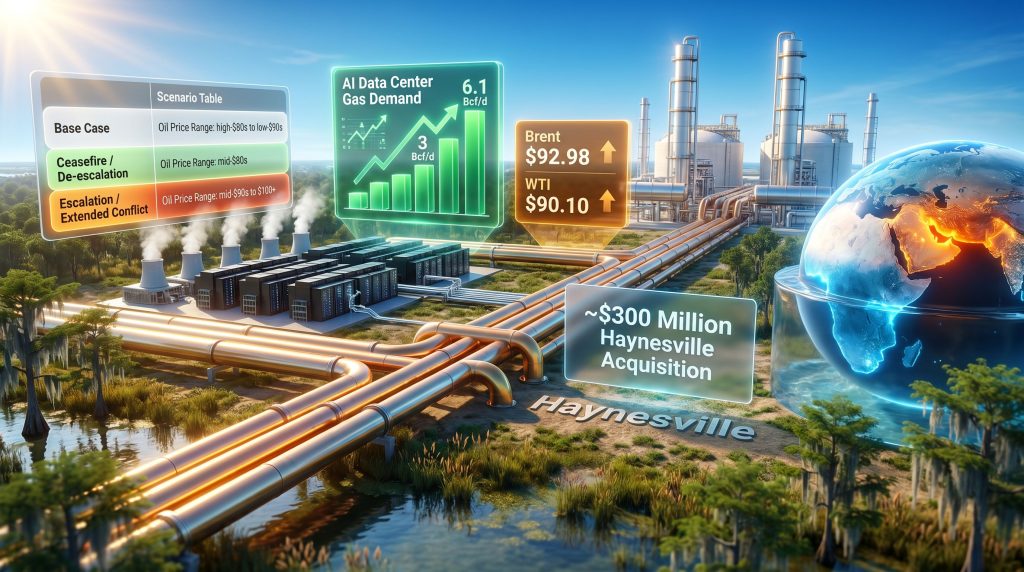
The Strait of Hormuz as a Systemic Chokepoint
The Strait of Hormuz is not just a shipping lane. It functions as a pressure valve for the entire global seaborne energy system. Roughly 20% of all traded oil and a significant share of global LNG passes through this 33-kilometre-wide corridor daily. When any credible threat to that corridor emerges, the repricing of energy commodities is not episodic. It is structural, and it embeds a geopolitical risk premium into benchmarks that persists long after the immediate headline fades.
Furthermore, following Iran's announcement that it was considering closure of the strait, Brent crude climbed to $92.98 per barrel while WTI reached $90.10 per barrel. Both benchmarks partially retreated after the US military stated that commercial transit through the waterway was continuing. However, the critical point for investors is not the intraday movement — it is that the market required a direct military reassurance to reverse the premium, which itself confirms how deeply conflict risk is now embedded in oil price formation.
US Crude Inventory Depletion: Reading the Numbers Carefully
The weekly EIA inventory data released for the period ending June 5, 2026 told a story that went well beyond the headline figure.
| Metric | Value |
|---|---|
| EIA Crude Draw (Week Ending June 5, 2026) | 7.2 million barrels |
| US Crude Inventory Level Post-Draw | 426.5 million barrels |
| Consensus Analyst Forecast | ~4 million barrel draw |
| Cumulative Inventory + Reserve Decline Since Feb 28 | 79 million barrels |
The 7.2 million barrel draw arrived at nearly double the consensus expectation of 4 million barrels, a miss that signals either demand running far hotter than models anticipated, supply constraint, or a combination of both. Neither interpretation is benign for the supply outlook.
The more important number, however, is the cumulative figure. A 79 million barrel decline in US crude stocks and strategic reserves since late February 2026 represents a structural erosion of the buffer capacity that markets rely on to absorb shocks. ING analysts have flagged that continued Gulf export disruptions could keep oil prices elevated well into Q3 2026. Consequently, even a clean ceasefire tomorrow does not rebuild that buffer quickly. Under normalised market conditions, restoring an inventory deficit of this magnitude typically requires six to twelve months of sustained production increases and reduced export volumes.
A conflict-driven supply disruption is fundamentally different from a policy-driven one. OPEC quota cuts can be reversed with a single ministerial decision. Conflict-related export losses depend on a geopolitical resolution that no analyst can time with confidence. That uncertainty is what sustains elevated price floors even when headlines suggest de-escalation.
OPEC at a Twenty-Year Output Low: Why This Matters Differently
Supply Constraint That Cannot Be Policy-Reversed
OPEC market influence extended to a new extreme when production fell to its lowest level since 2000 in May 2026. Critically, this was not the result of a coordinated production cut agreement among member states. It was the consequence of conflict-related export disruptions across Gulf producers — a distinction that has profound implications for how quickly supply can recover.
When OPEC reduces output through deliberate quota management, member states retain the infrastructure, workforce, and operational readiness to reverse those cuts rapidly. Conflict-driven losses are different. Production facilities may be damaged, export terminals may be offline, and shipping insurance costs may make resumed exports uneconomic even after a ceasefire. The recovery curve is longer, less predictable, and harder to model.
Indian refiners, among the largest consumers of Gulf crude, have secured alternative supply commitments from ADNOC through at least August 2026. This reduces near-term spot market pressure but does nothing to expand global production capacity or rebuild the strategic buffers that have been depleted since February.
Why Iran-Linked LNG Disruptions Are Accelerating US Export Infrastructure Investment
Qatar's Vulnerability and the Repricing of LNG Supply Security
Qatar sits among the world's largest LNG exporters, and its infrastructure carries significant weight in supply chains feeding both Asian and European buyers. Attacks on Qatari energy infrastructure during the Iran conflict forced production shutdowns and disrupted flows through Gulf transit corridors. For buyers in Japan, South Korea, and Europe who depend on predictable LNG delivery schedules, this was not a theoretical risk scenario — it was a live supply shock.
The practical consequence is a meaningful repricing of what market participants are willing to pay for supply chain certainty. Non-Middle Eastern LNG, and US-sourced supply in particular, has gained a strategic premium that did not exist twelve months ago. The global LNG supply outlook has shifted materially, and this is visible not just in spot market pricing but in the willingness of buyers and project financiers to commit to long-term offtake contracts with US producers. For a broader view of how these dynamics are reshaping energy flows, analysis of global LNG disruption risks provides useful context on the structural implications.
The Haynesville Basin: Geography as Competitive Advantage
Commodity trading house Gunvor's financing of Western Natural Resources' approximately $300 million acquisition of Haynesville shale assets in Louisiana is the most concrete expression of this thesis in recent months. The transaction was made explicitly with reference to two demand drivers: AI-related domestic power consumption and the post-Iran-war interest in non-Middle Eastern energy supply.
What makes the Haynesville Basin uniquely well-positioned is simple geography. Sitting in northwestern Louisiana, the basin has direct pipeline connectivity to the Gulf Coast LNG export terminal complex, the largest concentration of US LNG export capacity in the world. Producers here can serve both domestic power generators responding to AI-driven electricity demand and international buyers seeking supply chain diversification.
Western Natural Resources is reportedly pursuing additional Gulf Coast-linked gas acquisitions, which suggests this transaction represents a platform-building strategy rather than an opportunistic one-off trade. Institutional capital does not commit $300 million to a thesis it expects to unwind in eighteen months.
AI Infrastructure and the New Baseload Reality for US Power Grids
Why AI Data Centres Demand Dispatchable Generation
Understanding why Iran war disruptions and AI power demand are driving US natural gas investment requires a clear picture of how AI infrastructure actually consumes electricity. The profile is fundamentally different from traditional computing or consumer internet infrastructure.
Large language model training and inference workloads operate at near-continuous utilisation rates. A hyperscale AI data centre does not have a peak-hour surge and an overnight trough the way a residential grid connection does. It runs at close to full capacity around the clock, creating what grid operators describe as a baseload-equivalent demand profile.
This characteristic is what disqualifies solar and wind as primary power sources for AI infrastructure without large-scale storage backup. Solar generation follows a daily curve tied to sunlight hours. Wind is variable by definition. Neither aligns with the flat, continuous draw that hyperscale data centres require. Gas-fired generation, by contrast, offers:
- Full dispatchability on demand
- Scalable output that can ramp up or down to match grid needs
- Geographic flexibility to be sited near load centres
- Established supply chain and operational reliability at scale
Quantifying the Gas Demand Uplift
The range of estimates for AI-driven incremental gas demand through 2030 is wide, reflecting genuine uncertainty about build rates and grid interconnection timelines. However, the direction of travel is not in dispute.
| Scenario | Estimated Incremental US Gas Demand by 2030 |
|---|---|
| Conservative | ~3 Bcf/d |
| Mid-Range | ~6.1 Bcf/d |
| High-Growth | Equivalent to 10-15% increase in total US gas production |
Even at the conservative end, 3 billion cubic feet per day of incremental demand represents a material structural shift for producers, pipeline operators, and midstream infrastructure. The natural gas price forecast suggests the key variable is not whether AI drives gas consumption higher — analysts across the sector broadly agree it will — but rather how quickly data centres can actually connect to the grid, which brings the regulatory picture into direct focus. In addition, the intersection of AI growth and energy constraints is examined in detail through research on war in Iran and AI energy demand, which highlights why this dynamic is drawing increasing attention from both technology and energy investors.
FERC's Grid Fast-Track: The Regulatory Catalyst Compressing Timelines
What the PJM Expedited Interconnection Approval Actually Means
The Federal Energy Regulatory Commission approved PJM's expedited interconnection framework on June 10, 2026, effective July 31, 2026 through 2027. The programme allows up to 10 large generation projects annually to secure grid connection agreements within 10 months and achieve commercial operation within three years.
To appreciate why this matters, context on historical interconnection timelines is essential. Under standard PJM processes, a new generation project could expect to wait five to seven years from application to commercial operation. The combination of queue backlogs, study requirements, and transmission upgrade obligations created a development timeline that made project finance extremely challenging. Investors faced years of carrying costs and regulatory uncertainty before a single megawatt reached the grid.
The expedited process collapses that window into a commercially actionable timeframe. This has two cascading effects:
- It reduces the risk premium investors attach to new gas-fired generation projects, improving returns on project finance
- It aligns the timeline for new capacity coming online with the period when AI-driven power demand is projected to peak
Projects that receive expedited interconnection approval before the end of 2027 could realistically be generating power — and consuming gas — by 2029 to 2030.
Investors monitoring PJM interconnection applications filed after July 31, 2026 will gain early visibility into where new gas-fired generation capacity is being planned. These filings are public documents and may serve as a leading indicator of where incremental gas demand will concentrate between 2027 and 2030.
The 2027 Convergence and Why Timing Matters
Three independent developments are aligning around 2027 in a way that no single one of them could produce independently:
- FERC and PJM expedited interconnection projects entering commercial service
- New US LNG export capacity coming online along the Gulf Coast
- AI data centre build-out reaching a scale where gas consumption becomes measurable in EIA monthly data
A fourth element adds further context. The UAE's planned West-East pipeline expansion, designed to route oil exports from the Gulf to the Indian Ocean coast and thereby bypass the Strait of Hormuz, signals that even Middle Eastern producers are investing to reduce their own exposure to the chokepoint. That infrastructure decision from within the Gulf region is perhaps the clearest confirmation available that Hormuz disruption risk is not being treated as a temporary anomaly by the parties who know the market best.
The next major ASX story will hit our subscribers first
Scenario Analysis: Mapping the Investment Paths Forward
Three Pathways for US Natural Gas Capital Returns
| Scenario | Oil Price Range | Primary Gas Demand Driver | Investment Implication |
|---|---|---|---|
| Base Case | Brent high-$80s to mid-$90s | AI buildout + Hormuz disruption persists through Q3 | Haynesville producers with LNG-linked contracts benefit most |
| Ceasefire / De-escalation | Brent retreats to low-$80s | AI demand continues; inventory rebuild takes 6-12 months | Near-term price relief limited; structural gas thesis remains intact |
| Escalation / Extended Conflict | Brent above $95 | LNG spot premiums surge; US export capacity fully bid | Accelerated final investment decisions on US LNG projects; Haynesville land values rise |
Which Asset Categories Are Best Positioned
The convergence of Iran war disruptions and AI power demand channelling capital into US natural gas investment is not uniform across the sector. The assets with the strongest exposure to both tailwinds share specific characteristics:
- Haynesville Basin producers with existing Gulf Coast pipeline access and LNG offtake agreements or near-term offtake optionality
- Gas-fired power developers pursuing PJM expedited interconnection applications in the July 2026 to 2027 window
- Midstream operators with corridor capacity linking Appalachian and Gulf Coast supply to data centre load concentrations in Northern Virginia, Texas, and Georgia
Risk Factors That Could Disrupt the Thesis
No investment thesis is complete without a serious examination of what could go wrong. The oil market trade risks that emerged earlier in 2025 serve as a useful reminder of how quickly external variables can reshape commodity pricing. Furthermore, the key variables to monitor include:
- Ceasefire speed and completeness: A rapid, durable resolution to the Iran conflict would reduce the geopolitical risk premium in oil and LNG prices, though the 79 million barrel inventory deficit provides a structural floor that limits how far prices can fall in the near term
- AI demand translation lag: There is a meaningful gap between data centre construction announcements and actual grid connections. The gas demand uplift may arrive later than equity markets are currently pricing
- Regulatory reversal risk: Any modification to FERC's expedited interconnection framework or changes to PJM's implementation of the programme could slow the pace of gas-fired generation approvals
- LNG oversupply timing: If multiple US LNG export projects reach final investment decisions simultaneously and global demand growth moderates in the late 2020s, export economics could compress materially
Frequently Asked Questions
Why are Iran war disruptions relevant to US natural gas investment?
Conflict in the Middle East restricts LNG supply from Qatar and threatens oil flows through the Strait of Hormuz, which tightens global energy markets and elevates the strategic value that buyers and financiers assign to US-sourced LNG. This improves economics for US gas projects and accelerates the willingness of international buyers to commit to long-term supply contracts with Gulf Coast exporters. Oil's role in markets means these disruptions carry consequences well beyond the energy sector itself.
How much additional gas demand could AI data centres generate by 2030?
Estimates range from approximately 3 Bcf/d at the conservative end to 6.1 Bcf/d in mid-range scenarios, with some high-growth projections implying a 10 to 15% increase in total US gas production over the next five years. The actual outcome depends heavily on grid interconnection timelines and the pace of data centre construction, both of which are now being addressed by the FERC and PJM regulatory changes.
What does the 79 million barrel crude inventory decline mean for oil prices?
The cumulative draw since late February 2026 has significantly reduced the buffer that markets rely on to absorb supply shocks. Even in a scenario where Middle East tensions ease materially, rebuilding this inventory typically requires six to twelve months under normal conditions. Consequently, this provides structural support for elevated oil prices through at least Q3 2026 and limits the downside for oil-linked energy investments.
Why is the Haynesville Basin specifically attractive for gas investment?
Haynesville's location in Louisiana places producers in direct pipeline reach of the Gulf Coast LNG export terminal complex. This geography allows Haynesville operators to serve both international buyers seeking supply chain security and domestic power generators responding to AI-driven electricity demand growth, making it one of the few US gas basins with genuine dual-market exposure to both primary demand catalysts.
This article is intended for informational purposes only and does not constitute financial or investment advice. Forecasts, demand projections, and scenario analyses involve material uncertainty and may differ significantly from actual outcomes. Readers should conduct independent research and consult qualified financial advisers before making investment decisions.
Want to Identify the Next Major Resource Discovery Before the Market Catches On?
While geopolitical disruptions and AI-driven energy demand reshape global commodity markets, Discovery Alert's proprietary Discovery IQ model delivers real-time alerts on significant ASX mineral discoveries — instantly translating complex data into actionable investment opportunities for both traders and long-term investors. Explore historic discoveries and their market returns to understand what's possible, then begin your 14-day free trial at Discovery Alert to position yourself ahead of the market.