May 21, 2026

The Commodity Market's Most Underappreciated Structural Problem
Few commodity markets illustrate the gap between price signals and supply response as vividly as platinum. The platinum supply deficit and PGM risk premiums building across 2026 represent a structural challenge that most commodity frameworks are not calibrated to assess. In most raw material markets, a sustained price doubling over twelve months triggers a wave of new project sanctioning, accelerated permitting, and expanded capacity. In platinum, the opposite dynamic has unfolded.
Primary mine output continues contracting, above-ground inventories are shrinking toward critical thresholds, and the physical market is signalling stress that paper trading can only temporarily obscure.
Understanding why this gap exists requires moving beyond the quarterly deficit numbers and examining the geological, operational, and metals geopolitics landscape that makes platinum supply uniquely resistant to price-driven correction.
When big ASX news breaks, our subscribers know first
Four Consecutive Annual Deficits: What the Cumulative Math Actually Reveals
The World Platinum Investment Council's Q1 2026 Platinum Quarterly, released May 19, 2026, confirmed a 297,000-ounce platinum supply deficit projected for full-year 2026. That figure represents a 57,000-ounce upward revision from the council's prior forecast and extends the sequence of annual shortfalls to four consecutive years.
The critical context is cumulative, not annual. Each successive deficit draws further on above-ground inventories that were already depleted by prior shortfalls. Since 2023, cumulative above-ground stock drawdowns have reached approximately 42%, compressing the physical buffer that historically absorbed seasonal or operational supply disruptions.
Above-ground platinum inventories now cover roughly four months of global demand, the lowest coverage ratio recorded since the council began systematic tracking in 2014. Furthermore, PGM supply constraints show little sign of easing within any near-term horizon.
Why Inventory Coverage Is the Key Risk Metric
Inventory coverage ratios translate abstract deficit numbers into actionable risk signals. The relationship between coverage levels and price behaviour is non-linear:
| Inventory Coverage Level | Market Interpretation | Historical Price Behaviour |
|---|---|---|
| 8–12 months | Comfortable buffer | Prices range-bound |
| 5–7 months | Tightening signal | Modest risk premium builds |
| Under 5 months | Delivery stress threshold | Accelerated price sensitivity |
| Under 3 months | Critical shortage territory | Structural price repricing |
When coverage falls below five months, incremental demand creates disproportionately larger price responses because less physical metal exists to absorb new buying activity. The platinum market crossed that threshold and is now operating in territory where supply shocks carry amplified pricing consequences.
Reading Q1 2026's Temporary Surplus Correctly
A surface-level reading of Q1 2026 data could suggest improving conditions. The quarter recorded a 268,000-ounce surplus, driven by an 18% year-over-year increase in South African mine output from a weak prior-year comparison base, while total demand fell 31%.
That interpretation collapses under examination. The demand decline was almost entirely attributable to 374,000 ounces of ETF and exchange inventory outflows, not weakening industrial or automotive consumption. Stripping out financial instrument flows reveals that underlying physical end-use demand remained structurally intact. The surplus was a financial positioning artefact, not evidence of a market moving toward balance.
Why the Platinum Supply Problem Cannot Self-Correct Quickly
The platinum supply deficit and PGM risk premiums that dominate current market discussions are not primarily a pricing problem. They are a structural geology and capital allocation problem that price signals alone cannot resolve within any near-term investment horizon.
South Africa's Twenty-Year Output Contraction
South Africa hosts approximately 91% of global platinum reserves within the Bushveld Igneous Complex, the world's only geological formation of sufficient scale to support large-scale platinum mining. The Bushveld is a layered mafic intrusion containing the Merensky Reef and UG2 Reef horizons, which carry the concentrated PGM mineralisation that defines the global supply picture.
Despite this reserve dominance, South African primary platinum production declined from approximately 5.3 million ounces in 2006 to 3.9 million ounces in 2025, a 26% contraction over two decades. Critically, this output reduction persisted through multiple price cycles above $2,000 per ounce, demonstrating that market price signals are insufficient to reverse the decline. Indeed, as noted by the World Platinum Investment Council, the deficit has continued worsening beyond earlier forecasts.
Several structural forces explain this inelasticity:
- Existing operations are mining progressively deeper, narrower reef horizons where labour-intensive methods dominate and mechanisation is constrained by seam geometry
- Eskom electricity tariffs for South African mining operations rose approximately 60% between 2021 and 2026, structurally elevating the cost base regardless of metal price movements
- Major producers have responded to elevated platinum prices by returning cash to shareholders through dividends and buybacks rather than committing multi-billion-dollar capital to new shaft development
- The 7 to 10-year construction timeline for replacement shaft projects means that even an immediate capital commitment today would not add meaningful supply before the mid-2030s
According to industry-level data tracked by the World Platinum Investment Council, global primary platinum production peaked at just over 6 million ounces in 2021 and is forecast at approximately 5.5 million ounces for 2026, a trajectory decline occurring against a backdrop of materially higher prices. (World Platinum Investment Council, Q1 2026 Platinum Quarterly)
The Global Mine Development Pipeline: Too Slow and Too Small
Outside the Bushveld Igneous Complex, the global pipeline of primary platinum projects is insufficient to offset South African output declines within the current decade. No major new platinum mining complex outside South Africa is expected to reach commercial production before 2030. Production declines at existing operations are outpacing development timelines across all non-South African jurisdictions, reinforcing the structural supply inelasticity case.
The 90% Supply Concentration Problem and Its Effect on PGM Risk Premiums
Geographic supply concentration is not merely a commodity risk footnote. For institutional investors, it represents a systematic constraint on accessing the platinum supply deficit theme without absorbing concentrated geopolitical exposure. The platinum and palladium dynamics operating across both metals underscore how deeply intertwined supply geography and risk premiums have become.
| Jurisdiction | Estimated Share of Primary PGM Supply | Key Risk Vectors |
|---|---|---|
| South Africa | 70–80% of mined platinum supply | Ageing shafts, power costs, labour disputes |
| Russia (Norilsk Nickel) | ~40% of global primary palladium | Sanctions exposure, geopolitical disruption |
| Zimbabwe | Significant PGM contributor | Export restrictions, regulatory unpredictability |
| Combined three jurisdictions | ~90% of primary supply | Systemic concentration risk |
Q1 2026 Disruption Events That Sharpened the Risk Premium
Three separate supply disruptions in early 2026 demonstrated how concentrated this risk architecture truly is:
- Norilsk Nickel (Russia): Q1 2026 platinum production fell 26% year-over-year; palladium production declined 18%. Full-year 2026 guidance projects further palladium declines of 10–11% and platinum declines of 5–8%
- Zimplats (Zimbabwe): Q1 2026 six-element PGM production collapsed 56% due to an extended smelter shutdown
- Zimbabwe regulatory action: A late-April 2026 ban on exports of unrefined critical minerals added sovereign policy risk to an already constrained supply chain
The combined effect was measurable in derivative markets. London platinum lease rates moved higher and Guangzhou Futures Exchange premiums widened as physically available metal became increasingly scarce. Geopolitical disruptions since 2022 are estimated to have removed approximately 800,000 to 900,000 ounces of effective annual supply from markets accessible to Western institutional investors.
The Guangzhou Futures Exchange: Reading the Physical Stress Signal
Perhaps the clearest real-time indicator of platinum physical market stress is the delivery dynamics playing out on the Guangzhou Futures Exchange. The June 2026 platinum contract reached an open-interest-to-inventory ratio of approximately 24:1 in May 2026, more than double the 10:1 threshold typically associated with delivery stress conditions.
In commodity futures mechanics, short-position holders who cannot source physical metal to fulfil delivery obligations must either roll their positions forward at a cost or purchase metal in the spot market. When the open-interest-to-inventory ratio reaches extreme levels, both options become increasingly expensive, driving spot premiums higher.
The Guangzhou situation has additional structural significance. China accounts for approximately 60% of global platinum demand, and as Chinese exchanges absorb greater volumes of physical metal from international markets, price discovery progressively shifts toward trading venues with lower Western institutional participation.
Demand Resilience: Why Electric Vehicles Are Not the Threat the Market Assumed
The platinum supply deficit narrative is reinforced by demand dynamics that consistently outperform consensus expectations built on early EV adoption projections.
The Hybrid Vehicle Offset
The automotive transition has not followed a straight line from combustion engines to battery electric vehicles. Hybrid powertrains are currently the fastest-growing global automotive segment, and they consume 10–20% more platinum group metals per vehicle than conventional internal combustion engine vehicles. This is because hybrid systems require catalytic converters sized for full combustion operation while also managing cold-start emissions that occur more frequently than in conventional vehicles.
China 7 Emissions Standards: The Demand Multiplier
China's China 7 vehicle emissions regulations, taking effect from 2026, mandate stricter cold-start and real-world driving emissions compliance. Meeting these standards requires higher per-vehicle PGM catalyst loadings, directly expanding platinum demand per unit of Chinese automotive production. Given that China accounts for approximately 60% of global platinum demand, regulatory shifts in Chinese automotive standards carry outsized implications for global demand trajectories.
Industrial Demand Acceleration
Beyond automotive applications, the industrial demand picture in 2026 has been notably strong:
- Q1 2026 industrial platinum demand rose 41% year-over-year
- A 94,000-ounce increase from the glass manufacturing sector followed recovery from Q1 2025 plant closures
- Full-year 2026 industrial platinum demand is forecast at 2,238,000 ounces, representing 11% year-over-year growth
- Glass-sector platinum demand alone is projected to rise 83% in 2026
- Additional demand growth is occurring in chemical processing and Chinese investment purchases
The next major ASX story will hit our subscribers first
Macroeconomic Override: How Rate Repricing Temporarily Dominated Physical Fundamentals
The platinum market's behaviour in May 2026 provided a textbook illustration of how macroeconomic forces can temporarily overwhelm physical supply and demand fundamentals. Monitoring the two-year yield outlook remains essential for understanding how rate expectations feed into precious metals pricing.
Platinum rose above $2,200 per ounce on May 14, 2026, then declined to $1,922 per ounce by May 20, a 12% drawdown in five trading sessions. This collapse occurred simultaneously with the WPIC confirming a fourth consecutive annual supply deficit.
The trigger was the Senate's confirmation of Kevin Warsh as Federal Reserve Chair on May 13, 2026, which shifted FOMC forward guidance toward a materially more hawkish posture. Market rate-cut expectations moved from four projected 2026 cuts at the start of the year to zero. Three FOMC members had already dissented against dovish guidance prior to the confirmation, and US headline CPI inflation remaining near 4% with Fed projections of 2026 core inflation at 2.7% reinforced the higher-for-longer rate environment.
| Macro Variable | Direction | Impact on Platinum |
|---|---|---|
| Real interest rates | Rising | Reduces relative attractiveness vs. yield-bearing assets |
| US dollar strength | Strengthening | Pressures USD-denominated commodity prices |
| Risk appetite | Declining | Reduces speculative long positioning |
| Physical supply fundamentals | Tightening | Bullish, but overridden in the short term |
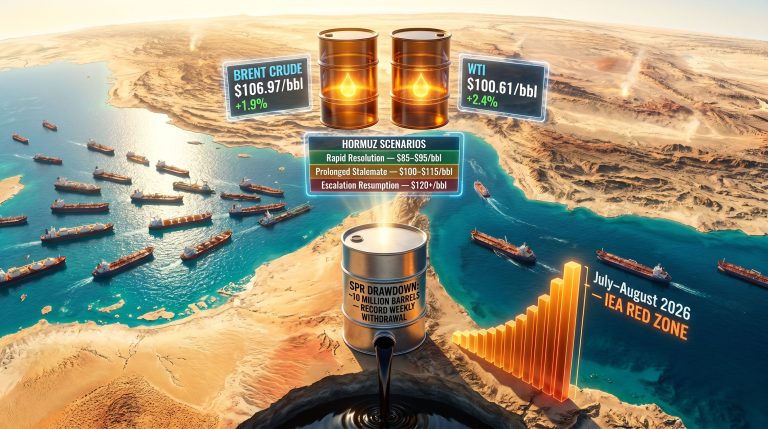
The geopolitical overlay added further complexity. Brent crude traded between $95 and $118 per barrel following a conflict outbreak on February 28, 2026. While elevated crude prices can support safe-haven flows into precious metals, they simultaneously erode automotive demand by reducing consumer vehicle purchasing power — a cross-current for platinum specifically given the automotive sector's ~40% share of total platinum consumption.
Price Outlook and Scenario Framework for Platinum Through 2027
Metals Focus raised its 2026 platinum price forecast to $2,190 per ounce, citing tightening physical inventories and elevated Guangzhou Futures Exchange delivery stress as primary drivers. Furthermore, Sprott's analysis suggests platinum is on track for a status upgrade as institutional recognition of the supply-demand imbalance grows.
Three Scenarios for Platinum Prices Through 2027
| Scenario | Key Assumptions | Platinum Price Range | Probability Assessment |
|---|---|---|---|
| Deficit Deepens | South African output continues declining; no new supply; Fed pivots H2 2026 | $2,400–$2,800/oz | Moderate |
| Base Case | Deficits persist near 300,000 oz/year; rates stay elevated; Chinese demand steady | $1,900–$2,300/oz | Highest |
| Supply Surprise | New project enters production early; demand weakens on EV acceleration | $1,400–$1,800/oz | Low |
Five variables will determine which pathway materialises:
- South African mine output trajectory and whether ageing shaft productivity stabilises or accelerates its decline
- Federal Reserve rate path and whether inflation persistence forces further hawkish repricing
- Norilsk Nickel production recovery and whether Q1 2026 declines are temporary or structural
- Chinese physical demand and Guangzhou inventory dynamics and whether delivery stress escalates or resolves
- Zimbabwe's regulatory environment and whether the export ban on unrefined critical minerals expands or reverses
Jurisdictional Risk Premiums: How Institutional Capital Is Repositioning
Institutional investors subject to Russian exposure limits, country concentration restrictions, or ESG-aligned sovereign risk frameworks are systematically excluded from accessing a significant portion of global PGM supply. This structural constraint is creating a valuation premium for PGM development projects located in politically stable, Western-aligned jurisdictions. The central bank metals demand context further reinforces why alternative-jurisdiction PGM projects are attracting renewed institutional attention.
For exploration-stage and development-stage projects in alternative jurisdictions to justify premium valuations, they must demonstrate several non-negotiable criteria:
- Metallurgical recovery validation using commercially viable processing methods on representative ore samples
- Resource scale sufficient to support economic mine planning and justify development capital
- Jurisdictional stability including regulatory, permitting, and fiscal frameworks that reduce sovereign risk materially compared to South Africa, Russia, or Zimbabwe
- Infrastructure access including proximity to power, water, logistics, and workforce
- Clear pathway to economic study with defined timelines toward Preliminary Economic Assessment and feasibility work
Important Disclaimer: Exploration-stage PGM companies carry materially different risk profiles than producing miners. These assets typically hold inferred-only resource classifications, require multi-year development timelines before first production, and rely on successive equity financing rounds that create ongoing shareholder dilution risk. Portfolio allocations to exploration-stage companies should reflect junior exploration risk assumptions rather than producer-equity valuation metrics.
One company operating in this space is ValOre Metals Corp. (TSXV: VO), which is advancing its Pedra Branca PGE project in Brazil toward a maiden Preliminary Economic Assessment targeted for Q4 2026. The company's University of Cape Town metallurgical testing reported platinum and palladium recoveries of approximately 73% and 74%, respectively, from weathered material using bioleaching methods. ValOre is also progressing a resource update incorporating more than 6,000 metres of 2023 drilling across five new zones. The company traded between C$0.085 and C$0.10 on the TSX Venture Exchange during the week of the WPIC report. Separately, ValOre is advancing the divestment of Hatchet Uranium Corp. to Future Fuels Inc., with closing expected on or before May 31, 2026 following TSX Venture Exchange conditional acceptance on May 19, 2026.
Frequently Asked Questions: Platinum Supply Deficit and PGM Risk Premiums
What is causing the 2026 platinum supply deficit?
The 297,000-ounce 2026 platinum supply deficit results from the convergence of declining South African primary output, production disruptions at major non-South African producers including significant output declines in Russia and Zimbabwe, and resilient physical demand from automotive, industrial, and investment channels. Above-ground inventories covering only four months of demand leave the market with minimal buffer against further supply shocks.
Why can't higher platinum prices solve the supply deficit quickly?
New platinum mine development requires 7 to 10 years from initial permitting through construction to first production. South African primary output declined 26% between 2006 and 2025 despite multiple price cycles above $2,000 per ounce, while Eskom electricity tariffs rose approximately 60% between 2021 and 2026. Major producers have responded to higher prices by returning cash to shareholders rather than expanding capacity.
What does the 24:1 Guangzhou Futures Exchange ratio indicate?
In commodity futures markets, an open-interest-to-inventory ratio above 10:1 is considered a delivery stress threshold indicating that short-position holders may lack sufficient physical metal to settle contracts at expiry. The Guangzhou Futures Exchange June 2026 platinum contract reached approximately 24:1 in May 2026, more than double the stress threshold, signalling materially tighter physical platinum availability relative to futures positioning.
Is hybrid vehicle growth actually increasing platinum demand?
Yes. Hybrid vehicles consume 10–20% more platinum group metals per vehicle than conventional internal combustion engine vehicles due to their more demanding catalytic converter requirements during engine cycling. With hybrids representing the fastest-growing global automotive segment, hybrid growth is providing a structural demand tailwind that partially offsets concerns about longer-term battery electric vehicle substitution.
Want to Track the Next Major Mineral Discovery Before the Market Moves?
Discovery Alert's proprietary Discovery IQ model delivers real-time alerts on significant ASX mineral discoveries, transforming complex geological and commodity data into actionable investment insights for traders and long-term investors alike — explore historic examples of major discovery returns to understand the opportunity, then begin your 14-day free trial at Discovery Alert to position yourself ahead of the broader market.