August 7, 2026
The Anatomy of a Commodity Rebound: Why Lithium Cycle Timing Defines Everything
Few forces in financial markets are as misunderstood as the commodity supercycle. Investors who enter a mining stock at the wrong point in the cycle can watch fundamentally strong businesses destroy portfolio value for years, while those who correctly identify the inflection point can capture some of the most explosive returns available on any exchange. Hard-rock lithium sits at exactly this kind of inflection point right now, and no ASX-listed company embodies that tension more clearly than the current PLS shares price target debate surrounding PLS Group Ltd (ASX: PLS).
The debate playing out between analysts covering PLS shares is not simply a valuation disagreement. It is a proxy war between two distinct views on where lithium markets are in their recovery cycle, how durable the current price environment will prove to be, and whether the company's ambitious capital expansion programme will amplify or dilute shareholder returns over the next 12 to 24 months.
Understanding the full picture requires going deeper than headline price targets.
When big ASX news breaks, our subscribers know first
From Market Trough to Record Highs: Reconstructing FY26's Extraordinary Run
The Two-Year Slump That Set the Stage
To appreciate the scale of what unfolded in FY26, it helps to understand what preceded it. Between mid-2023 and late 2025, the lithium market downturn represented one of the most severe supply gluts in modern history. A wave of new production, primarily from Australian spodumene extraction operations and Chinese lepidolite processing, flooded global markets precisely as EV adoption in key economies temporarily plateaued.
Spodumene concentrate prices, which had peaked near US$8,000 per tonne during the 2022 supercycle, collapsed to multi-year lows. For PLS Group, formerly trading as Pilbara Minerals, this meant watching its share price grind lower through an extended period of margin compression and investor fatigue. The stock became a barometer for bearish sentiment on the entire green energy transition theme.
What Changed at the Start of FY26
The fundamental shift that triggered FY26's recovery was a genuine supply and demand rebalancing. Higher-cost producers, particularly those reliant on more complex lithium sources, curtailed output. At the same time, demand signals from the global EV market and the rapidly expanding battery storage expansion sector began strengthening in a coordinated fashion across China, Europe, and North America.
The numbers tell the story directly:
| Commodity | FY26 Price Change | Price as at Early August 2026 |
|---|---|---|
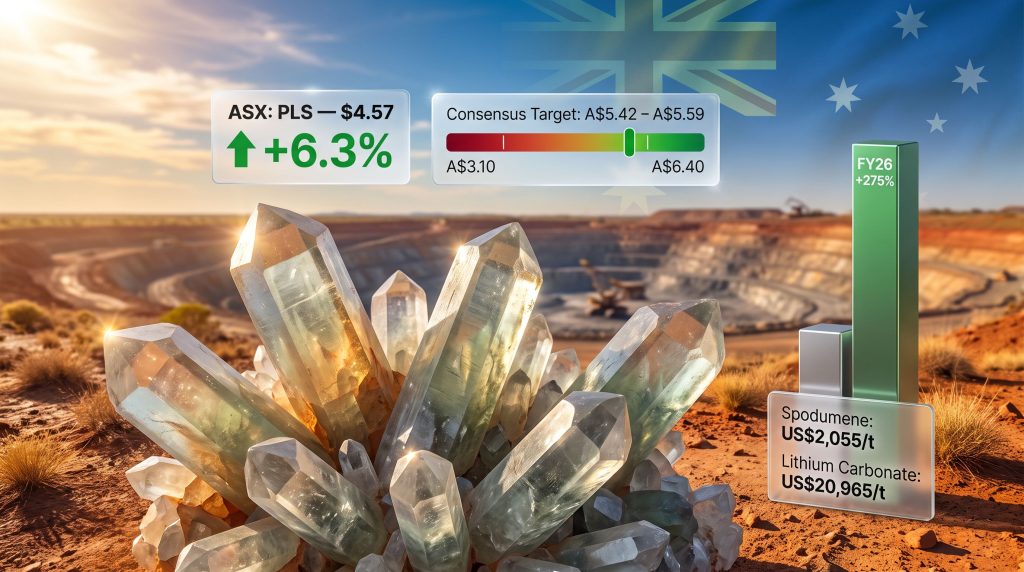
| Spodumene Concentrate | +278% | US$2,055/tonne |
| Lithium Carbonate | +160% | US$20,965/tonne |
Against this backdrop, the PLS share price surged 275% across the full financial year, closing at $5.02 on 30 June 2026 after briefly touching an intraday record high of $6.81 during the same month. By early August 2026, shares were trading near $4.57, having jumped 6.3% in a single session as overnight moves in global lithium commodity prices fed directly into ASX sentiment.
This near-perfect correlation between lithium spot prices and PLS's intraday performance is not coincidental. It reflects the market's treatment of PLS as a high-beta proxy for lithium commodity exposure rather than simply a business valued on its own operational merits. For investors building a PLS shares price target framework, commodity trajectory is not a secondary input; it is the primary driver.
Breaking Down the Broker Consensus on the PLS Shares Price Target
Six Active Ratings and What They Reveal
Following the release of PLS Group's fourth-quarter FY26 operational report, six major broking houses updated their 12-month price targets. The spread between the most optimistic and most pessimistic forecasts is unusually wide for an ASX 200 large-cap stock, signalling genuine analytical disagreement rather than minor methodological variation.
| Broker | Rating | 12-Month Price Target | Implied Move from ~$4.57 |
|---|---|---|---|
| Canaccord Genuity | Buy | $6.40 | +40% upside |
| Macquarie | Buy | $6.25 | +37% upside |
| Ord Minnett | Buy | $6.00 | +31% upside |
| Morgan Stanley | Hold | $5.15 | +13% upside |
| Bell Potter | Hold | $4.70 | +3% upside |
| Jarden | Sell | $3.10 | -32% downside |
"When the gap between the highest and lowest 12-month price targets for an ASX 200 large-cap exceeds $3.30, it almost always signals a structural debate about the commodity cycle itself, not just company-specific execution risk."
The Broader Consensus Picture
Aggregating coverage across a wider pool of approximately 17 analysts tracking PLS Group, the picture that emerges is moderately constructive but with significant dispersion. Furthermore, reviewing analyst consensus estimates across platforms reinforces the breadth of this divergence:
- Average 12-month consensus target: approximately A$5.42 to A$5.59
- Highest target on record: up to A$7.30 to A$7.70
- Lowest target on record: as low as A$2.63 to A$3.10
- Median estimate range: A$5.40 to A$5.60
The current PLS shares price target consensus of roughly A$5.42 to A$5.59 implies meaningful upside from the early August trading price of approximately A$4.57. However, the width of the range demands that investors interrogate the assumptions beneath each broker's model rather than simply averaging the outputs.
The FY27 Capex Program: The Fault Line Between Bulls and Bears
A Near-Doubling of Annual Spending
The single most divisive issue separating bullish from bearish broker views is PLS Group's capital expenditure trajectory into FY27. The company is transitioning from a period of relatively contained spending into one of the most capital-intensive phases in its operational history:
- FY26 actual capex: A$328 million
- FY27 capex guidance range: A$630 million to A$685 million, representing approximately 100% year-over-year growth
The key components driving this increase include:
- Mine development and a major pit cutback programme spanning FY27 to FY28: A$250 million to A$280 million. This is a standard but significant cost in open-pit lithium mining, where accessing deeper, higher-grade ore zones requires stripping large volumes of waste material ahead of production.
- Pre-Final Investment Decision expenditure on the P2000 expansion project: A$175 million. This represents the study and preparatory costs before a formal construction decision is made on a major capacity expansion.
- Ngungaju processing plant ramp-up to full capacity: targeting approximately 200,000 tonnes per annum by October 2026, with the plant carrying a higher operating cost structure than the primary facility.
What Is a Pit Cutback, and Why Does It Matter?
For investors unfamiliar with hard-rock mining mechanics, the pit cutback concept is worth understanding in detail. Open-pit mines extract ore from progressively deeper benches in the earth. As the mine deepens, the walls of the pit must be pushed back outward to maintain safe operating angles, which generates enormous volumes of waste rock that must be moved before fresh ore can be accessed.
A major cutback programme like the one PLS is undertaking across FY27 and FY28 is capital-intensive upfront but unlocks access to ore reserves that sustain production for years afterward. It is, in essence, paying today to ensure production continuity tomorrow. Consequently, investors who focus only on the near-term free cash flow impact without understanding the reserve access benefit will systematically undervalue the strategic logic of the expenditure.
FY27 Production Guidance and Unit Cost Trajectory
Bell Potter's updated analysis of PLS Group's operational guidance highlights several critical metrics for FY27:
- Spodumene concentrate production is guided at 1.03 million to 1.10 million tonnes, representing approximately 21% growth year-over-year at the midpoint
- Unit operating costs are expected to rise to A$575 to A$625 per tonne, up approximately 5% at the midpoint, partly attributable to the higher operating cost profile of the Ngungaju plant
The Ngungaju plant's cost premium over the primary Pilgangoora processing facility is an important consideration. Secondary processing infrastructure typically carries higher per-tonne costs due to smaller economies of scale and, in some cases, different ore feed characteristics. Whether this cost differential is acceptable depends entirely on the prevailing spodumene price: at US$2,000+ per tonne, Ngungaju economics are comfortably viable; at US$1,200 per tonne, the margin arithmetic changes materially.
The Bull Case: Why Three Brokers See 30% to 40% Upside
Earnings Power at Current Lithium Market Pricing
The three buy-rated brokers share a common analytical anchor: at prevailing lithium prices, PLS Group's earnings generation capacity is substantial. Bell Potter's own analysis noted that at current market prices, the company stands to produce meaningful earnings and cash flow alongside the restart of the 200,000 tonne per annum Ngungaju plant. The organic growth pipeline, including advancement of P2000 and Colina development studies, provides additional long-term value not fully captured in near-term earnings multiples.
Key pillars supporting the bull case:
- The Ngungaju restart adds volume at a structurally advantageous point in the commodity recovery cycle
- P2000 pre-FID work signals a credible pathway toward production capacity of approximately 2 million tonnes per annum in the longer term
- Long-term demand from EVs and BESS deployment remains structurally intact across major markets
- A cash balance of A$2.29 billion as of 30 June 2026, up 57% in the fourth quarter alone, provides exceptional balance sheet flexibility
Pilgangoora's Geological Advantages
The Pilbara Minerals outlook is underpinned by one of the most strategically valuable lithium geological assets in the world. The deposit is a lithium-caesium-tantalum (LCT) pegmatite, a specific class of intrusive igneous rock that concentrates lithium in the mineral spodumene at grades capable of supporting large-scale, long-life mining operations.
What distinguishes Pilgangoora from many competing lithium deposits globally is its scale combined with its relatively straightforward metallurgy. Spodumene concentrate from hard-rock pegmatite operations is a chemically consistent feedstock that downstream lithium chemical processors can rely upon, unlike some brine or lepidolite-derived materials that carry higher impurity profiles. This consistency commands a quality premium in long-term offtake negotiations and reduces processing risk for buyers.
The project's designation as the world's largest independent hard-rock lithium operation is not merely a marketing label. It reflects genuine economies of scale in processing throughput, infrastructure utilisation, and workforce productivity that smaller pegmatite operations simply cannot replicate.
The Bear Case: Why Bell Potter Cut Its Target and Jarden Recommends Selling
The Margin Compression Scenario
Bell Potter's decision to reduce its price target from A$6.15 to A$4.70 reflects a specific concern: the combination of rising unit costs from Ngungaju and elevated capex creates a period of compressed free cash flow at exactly the moment when some investors may be expecting a dividend uplift following FY26's strong performance.
Jarden's sell rating with a target of A$3.10 represents the most bearish position in the market and effectively embeds an assumption that current lithium prices are unsustainably high. If spodumene were to retrace toward US$1,200 to US$1,400 per tonne, which remains within the range of historical precedent, the earnings multiple that justifies a A$4.50+ share price would erode rapidly.
Key downside risks the bear case emphasises:
- Lithium price reversal driven by renewed supply additions from Africa, South America, or Chinese domestic production
- Cost overruns on the A$630 to A$685 million FY27 capex programme, being executed in a period of elevated construction and labour costs in Western Australia
- Ngungaju ramp-up delays could push production guidance toward the lower end of the 1.03 to 1.10 million tonne range
- Weaker EV adoption in key demand markets, particularly if consumer incentives are adjusted or if hybrid vehicle sales cannibalise full battery EV growth
The next major ASX story will hit our subscribers first
FY26 Operational Scorecard: The Foundation Beneath the Targets
Full-Year Performance at a Glance
| Metric | FY26 Result | Year-Over-Year Change |
|---|---|---|
| Spodumene Concentrate Production | 879,500 tonnes | +17% |
| Sales Volumes | 891,600 tonnes | +17% |
| Q4 Revenue | A$743 million | +31% vs Q3 |
| Cash Balance (30 June 2026) | A$2.29 billion | +57% in Q4 |
The fact that sales volumes slightly exceeded production volumes in FY26 suggests the company was drawing down inventory built during lower-price periods, a prudent decision that captured stronger average realised prices across the year. The Q4 revenue surge of 31% against the prior quarter reflects both volume growth and the sharp commodity price recovery that accelerated through the second half of the financial year. In addition, the evolving lithium carbonate market dynamics played a meaningful role in shaping the pricing environment throughout this period.
How Investors Should Evaluate the PLS Shares Price Target Range
A Multi-Variable Framework for Commodity Miners
Treating any single broker's 12-month target as a reliable forecast for a commodity-exposed miner is a category error. The appropriate approach involves constructing a scenario framework that stress-tests key assumptions. For instance, price target forecasts from aggregated analyst tools can provide a useful starting reference point:
- Spodumene price scenarios: Targets built on US$2,500+ per tonne assumptions will look very different from those using US$1,500 per tonne. Knowing each broker's commodity deck is essential before weighting their output.
- Production ramp-up risk: The October 2026 Ngungaju full-capacity target is a near-term catalyst. Any delay pushes FY27 volume toward the lower end of guidance.
- Capex sensitivity analysis: The A$630 to A$685 million range carries execution risk. A 10% cost overrun adds A$63 to A$68 million in additional spend, which flows directly through to net cash position.
- Balance sheet buffer assessment: PLS Group's A$2.29 billion cash position means the company could absorb significant capex overruns without requiring equity dilution, a fact that some bear-case models may underweight.
- Demand-side macro signals: Monthly EV sales data from China, the EU, and the US, along with BESS deployment statistics, function as leading indicators for lithium demand 12 to 18 months forward.
What the Spread Between Buy and Sell Targets Actually Signals
A A$3.30 gap between the highest buy target (Canaccord at A$6.40) and the sole sell target (Jarden at A$3.10) is rare for an ASX 200 top-tier stock. This is not analytical noise. It represents a fundamental disagreement about the sustainability of the current lithium price environment, and specifically whether the FY26 recovery represents a durable structural rebalancing or an overshooting cycle that will partially retrace.
The clustering of three buy-rated targets between A$6.00 and A$6.40 suggests a reasonably cohesive bull case, while the two hold-rated targets at A$4.70 and A$5.15 imply the current share price already reflects a fair portion of the recovery story.
"For investors, the PLS shares price target consensus of approximately A$5.42 to A$5.59 is most useful as a directional indicator rather than a precise forecast. The commodity assumptions embedded in each broker's model are the critical variable, and investors should calibrate their own view on lithium price sustainability before anchoring to any single target."
Key Catalysts That Could Shift the PLS Shares Price Target Landscape
Near-Term Events Worth Watching
- Full-year FY26 financial results: Monday, 24 August 2026. This is the single most significant near-term catalyst. Revenue, net profit, and full-year dividend declarations will either validate or challenge the consensus target range.
- Ngungaju ramp to full 200,000 tonne per annum capacity: targeted October 2026. Execution against this timeline is the operational test that will most influence broker re-ratings in Q4 2026.
- P2000 pre-FID progress updates. Any formal advancement toward a final investment decision on the 2 million tonne per annum expansion would be a material positive catalyst for longer-dated price targets.
- Global spodumene and carbonate spot price movements. The demonstrated correlation between overnight commodity moves and PLS's intraday performance means daily price tracking is relevant for active investors.
- EV and BESS demand data from China, Europe, and North America. These data releases function as the upstream demand signal that feeds into analyst commodity price deck revisions.
Frequently Asked Questions: PLS Shares Price Targets
What is the current consensus PLS shares price target?
The broad analyst consensus sits between approximately A$5.42 and A$5.59, based on coverage from around 17 analysts. The full range extends from a low near A$3.10 to a high above A$7.00, depending on each broker's commodity price assumptions.
How many brokers have a buy rating on PLS shares right now?
As of early August 2026, three of the six most recently updated broker ratings carry a buy recommendation: Canaccord Genuity (A$6.40), Macquarie (A$6.25), and Ord Minnett (A$6.00).
Is there a sell recommendation on PLS shares?
Yes. Jarden carries a sell rating with a 12-month target of A$3.10, implying approximately 32% downside from the early August 2026 price of approximately A$4.57.
What is driving the bullish case for PLS shares?
The bull case rests on sustained lithium price recovery driven by EV and BESS demand growth, meaningful production volume uplift from the Ngungaju restart contributing to FY27 guidance of 1.03 to 1.10 million tonnes, and a robust A$2.29 billion cash balance providing financial resilience through the capex cycle.
What are the primary risks to PLS shares reaching analyst price targets?
Key downside risks include a reversal in lithium commodity prices, potential cost overruns on the A$630 to A$685 million FY27 capex programme, delays in the Ngungaju ramp-up timeline, and weaker-than-anticipated EV adoption in major demand markets.
When does PLS Group release its full-year FY26 financial results?
Full-year FY26 results are scheduled for release on Monday, 24 August 2026.
This article contains general information only and does not constitute financial advice. Broker price targets represent forward-looking estimates that are subject to change based on commodity prices, operational outcomes, and broader market conditions. Past performance is not indicative of future returns. Investors should consider their personal circumstances and consult a licensed financial adviser before making investment decisions.
Want to Catch the Next Major Mineral Discovery Before the Market Does?
Discovery Alert's proprietary Discovery IQ model delivers real-time alerts on significant ASX mineral discoveries — turning complex commodity data into actionable insights for both short-term traders and long-term investors. Explore historic discoveries and the substantial returns they've generated, then start your 14-day free trial at Discovery Alert to position yourself ahead of the next major market move.