
June 17, 2026
The Geopolitical Risk Premium and Its Unwind: Understanding the 2026 Oil Market Collapse
Commodity markets have a well-documented tendency to price fear faster than they price resolution. When a geopolitical shock strikes a critical supply node, futures traders embed a risk premium into crude prices almost instantaneously, long before any physical barrel of oil is disrupted. The unwinding of that premium, however, follows a different rhythm entirely. The 2026 Iran conflict and its aftermath offer one of the most instructive examples of this mechanism, and understanding pre-Iran war oil prices is central to interpreting what has unfolded since.
When big ASX news breaks, our subscribers know first
What Were Oil Prices Before the Iran War? Establishing the Analytical Baseline
Before examining what the crude market collapse means for the broader economy, it is essential to establish where prices stood before the conflict began. This pre-war equilibrium serves as the single most important reference point for calculating war premiums, assessing the depth of the current selloff, and projecting where prices might settle once geopolitical risk is fully priced out.
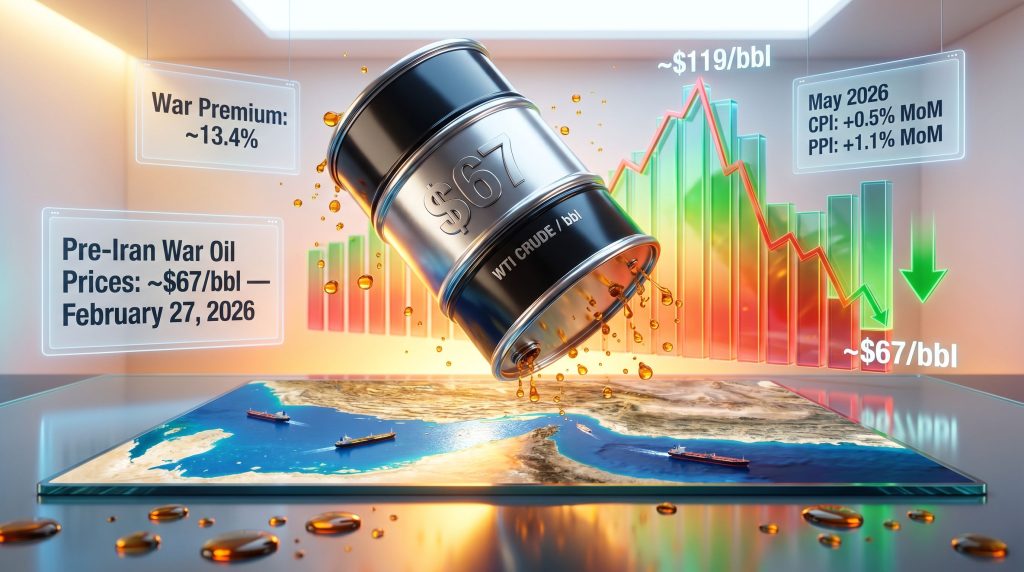
West Texas Intermediate crude settled at approximately $67 per barrel on February 27, 2026, the final trading session before hostilities between the United States and Iran commenced. Brent crude, the international benchmark, was also trading below the psychologically significant $100 per barrel threshold at that time. On Monday, March 2, 2026, the first trading day after the conflict began, WTI had already moved higher, settling above $71 per barrel as markets began pricing in the initial shock.
The speed of the subsequent move was remarkable. Within approximately one week of conflict onset, WTI briefly spiked above $119 per barrel, a four-year high, before retreating from those extreme levels while remaining substantially elevated for the months that followed. Furthermore, as this oil price volatility guide demonstrates, such rapid repricing events are a recurring feature of energy markets under geopolitical stress.
| Benchmark | Pre-War Level | Wartime Peak | War Premium (as of mid-June 2026) |
|---|---|---|---|
| WTI Crude | ~$67/bbl | ~$119/bbl | ~13.4% |
| WTI (March 2, 2026) | ~$71/bbl | First post-conflict trading day | |
| Brent Crude | Below $100/bbl | Above $100-$120/bbl | Declining |
Key Reference Point: The $67 WTI settlement on February 27, 2026, is not merely a historical data point. It represents the market's pre-geopolitical-risk equilibrium — the price level that reflects supply and demand fundamentals stripped of conflict premium. It is the level crude is now being projected to retest as diplomatic resolution materialises.
How the Iran Conflict Reshaped Global Oil Markets
The Anatomy of a Supply Shock
The mechanics of a war-driven oil price spike follow a consistent pattern across modern commodity market history. When conflict threatens a major production or transit corridor, the futures market responds before any physical supply is actually lost, embedding an insurance-style premium into the forward curve that compensates holders for the risk of disruption.
In the 2026 Iran conflict, that mechanism was amplified by one specific geographic factor: the Strait of Hormuz. This narrow waterway connecting the Persian Gulf to the Gulf of Oman is, by some estimates, the single most critical oil chokepoint on the planet. According to the U.S. Energy Information Administration, roughly 20% of global petroleum liquids trade transits the Strait annually, representing approximately 17–21 million barrels per day.
Any credible threat to its navigability sends an immediate signal through crude futures markets, often before a single tanker is rerouted. The move from $67 to above $119 within a single week illustrates just how violently markets can reprice when both a major producer and the world's most important oil transit corridor are simultaneously in the crosshairs. For broader context on the trade war impact on oil that preceded this conflict, the groundwork for this volatility had already been laid in prior months.
The Reopening Catalyst: Why the MOU Triggered a Sharp Reversal
The crude selloff that began accelerating in mid-June 2026 was triggered by a U.S.-Iran memorandum of understanding signalling the end of the conflict. The deal included expectations that the Strait of Hormuz would reopen as early as Friday, June 20, 2026. For futures markets, the announcement did not merely reduce uncertainty — it began the mechanical process of stripping the war premium back out of the forward curve.
WTI dropped sharply on June 16, 2026, falling below $76 per barrel, extending a nearly 5% decline from the prior session. This followed additional losses in the preceding Thursday and Friday sessions, creating a momentum-driven selloff consistent with the pattern seen when speculative long positions accumulated during a crisis begin to unwind simultaneously.
Why Is Crude Oil Falling So Sharply? The Supply-Side Story
Production Inertia: The Hidden Driver of the Price Collapse
Beyond the diplomatic catalyst, there is a less-discussed but equally powerful force pushing crude prices lower: the supply response that occurred during the elevated-price period. When WTI was trading in the $90–$119 range during the conflict, producers around the world accelerated output, drilling more aggressively and maximising production from existing wells to capture the windfall margins on offer.
The critical insight here is that this additional supply does not vanish the moment diplomatic signals emerge. Wells that have been drilled and brought online do not get shut in simply because prices are falling. This concept, sometimes described as production inertia, means that the global supply picture in mid-2026 reflects decisions made weeks and months earlier, at prices that no longer exist.
This dynamic suggests the supply overhang could persist well beyond the initial diplomatic announcement, exerting sustained downward pressure on prices even after the geopolitical premium is fully eliminated. OPEC's market influence will, consequently, be a critical variable in determining how quickly production discipline is restored.
Scenario Analysis: Where Does WTI Go From Here?
| Scenario | Implied WTI Price | War Premium Status |
|---|---|---|
| Full Strait reopening confirmed, deal holds | ~$67-$70/bbl | Eliminated |
| Partial resumption with ongoing monitoring | ~$72-$75/bbl | Partially retained |
| Deal collapses or re-escalation occurs | Return toward $90-$100/bbl | Fully reinstated |
The sub-$70 scenario is analytically credible given the combination of excess supply from wartime production ramp-ups, anticipated Strait of Hormuz reopening, and a reduction in speculative long positioning in crude futures. What provides a floor, however, is structural demand: global air travel recovery, industrial activity in Asia, and OPEC+ production discipline if the price decline becomes too severe for member state budgets.
Historical Precedent: What Oil Does After Geopolitical Risk Resolves
The 2026 episode is not without historical parallel. Following the resolution of prior geopolitical disruptions, crude oil markets have consistently exhibited a recognisable two-phase behaviour:
- Rapid premium compression as diplomatic signals emerge and speculative longs exit.
- Gradual drift toward pre-event fundamentals, sometimes overshooting to the downside as the supply response built during the crisis becomes apparent.
The 1990–1991 Gulf War provides one of the most studied examples. WTI surged from approximately $17/bbl before Iraq's invasion of Kuwait to above $40/bbl during the crisis, before falling sharply once coalition forces restored stability, ultimately settling back toward $20/bbl. The pattern of overshoot on the upside during crisis and undershoot on the downside during resolution is a recurring structural feature of commodity markets.
According to reporting from CNBC, analysts tracking the 2026 conflict have drawn similar parallels, noting that the current price trajectory is consistent with historical post-conflict unwinding patterns.
Pattern Recognition: Geopolitical oil spikes tend to be resolved faster in futures markets than in physical supply chains. Markets price in peace before peace is actually delivered, which means the price decline often moves ahead of the actual resumption of normal oil flows.
What Falling Oil Means for Inflation: The Macro Transmission Mechanism
How the Conflict-Era Price Spike Showed Up in May 2026 Data
The inflation consequences of the Iran war oil spike became clearly visible in the May 2026 data releases. Consumer prices rose 0.5% month-on-month, while wholesale inflation as measured by the Producer Price Index climbed a notably sharp 1.1% month-on-month. Core readings remained considerably more subdued, confirming that the spike in crude prices, rather than underlying demand pressure or wage-driven inflation, was the primary culprit.
How Lower Crude Filters Through the Economy
The transmission channels through which falling oil prices reduce inflationary pressure are multiple and sequential, with each operating on a different time lag:
| Economic Channel | Impact of Falling Oil | Typical Lag Time |
|---|---|---|
| Retail gasoline prices | Direct and significant reduction | 1-3 weeks |
| Airline fuel surcharges | Potential fare reductions | 4-8 weeks |
| Freight and logistics costs | Lower shipping and transport rates | 4-12 weeks |
| Manufacturing energy inputs | Reduced production cost base | 1-3 months |
| Headline CPI | Measurable downward pressure | 1-2 months |
The downstream effects extend beyond simple price reductions. Lower energy costs function as a structural input cost reduction across the entire manufacturing and logistics ecosystem. Furthermore, understanding the geopolitical oil price drivers that amplified this spike helps contextualise why the reversal is now unfolding with similar velocity.
The next major ASX story will hit our subscribers first
Federal Reserve Policy in 2026: Oil as the Unexpected Wildcard
The June 2026 Meeting and the New Fed Leadership Dynamic
The Federal Reserve's two-day June 2026 policy meeting concludes on Wednesday, June 18, with the central bank widely expected to hold interest rates unchanged at this gathering. However, the trajectory of crude oil prices is now directly relevant to the Fed's forward guidance and the market's expectations for subsequent meetings.
Kevin Warsh, who assumed the role of Federal Reserve Chair in 2026, is presiding over his first policy meeting in that capacity. The timing is notable: he is inheriting a monetary policy environment where the inflation picture has been temporarily distorted by a geopolitical energy shock, and where that shock is now actively reversing.
The political backdrop adds further texture. The Trump administration has consistently advocated for lower interest rates, with expectations that include a smaller Fed balance sheet and a potential overhaul of inflation measurement methodology over time.
Policy Pivot Watch: A sustained return to pre-Iran war oil prices would represent a significant disinflationary force — one that could allow the Federal Reserve to pivot toward an easing bias in later 2026 without appearing to capitulate to political pressure.
From Rate Hike Risk to Rate Cut Pathway: How Oil Changed the Conversation
The oil price trajectory over 2026 illustrates how rapidly the monetary policy narrative can shift based on a single commodity. When WTI was trading above $100/bbl during the conflict, the policy conversation moved away from potential rate cuts toward the uncomfortable possibility of rate hikes. The rapid reversal of crude prices has effectively closed that chapter, reopening the path toward easing in subsequent quarters.
This dynamic highlights a less-discussed aspect of Fed policymaking: the central bank's inflation mandate can be materially influenced by geopolitical events entirely outside its control. As this oil and geopolitics analysis illustrates, the intersection of energy markets and monetary policy has rarely been more consequential.
The Broader Economic Implications of a Return to Pre-War Oil Prices
The Consumer Energy Dividend
One of the most direct and immediate economic benefits of lower crude prices is the reduction in household energy expenditure. Lower gasoline prices function as a de facto consumption stimulus, freeing up discretionary income that would otherwise flow to the fuel pump. Research published by The Guardian highlights how this dynamic has played out for Australian households in particular, with fuel costs having risen sharply during the conflict period.
This energy dividend tends to benefit lower and middle-income households disproportionately, given that fuel costs represent a larger share of their total expenditure relative to higher-income cohorts.
Sector Rotation Across Equity Markets
The crude price reversal creates a clear and immediate divergence in sector-level earnings expectations:
- Winners: Airlines, freight and logistics operators, consumer goods manufacturers, retailers, and industrials with high energy input costs
- Losers: Upstream oil and gas producers, oilfield services companies, and energy infrastructure businesses whose revenues are directly tied to commodity price levels
- Mixed/Neutral: Petroleum refiners, whose profitability depends on the crack spread between crude input costs and refined product prices rather than the absolute price of crude itself
Equity markets typically begin rotating capital between these cohorts well before the economic effects of lower oil are visible in corporate earnings reports, meaning the sector rotation often precedes the fundamental improvement by one to two quarters.
FAQ: Pre-Iran War Oil Prices and the 2026 Crude Market
What were pre-Iran war oil prices?
WTI crude settled at approximately $67 per barrel on February 27, 2026, the final trading session before the Iran conflict began. This is the established pre-Iran war oil price baseline referenced across financial markets as the equilibrium level the market is now being projected to retest.
How high did WTI crude rise during the Iran war?
WTI briefly spiked above $119 per barrel within approximately one week of the conflict's onset, reaching a four-year high before retreating. The move represented a near-80% premium above the pre-war price baseline.
Why are oil prices falling rapidly in mid-2026?
Three concurrent forces are driving the decline: a U.S.-Iran memorandum of understanding signalling conflict resolution, the anticipated reopening of the Strait of Hormuz, and a global supply glut created by producers who ramped output during the elevated-price period and are unlikely to rapidly reduce that production.
What is the war premium in oil, and how large is it now?
The war premium is the additional price embedded in crude futures reflecting geopolitical risk above and beyond what supply-demand fundamentals alone would support. As of mid-June 2026, WTI's war premium had compressed to approximately 13.4%, with further reduction expected as diplomatic progress advances.
How does falling oil affect inflation and Federal Reserve policy?
Lower crude prices reduce gasoline, transportation, and manufacturing costs, exerting downward pressure on both headline CPI and wholesale PPI. Given that the May 2026 inflation acceleration was primarily energy-driven, a sustained crude price reversal could meaningfully soften upcoming inflation readings and strengthen the case for Federal Reserve rate cuts in later 2026 under new Fed Chair Kevin Warsh.
Key Takeaways: The Strategic Significance of the 2026 Oil Reversal
Bottom Line: The crude market in mid-2026 is undergoing one of the most consequential geopolitical risk unwinds in recent memory. A confirmed return to pre-Iran war oil prices near $67/bbl would deliver a powerful deflationary impulse across the economy, reduce pressure on Federal Reserve policymakers, boost consumer purchasing power, and trigger significant sector rotation in equity markets.
- Pre-Iran war oil price baseline: ~$67/bbl (February 27, 2026)
- Wartime WTI peak: ~$119/bbl (approximately one week after conflict onset)
- Current war premium: ~13.4% as of mid-June 2026
- Key downside catalyst: U.S.-Iran MOU and anticipated Strait of Hormuz reopening by June 20, 2026
- Macro implications: lower headline inflation, narrowed rate hike risk, potential rate cut pathway in H2 2026, consumer spending uplift
- Sector winners: airlines, logistics, retailers, industrials
- Sector under pressure: upstream energy producers, oilfield services
This article contains forward-looking analysis, scenario projections, and commentary drawn from publicly available market data and media reporting as of mid-June 2026. It does not constitute financial or investment advice. Commodity price projections are inherently uncertain and may not reflect actual outcomes. Readers should consult qualified financial advisors before making any investment decisions based on the scenarios described herein.
Want to Capitalise on the Next Major Commodity Discovery Before the Broader Market Reacts?
While oil market volatility reshapes sector fortunes, significant mineral discoveries on the ASX can generate equally dramatic price movements — and Discovery Alert's proprietary Discovery IQ model delivers real-time alerts the moment those discoveries are announced, turning complex data across 30-plus commodities into clear, actionable insights. Explore historic examples of exceptional discovery returns and begin your 14-day free trial at Discovery Alert to position yourself ahead of the market.