June 17, 2026
The Hidden Flaw in Most Precious Metals Market Research
Most investors approaching precious metals markets assume that a supply-demand surplus or deficit figure tells them something meaningful about physical scarcity. That assumption is only valid if the underlying methodology separates genuinely distinct categories of market activity. When it does not, the resulting data can actively mislead, creating the conditions for momentum-driven investment decisions dressed up as fundamental analysis.
Understanding precious metals supply and demand methodology is not a theoretical exercise. It has direct, compounding consequences for portfolio returns across decades of investment activity. The gap between rigorous and flawed research frameworks is not narrow. Over a multi-decade horizon, it can represent the difference between a 4.7% annualised return and a 14.3% annualised return on gold alone, a differential that translates into outcomes roughly 55 times greater in absolute dollar terms starting from a million dollar base.
When big ASX news breaks, our subscribers know first
Why Precious Metals Supply and Demand Methodology Starts With Structural Separation
The foundational principle of rigorous precious metals supply and demand methodology mirrors the standard framework applied across base metals, energy, and agricultural commodity research for decades. A market surplus or deficit is calculated by subtracting fabrication demand from total supply. Investment demand does not enter that equation.
This is not a stylistic preference. It reflects a structural reality: fabrication demand and investment demand are not variations of the same thing. They are opposite forces with opposite behavioural characteristics, and combining them produces an analytically incoherent figure that obscures whether a physical market is genuinely tight or artificially inflated by investor activity.
The formula is straightforward:
Physical Market Balance = Total Supply (Mine Production + Recycling ± Official Sector Activity) minus Fabrication Demand
Investment demand is then analysed as a separate, independent variable, treated not as a minor footnote but as the single most important econometric driver of price direction in precious metals markets.
The Behavioral Difference That Changes Everything
Fabrication demand is characterised by an inverse relationship with price. As metal prices rise, industrial consumers, jewellery manufacturers, and electronics producers seek substitutes, reduce metal intensity, or defer purchases. As prices fall, consumption expands. This behaviour is well-documented across gold and silver markets: fabrication demand grew substantially through the lower-price environment spanning roughly 1982 to the late 1990s, then contracted as prices climbed through the 2000s.
Investment demand behaves in precisely the opposite direction. Investor flows tend to accelerate during price rallies and contract during corrections. Many participants in precious metals markets are momentum-driven rather than value-driven, chasing prices higher and then retreating as prices fall. This positive price correlation is a defining characteristic that makes investment demand structurally incompatible with fabrication demand in a single surplus-deficit calculation.
There is a second critical distinction. When metal enters fabrication channels, it is permanently transformed. Bullion incorporated into electronics, industrial coatings, automotive components, or jewellery ceases to be readily liquid. Recovering it requires significant processing cost and typically involves a discount to spot value. In many applications, the fabricated product carries far higher value than the metal content alone.
Investment demand, by contrast, preserves metal in bullion form. Bars, coins, and exchange-traded fund holdings remain liquid and can re-enter the market at any moment. Investor holdings represent a temporary reallocation of above-ground stock, not a permanent removal of metal from the tradeable market. The physical consequences of these two demand categories are therefore fundamentally different.
Anatomy of a Rigorous Precious Metals Supply-Demand Model
The Supply Side: Components That Must Be Disaggregated
A comprehensive supply model cannot treat all metal entering the market as equivalent. Each source carries different price sensitivity and structural characteristics. Furthermore, understanding supply and demand in precious metals is essential for building accurate models.
| Supply Component | Description | Key Consideration |
|---|---|---|
| Mine Production | Primary extraction from operating mines | Byproduct vs. primary production matters for silver, platinum, palladium |
| Recycling and Scrap Recovery | Metal reclaimed from jewellery, electronics, and industrial scrap | High recycling rates can significantly offset primary supply needs |
| Above-Ground Vault Stocks | Existing stockpiles that can be mobilised into the market | Particularly significant for gold's exceptionally high stock-to-flow ratio |
| Official Sector Activity | Central bank purchases and sales | Treated as a separate net supply or demand variable, not blended into commercial flows |
The Demand Side: Why Disaggregation Is Not Optional
| Demand Category | Price Correlation | Physical Effect |
|---|---|---|
| Fabrication and Industrial | Inverse | Permanently transforms metal form |
| Jewellery | Inverse | Price-sensitive; fabrication classification |
| Investment (Bars, Coins, ETFs) | Positive | Metal remains in bullion form; liquid |
| Official Reserve Accumulation | Structural and policy-driven | Treated as a separate supply-demand variable |
The Gross vs. Net Demand Distinction
Beyond separating fabrication from investment demand, rigorous precious metals supply and demand methodology distinguishes between gross and net demand figures.
Gross demand measures the total volume of metal consumed across all fabrication channels before recycling is considered. Net demand subtracts recycled and scrap recovery volumes to identify the market's true requirement for new primary metal production.
This distinction matters most in markets with high recycling rates. Silver's dual demand characteristics mean it is recovered from electronics, photography, and silverware at scale. If a gross demand figure is used without accounting for recycled supply, analysts will systematically overstate the requirement for new mine output. Net demand analysis forces accountability for the circular flow of above-ground metal back into the supply chain, producing a more accurate picture of genuine physical scarcity.
A gross deficit occurs when fabrication demand exceeds total supply before recycling is incorporated. A net deficit occurs when fabrication demand exceeds supply even after recycled metal is included. Net deficits are the more meaningful signal of real supply pressure because they reflect the market's irreducible requirement for freshly mined metal.
Stock-to-Flow Dynamics and Their Analytical Implications
One of the most commonly underappreciated dimensions of precious metals supply and demand methodology involves the role of above-ground inventories. Gold and silver carry exceptionally high stock-to-flow ratios, meaning the cumulative above-ground stockpile dwarfs annual mine production by a substantial margin.
For gold, early supply-demand balance estimates compiled in the mid-1960s placed total investor holdings at approximately 340 million ounces. Investor purchases since 2002 alone have exceeded that figure, driven by a structural expansion in the number of active market participants, the geographic distribution of investment demand into emerging markets, and the proliferation of investment vehicles including exchange-traded funds and digital platforms.
This structural reality has a direct modelling implication: flow-based analyses comparing annual mine output with annual fabrication consumption capture only a fraction of the effective market. Inventory mobilisation, vault drawdowns, and lease market activity can all influence price dynamics independently of new production or end-use consumption. Models that ignore above-ground stocks will systematically underestimate available supply and misread scarcity signals.
Lease rates and lending activity in precious metals markets function as real-time signals of inventory availability, providing information that production-consumption comparisons alone cannot capture.
Metal-Specific Methodological Adjustments
Not all precious metals require identical analytical treatment. The dominant demand drivers, supply structures, and behavioural dynamics differ materially across the four major metals. In addition, examining platinum and palladium dynamics alongside gold and silver provides a more complete picture of the broader precious metals landscape.
| Metal | Key Methodological Consideration |
|---|---|
| Gold | Central bank activity must be isolated; investment demand is the dominant price driver; high stock-to-flow ratio requires inventory modelling |
| Silver | Large share of supply is byproduct from base metal mining, meaning silver supply does not respond directly to silver price signals in the short term |
| Platinum | Automotive demand should be modelled on vehicle production volumes, not retail sales figures, to avoid timing distortions |
| Palladium | Investor positioning and sentiment can amplify or dampen price movements well beyond what physical fundamentals alone would suggest |
The Vehicle Production vs. Sales Data Problem
For platinum-group metals (PGMs), a methodological error that appears in some research involves using vehicle retail sales data rather than vehicle production data to estimate autocatalyst demand. Catalytic converters are installed during manufacturing, meaning autocatalyst consumption tracks production volumes, not consumer purchasing decisions. Using retail sales data introduces a timing mismatch that can distort quarterly and annual demand projections, particularly in periods where production and sales cycles diverge.
The next major ASX story will hit our subscribers first
The Producer Hedging Distortion
A historically significant source of methodological error in gold market research involves the treatment of producer forward selling. Producer hedging involves financial contracts that lock in a future selling price. These are not immediate physical deliveries to the spot market. Treating producer forward sales as equivalent to spot physical supply misrepresents both the timing and the nature of metal entering the market.
The inverse error is equally distorting. When producers unwind forward hedges, known as dehedging, this does not constitute physical spot demand in any meaningful sense. Yet some research frameworks have characterised it as such.
A further asymmetry historically appeared in this analysis: certain market commentators focused exclusively on producer forward selling while ignoring the substantial forward buying activity conducted by fabricators, refiners, smelters, semifabricators, and investment product manufacturers. Selective inclusion of one side of the hedging ledger while excluding the other produces a systematically biased view of market positioning that serves narrative purposes rather than analytical ones.
The methodological distortions introduced by treating producer hedging as physical supply, or dehedging as physical demand, do not reflect errors of omission. They reflect a selective approach to data that inflates apparent deficits and can drive momentum-based investment behaviour disconnected from underlying physical fundamentals.
Current Market Conditions Across the Four Major Metals
As of mid-2025, each of the four major precious metals is navigating a distinct set of fundamental and sentiment-driven dynamics. Reviewing precious metals market analysis helps contextualise these current conditions within longer-term structural trends.
| Metal | Recent Price Range | Near-Term Outlook | Primary Driver |
|---|---|---|---|
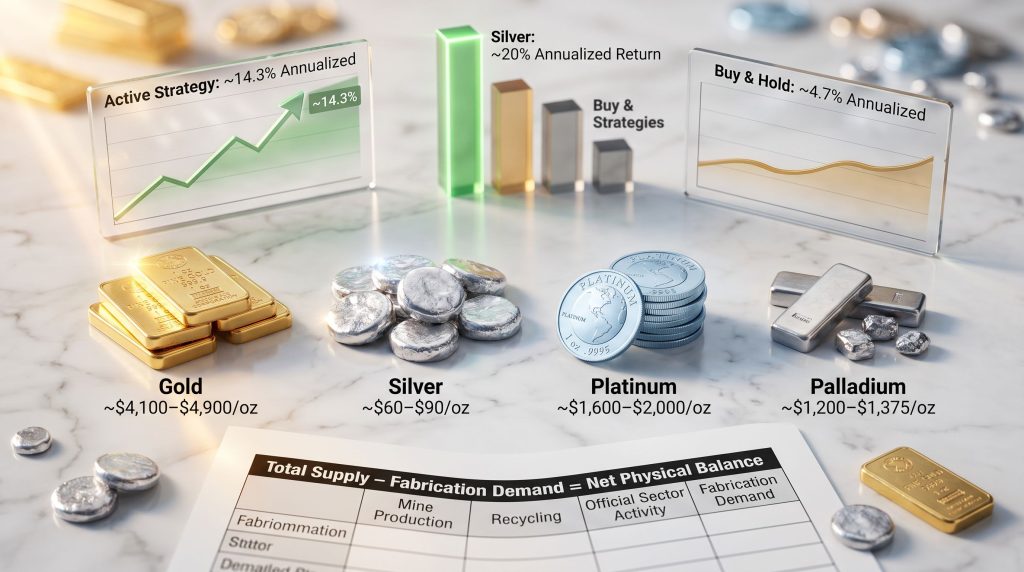
| Gold | Approximately $4,100 to $4,900 per ounce | Sideways consolidation; support levels at $3,800 and $3,500 | Mixed investment flows; central bank caution at current price levels |
| Silver | Approximately $60 to $90 per ounce | Wide consolidation range; higher prices anticipated in late 2025 | Tightening physical surplus; selective investor re-engagement |
| Platinum | Approximately $1,600 to $2,000 per ounce | Downside bias within range | Concern over reduced autocatalyst demand driven by EV adoption |
| Palladium | Approximately $1,200 to $1,375 per ounce | Continued sideways movement with downward bias | Fading bullish momentum; structural EV headwind |
Gold experienced a sharp correction from approximately $4,900 to $4,100 following the Federal Open Market Committee's mid-March 2025 meeting, at which policymakers indicated that interest rate cuts were unlikely given persistent inflation and a more resilient than expected economic backdrop. The subsequent recovery to near $4,364 reflects renewed but cautious investor interest, with some participants taking profits while central bank gold demand has shown reduced activity on both buying and selling at current price levels.
Silver's March 2025 low of approximately $61 per ounce and subsequent recovery to $90 before correcting again illustrates the volatility characteristic of a market with a tightening physical surplus. Silver markets have operated in a sustained supply surplus relative to fabrication demand since approximately 2006, but that surplus has been narrowing materially through 2023 and 2024, approaching conditions last observed in the late 1980s. Historically, periods of tightening surplus have preceded significant investor-driven price appreciation when sophisticated investors identify the structural shift early.
The Electric Vehicle Transition and PGM Demand
Platinum and palladium face a structural demand headwind as battery electric vehicle adoption accelerates, reducing the total fleet requiring catalytic converters. However, the partial reversal toward hybrid vehicle adoption in several major markets provides a partial offset. Hybrid powertrains continue to require platinum, palladium, and rhodium in catalytic converters, meaning the transition away from pure internal combustion engines does not represent a complete elimination of autocatalyst demand.
The current weakness in palladium relative to platinum reflects, in part, differential investor interest. More institutional and retail investor participation exists in platinum than in palladium, providing a degree of price support in platinum that is less present in palladium.
The Compounding Return Advantage of Methodological Precision
The long-term investment case for rigorous precious metals supply and demand methodology ultimately rests on return outcomes rather than theoretical elegance.
Consider gold purchased at approximately $595 per ounce in December 1980 and held passively through to the present. That strategy would have generated approximately 4.7% annualised returns, a respectable but unexceptional result comparable to long-term bank certificate of deposit yields over the same period.
Now consider the returns from applying a research-driven strategy based on supply-demand analysis that correctly separates fabrication from investment demand:
- Following buy recommendations only, without acting on sell signals: approximately 11% annualised return
- Following both buy and sell signals, including short positions during bearish phases: approximately 14.3% annualised return
Starting from a one million dollar base, a passive hold strategy would have grown to approximately $7.8 million. The active, research-driven strategy following both buy and sell signals would have grown to approximately $426 million over the same period. That is a 42,000% increase versus roughly 680%, a difference that is exponential rather than linear and grows dramatically wider over time.
For silver, the compounding differential is even more striking. Silver purchased at approximately $16.28 per ounce in December 1980, following the January 1980 spike to $50, and managed through disciplined research-driven positioning would have produced returns approximately 1,000 times greater than a passive hold strategy over the same horizon. By the first quarter of 2025, silver reached approximately $78.27 per ounce, representing a 20% annualised return for correctly timed and managed positions.
Platinum analysis under the same methodology produced 14.7% annualised returns for active strategy participants versus 2.8% annualised returns for passive holders from December 1980, an outcome roughly equivalent to a long-term bank savings rate.
The compounding logic is straightforward: more accurate research generates more accurate price projections, which enable better entry and exit timing, which produces compounding return advantages that grow exponentially across multi-decade investment horizons.
The Most Common Methodological Errors in Precious Metals Research
Understanding what rigorous methodology looks like also requires recognising the errors that undermine research quality across the industry.
Error 1: Including investment demand in surplus and deficit calculations
- Produces artificially inflated deficit figures that do not reflect genuine physical market tightness
- Creates conditions for momentum-driven buying based on other investors' activity rather than real supply constraints
Error 2: Treating producer forward selling as equivalent to spot physical supply
- Forward sales are financial contracts with future delivery obligations, not immediate physical deliveries to the spot market
- Conflating the two misrepresents the timing and physical nature of metal availability
Error 3: Treating producer dehedging as physical spot demand
- The unwinding of forward sales is a financial transaction, not physical buying activity in the spot market
- This error is the mirror image of Error 2 and is equally distorting
Error 4: Asymmetric hedging analysis
- Analysing producer forward selling while ignoring forward buying by fabricators, refiners, smelters, and investment product manufacturers
- Selective data inclusion creates a systematically biased market positioning picture
Error 5: Flow-only analysis without stock context
- Ignoring above-ground inventory levels and stock-to-flow dynamics, particularly critical for gold and silver
- Can substantially underestimate effective supply available in any given period
Error 6: Using vehicle sales data for PGM autocatalyst demand modelling
- Autocatalyst demand is driven by vehicle production, not consumer retail purchases
- Using sales data introduces a timing mismatch that distorts both quarterly and annual demand estimates
A Step-by-Step Framework for Building a Rigorous Precious Metals Model
Step 1: Compile and disaggregate primary supply data
- Gather mine production by country, separating primary producers from byproduct producers
- Identify whether metal is produced as a primary commodity or as a byproduct of base metal mining (critical for silver, platinum, and palladium, where supply does not respond directly to the metal's own price signals)
- Source recycling and scrap recovery volumes by end-use category
Step 2: Isolate official sector activity
- Separate central bank purchase and sale activity from commercial supply flows
- Treat net official sector activity as a distinct supply or demand variable, not as a component of commercial mine supply
Step 3: Calculate fabrication demand independently across end-use sectors
- Model electronics, automotive, industrial, and jewellery demand separately
- Apply price elasticity adjustments where historical data supports quantification
- For PGMs, use vehicle production volumes rather than retail sales data
Step 4: Compute the physical market balance
- Physical Balance = (Mine Production + Recycling ± Official Sector Activity) minus Fabrication Demand
- This figure represents the net availability of metal for investment absorption and signals the degree of physical tightness or looseness
Step 5: Analyse investment demand as a separate variable
- Track bar and coin demand, ETF flows, institutional positioning, and futures market data independently
- Assess whether investor behaviour reflects momentum-driven activity or genuine value-driven response to physical tightness
- Identify structural shifts in the investment demand baseline, such as the upward shift in gold investment demand visible from approximately 2002 onward
Step 6: Integrate macro and structural overlay variables
- Real interest rates and inflation expectations (opportunity cost of holding non-yielding bullion)
- Central bank reserve diversification activity
- Geopolitical risk and macroeconomic uncertainty indicators
- Industrial cycle data relevant to each metal's specific demand profile
- Currency dynamics, given the well-documented inverse relationship between US dollar strength and dollar-denominated metal prices
Step 7: Generate scenario-based price projections
- Use the physical balance as the fundamental anchor
- Weight investment demand as the primary short-to-medium term price driver
- Produce base case, bull case, and bear case scenarios with explicit, documented assumptions
Why the Investment Demand Baseline Matters for Long-Term Price Structuring
One of the more nuanced insights emerging from long-term precious metals supply and demand analysis involves the concept of a structural shift in the investment demand baseline, rather than a simple year-to-year fluctuation.
From the late 1960s through approximately 2002, gold investment demand followed a recognisable cyclical pattern: elevated purchases during periods of economic stress or geopolitical uncertainty, followed by multi-year consolidation phases. Net annual investor purchases exceeding roughly 20 million ounces historically corresponded with upward price pressure. Periods below that threshold aligned with price weakness or sideways consolidation.
From approximately 2002 onward, a structural upward shift became apparent. The number of active investor participants expanded globally. Geographic distribution of gold investment broadened into emerging markets. The diversity of available investment vehicles multiplied with the introduction of exchange-traded funds, digital gold platforms, and institutional gold products. Consequently, investors have collectively purchased more gold since 2002 than all estimated investor holdings at the beginning of modern supply-demand tracking in the mid-1960s.
This structural shift does not mean gold prices move in one direction indefinitely. However, it does mean that the investment demand baseline against which annual flows should be measured has reset materially higher, and models calibrated to pre-2002 behavioural norms will systematically underestimate the structural support for gold prices in contemporary markets. Furthermore, the gold-silver ratio analysis provides additional context for understanding relative value shifts between the two metals during these structural transitions.
Correctly identifying structural shifts in investment demand baselines, rather than treating all demand changes as cyclical, is one of the most analytically valuable capabilities a rigorous precious metals research framework can provide.
Frequently Asked Questions: Precious Metals Supply and Demand Methodology
Why is investment demand excluded from surplus and deficit calculations?
Investment demand is excluded because it behaves in structurally opposite ways to fabrication demand. It carries a positive price correlation rather than an inverse one, and it does not permanently remove metal from bullion form. Including it in the surplus-deficit calculation conflates two analytically incompatible forces and produces a balance figure that does not accurately represent physical market tightness.
Does excluding investment demand mean it is being ignored?
No. Excluding investment demand from the surplus-deficit equation is a deliberate analytical choice to examine it with greater precision as a dedicated price-driving variable. In rigorous precious metals research, investment demand is treated as the single most important fundamental driver of price direction. It receives focused, independent analytical treatment precisely because it is too important to be subsumed into a blended demand aggregate.
What is the difference between a gross and a net deficit?
A gross deficit occurs when total fabrication demand exceeds total supply before recycled metal is incorporated. A net deficit occurs when fabrication demand exceeds supply even after recycling is accounted for. Net deficits are more meaningful indicators of genuine supply pressure because they identify the market's true irreducible requirement for new primary metal production.
How does the stock-to-flow ratio affect precious metals price analysis?
Because gold and silver carry very large above-ground inventories relative to annual mine output, even modest changes in the willingness of existing holders to sell can materially alter effective market supply. Flow-based models can substantially underestimate available supply in any given period. Furthermore, silver supply and demand data illustrates how inventory behaviour and scarcity indicators frequently carry greater predictive power than production-consumption comparisons alone.
Why do platinum and palladium require different methodological treatment from gold and silver?
Platinum and palladium are primarily consumed in automotive catalytic converters, linking their demand profiles directly to vehicle production cycles rather than consumer purchasing patterns. Additionally, the accelerating adoption of battery electric vehicles introduces a structural long-term demand headwind that must be modelled separately from cyclical production fluctuations. The partial offset from hybrid vehicle growth, which still requires PGM catalysts, adds further complexity that requires disaggregated demand modelling to capture accurately.
Disclaimer: This article is for informational and educational purposes only and does not constitute financial or investment advice. Price projections, return estimates, and market outlooks referenced herein are based on analytical frameworks and historical data and should not be interpreted as guarantees of future performance. Precious metals markets involve substantial risk, and investors should conduct independent research and consult qualified financial advisors before making investment decisions.
Want to Identify the Next Major Mineral Discovery Before the Broader Market?
Discovery Alert's proprietary Discovery IQ model delivers real-time alerts on significant ASX mineral discoveries, transforming complex market data into actionable investment insights for both short-term traders and long-term investors — start your 14-day free trial today and see why historic discoveries have generated extraordinary returns on the Discovery Alert discoveries page.