July 21, 2026
The Energy Reckoning Reshaping One of the World's Most Power-Hungry Industries
Few industrial processes expose the fault lines of an energy transition quite like primary aluminium smelting. Each tonne of aluminium produced requires roughly 14 to 15 megawatt-hours of electricity, making smelters among the most power-intensive facilities on the planet. When electricity contracts are stable and affordable, these operations run profitably for decades. When they are not, entire facilities face closure within months. This structural reality sits at the centre of every production figure, every quarterly fluctuation, and every capital commitment emerging from Oceania's aluminium sector in 2026.
Against that backdrop, the fact that Oceania primary aluminium production rose 2.2% in H1 2026 to reach 943,000 tonnes is more than a headline statistic. It is a window into how the region's smelter network is navigating simultaneous pressures from climate-driven supply disruption, ageing power infrastructure, and a multi-billion-dollar pivot toward renewable energy. Furthermore, understanding these pressures requires examining both the immediate production data and the deeper structural forces at play.
When big ASX news breaks, our subscribers know first
H1 2026 at a Glance: The Core Production Numbers
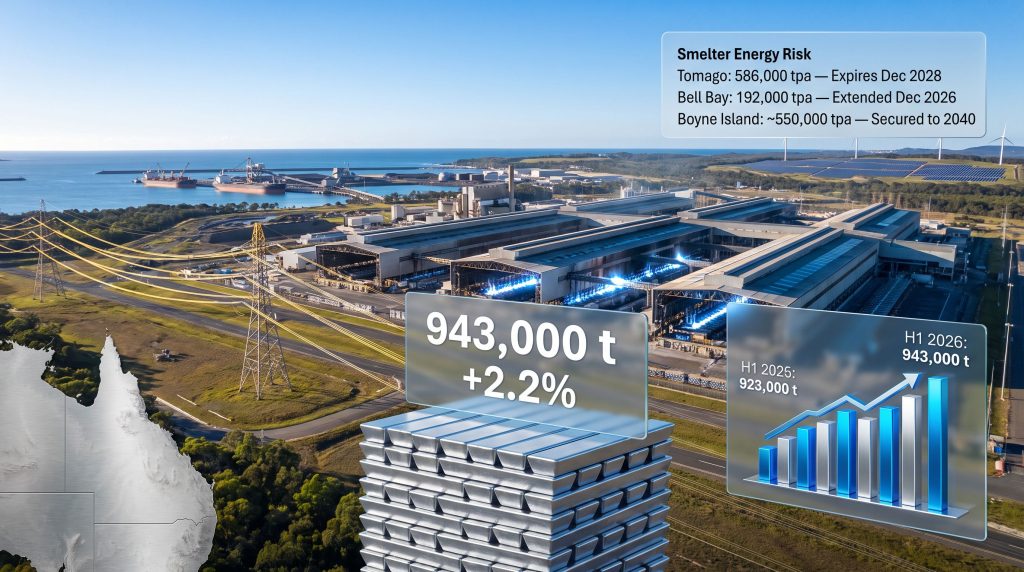
The region's first-half output climbed from 923,000 tonnes in H1 2025 to 943,000 tonnes in H1 2026, marking the strongest first-half result across the comparable periods tracked. Both constituent quarters contributed to this improvement on a year-on-year basis, which is a meaningful structural positive given the disruptions that characterised the opening months of the year.
| Metric | Value |
|---|---|
| H1 2026 Total Output | 943,000 tonnes |
| H1 2025 Total Output | 923,000 tonnes |
| Year-on-Year Change | +2.2% |
| Q1 2026 Output | 467,000 tonnes |
| Q2 2026 Output | 476,000 tonnes |
| Q-o-Q Recovery (Q1 to Q2) | +1.9% |
| Q4 2025 Output (Reference) | 481,000 tonnes |
| Q1 2025 Output | 458,000 tonnes |
| Q2 2025 Output | 465,000 tonnes |
The sequential story across quarters is equally informative. Output fell from 481,000 tonnes in Q4 2025 to 467,000 tonnes in Q1 2026, a 2.9% quarter-on-quarter contraction, before recovering to 476,000 tonnes in Q2 2026, representing a 1.9% sequential improvement. Despite the recovery, Q2 2026 output remained approximately 1.0% below the Q4 2025 reference level, a gap that carries implications for H2 momentum.
According to global primary aluminium production statistics, regional trends in Oceania reflect broader shifts in global smelter economics, making this performance particularly noteworthy for industry analysts.
The Q2 2026 result of 476,000 tonnes was the highest single-quarter output across all comparable periods shown, anchoring a first-half result that demonstrates genuine underlying resilience rather than a statistical artefact.
Why Q1 2026 Fell Short: Unpacking the Upstream Disruption Chain
The Q1 2026 decline requires careful interpretation. On the surface, a drop from 481,000 tonnes to 467,000 tonnes looks significant. In practice, it was driven by a convergence of external shocks and mechanical calendar effects rather than any deterioration in smelter operating capability.
Bauxite Under Pressure: The Cascading Weather Effect
The disruption chain began at the mine mouth. Heavy rainfall across northern Australian bauxite mining regions during January and February 2026 constrained extraction volumes and disrupted the logistics networks that move raw material from pit to port. This was followed by Tropical Cyclone Narelle's landfall in March, which amplified the pressure on bauxite haulage operations and port scheduling.
Rio Tinto's Weipa operations in Queensland sit at the heart of this supply chain. Weipa is one of the largest bauxite mines in the world by output, and any sustained disruption to its extraction or shipping schedules has measurable downstream consequences. While Rio Tinto characterised its integrated aluminium business as operationally resilient through the period, the factual record shows that raw material availability was constrained across the opening quarter.
The Alumina Feedstock Bottleneck
Bauxite disruption does not affect smelters directly. Instead, it flows through alumina refineries first. Alumina, the intermediate oxide compound refined from bauxite, is the feedstock from which aluminium is produced electrolytically. When bauxite supply tightens, refinery throughput falls, and the reduced alumina output eventually constrains what smelters can produce downstream.
This feedstock dependency creates a lag dynamic that is not always visible in single-quarter data. Pacific alumina refineries reported temporary output reductions during Q1 2026 as a result of the upstream bauxite constraints. In addition, an alumina joint venture announced earlier in the year highlighted how the sector is restructuring to better manage these supply chain vulnerabilities. Refinery operations then normalised ahead of Q2, which is a key reason the downstream smelter recovery materialised as quickly as it did.
Calendar Mechanics and Daily Rate Stability
A frequently overlooked factor in quarterly aluminium production comparisons is the number of days in each quarter. Q1 contains 90 calendar days versus 92 in Q4, a difference that mechanically reduces total production tonnage even when daily operating rates are unchanged. In Q4 2025 and Q1 2026, daily average output held steady at approximately 5,200 tonnes per day across both quarters. This consistency confirms that the headline decline in quarterly tonnage was not a symptom of smelter underperformance or capacity reduction.
This distinction matters enormously for analysts and investors interpreting production data. Raw quarterly tonnage can mislead; daily average production rates offer a structurally cleaner signal of operational health. Consequently, aluminium production cycles and their historical context are essential reading for anyone seeking to properly contextualise these movements.
Month-by-Month: Reading the Recovery Curve
The monthly production breakdown provides granular visibility into how the disruption and recovery sequence played out through H1 2026.
| Month | Output (tonnes) | M-o-M Change |
|---|---|---|
| January 2026 | 164,000 | Reference |
| February 2026 | 144,000 | -12.2% |
| March 2026 | 159,000 | +10.4% |
| April 2026 | 156,000 | -1.9% |
| May 2026 | 161,000 | +3.2% |
| June 2026 | 159,000 | -1.2% |
February's 12.2% month-on-month decline stands out as the most acute single-month disruption across the entire first half. This aligns directly with the peak intensity of rainfall events and the compounding effect of February being the shortest calendar month of the year. The two factors reinforced each other to produce an outsized downward reading.
The 10.4% rebound in March confirmed that once weather conditions normalised, operational recovery was rapid. Smelters did not require extended ramp-up periods, which is consistent with the finding that daily production rates had remained stable throughout. April through June then settled into a relatively tight band between 156,000 and 161,000 tonnes per month, signalling a return to normalised throughput rather than continued volatility.
This stabilisation band in Q2 is analytically significant. It suggests Oceania's smelter network has a consistent underlying run-rate of approximately 520,000 to 525,000 tonnes per quarter when operating without external disruption, a figure that provides a useful baseline for H2 2026 forecasting.
Year-on-Year Comparison: Both Quarters Delivered Growth
| Quarter | 2025 Output | 2026 Output | Y-o-Y Change |
|---|---|---|---|
| Q1 | 458,000 t | 467,000 t | +2.0% |
| Q2 | 465,000 t | 476,000 t | +2.4% |
| H1 Total | 923,000 t | 943,000 t | +2.2% |
The consistency of growth across both quarters is important context. A first-half gain driven entirely by a single strong quarter would be more easily dismissed as timing-related. The fact that Q1 2026 outpaced Q1 2025 despite significant weather disruption suggests that the region's baseline production capacity has genuinely expanded, either through incremental efficiency gains, reduced maintenance downtime, or modest capacity additions at existing facilities.
The Energy Equation: Oceania's Structural Vulnerability
Production statistics tell part of the story. The longer-term narrative for Oceania's aluminium industry is defined by something more fundamental: electricity. Power costs typically represent between 30% and 40% of total primary aluminium production costs, making electricity pricing the single most influential variable in smelter economics. Oceania's competitive position has historically rested on access to affordable baseload power, but that foundation is shifting rapidly.
Tomago Aluminium: A 586,000-Tonne Facility Facing a 2028 Deadline
Tomago Aluminium's smelter in New South Wales is the largest aluminium smelter in Australia by capacity, producing approximately 586,000 tonnes per year. Its current electricity supply agreement expires in December 2028, creating a medium-term planning horizon that is now actively shaping investment decisions.
Negotiations with both the Australian federal government and the New South Wales state government are focused on securing a long-term renewable power solution to maintain operations beyond 2028. Alongside these discussions, Tomago has committed to investing at least AUD 1 billion over the next decade in capital expenditure, major maintenance programmes, and decarbonisation initiatives. This capital commitment serves a dual purpose: it demonstrates the operational seriousness required to attract government engagement on power supply, and it creates the platform for incremental capacity expansion if favourable power terms are secured.
Bell Bay: A Near-Term Reprieve with Unresolved Long-Term Questions
Rio Tinto's Bell Bay smelter in Tasmania operates with a nameplate capacity of approximately 192,000 tonnes per year and represents one of the older operational smelters in the Oceania portfolio. The facility faced a genuine near-term closure risk when its power supply contract was approaching expiry at the end of 2025.
The Tasmanian government's decision to extend the contract through December 2026 removed the immediate threat but did not resolve the underlying question of what comes next. Bell Bay's situation illustrates a dynamic that is often underappreciated in industry discussions: power contract negotiations for smelters involve government energy policy, grid reliability considerations, renewable energy targets, and the regional economic weight of a major industrial employer.
Boyne Island: A AUD 2 Billion Blueprint for Long-Term Security
The most advanced resolution to the energy security challenge in Oceania's aluminium sector involves the Boyne Island smelter in Queensland. Gladstone aluminium repowering is central to this effort, with Rio Tinto, the Australian federal government, and the Queensland state government announcing a AUD 2 billion tripartite investment partnership to secure the smelter's future through 2040. The investment is explicitly directed toward strengthening renewable electricity supply and maintaining competitive operations.
The Boyne Island framework is instructive as a structural model. It demonstrates that long-term smelter viability in a decarbonising energy environment requires coordinated capital commitment from both industry and government, and that the financial scale involved is substantial.
Comparative Energy Risk Profile
| Smelter | Capacity (tpa) | Power Contract Status | Key Risk Horizon |
|---|---|---|---|
| Tomago Aluminium | 586,000 | Expires December 2028 | Medium-term |
| Bell Bay (Rio Tinto) | 192,000 | Extended to December 2026 | Near-term |
| Boyne Island (Rio Tinto) | ~550,000 | Secured to 2040 (AUD 2B deal) | Long-term resolved |
The next major ASX story will hit our subscribers first
The Green Aluminium Premium: An Emerging Market Dynamic
One dimension of the energy transition that receives less attention in production-focused reporting is the potential pricing upside from low-carbon aluminium certification. As decarbonisation commitments intensify across automotive, aerospace, and packaging supply chains, end-users are increasingly willing to pay a price premium for aluminium produced using verified renewable energy sources.
Renewable energy solutions are increasingly central to how operators are positioning for this shift, with green metals leadership emerging as a strategic priority for Australia. However, the short-term cost of transitioning from legacy coal-linked power agreements to new renewable supply structures is substantial.
Whether a green aluminium premium materialises at sufficient scale to justify the capital required remains genuinely uncertain, and investors should treat forward-looking assessments in this area with appropriate caution. According to an aluminium decarbonisation explainer, the path to certified low-carbon production involves significant technical and commercial complexity that will shape competitive outcomes well beyond 2030.
Disclaimer: Projections relating to green aluminium pricing premiums, future power contract terms, and production capacity outcomes involve significant uncertainty. These forward-looking assessments are not guarantees of future performance and should not be relied upon as the basis for investment decisions.
Three Scenarios for Oceania's Production Trajectory Through 2030
Scenario 1: Successful Energy Transition (Base Case)
- Tomago Aluminium secures a long-term renewable power agreement before the December 2028 deadline
- Bell Bay navigates to a viable successor power contract through 2026 and beyond
- Boyne Island's AUD 2 billion investment delivers on decarbonisation and competitiveness targets
- Outcome: Stable to modestly growing regional production, with incremental efficiency gains partially offsetting higher renewable energy costs during the transition period
Scenario 2: Partial Contract Resolution (Moderate Risk)
- One major smelter, most likely Bell Bay given its shorter contract runway, fails to secure economically viable long-term power supply
- Capacity rationalisation reduces Oceania's total output by 150,000 to 200,000 tonnes per year
- Outcome: Regional production plateaus or contracts; premium-grade aluminium export volumes tighten; supply gaps emerge for high-specification downstream markets
Scenario 3: Accelerated Decarbonisation Investment (Upside)
- Renewable energy costs in Australia decline faster than current projections
- Government co-investment frameworks expand beyond current confirmed commitments
- Green aluminium certification attracts end-user offtake agreements at premium pricing
- Outcome: Oceania emerges as a globally competitive low-carbon aluminium producer, potentially attracting new downstream processing investment and expanding the regional value chain
Frequently Asked Questions
What was Oceania's total primary aluminium output in H1 2026?
Oceania produced approximately 943,000 tonnes of primary aluminium in the first half of 2026, a 2.2% increase from 923,000 tonnes recorded in H1 2025. The top aluminium producers operating in the region all contributed to this positive outcome.
Why did production decline between Q4 2025 and Q1 2026?
The sequential fall from 481,000 tonnes to 467,000 tonnes reflected a combination of weather-driven upstream disruptions, including heavy rainfall at Weipa and the impact of Tropical Cyclone Narelle, temporary alumina feedstock constraints, and the mechanical effect of Q1 containing two fewer calendar days than Q4.
Did smelter operating efficiency actually deteriorate in Q1 2026?
No. Daily average production rates held at approximately 5,200 tonnes per day across both Q4 2025 and Q1 2026, confirming the lower quarterly total was driven by external factors rather than any reduction in operational performance.
What is the most significant structural risk for Oceania's aluminium industry?
Securing competitively priced, long-term electricity supply is the defining challenge. Power contracts at Tomago and Bell Bay expire within the next two years, and replacing legacy agreements with viable renewable energy structures requires substantial capital and sustained government engagement.
How much capital is being committed to Oceania's smelters?
Confirmed commitments include at least AUD 1 billion at Tomago Aluminium over the next decade and a AUD 2 billion tripartite partnership at Boyne Island to maintain operations through 2040.
What drove the Q2 2026 production recovery?
The 1.9% sequential improvement in Q2 reflected upstream bauxite supply normalisation following the end of the cyclone season, recovery of Pacific alumina refinery operations, and the absence of the weather-related disruptions that constrained Q1 throughput. Oceania primary aluminium production rose 2.2% in H1 overall, demonstrating this recovery was sustained across the period.
Key Takeaways
- Headline result: 943,000 tonnes in H1 2026, up 2.2% year-on-year, marking the strongest first-half output across the comparable tracked period
- Disruption was transient and externally driven: Daily production rates held stable at 5,200 tonnes per day throughout Q1, confirming no structural impairment
- Monthly recovery was decisive: The 10.4% rebound in March following February's 12.2% decline confirmed rapid operational normalisation once weather events cleared
- Energy is the defining long-term variable: Power contract timelines at Tomago (2028) and Bell Bay (2026) represent material production risk factors for the H2 2026 through 2030 period
- Capital commitment is substantial: Combined confirmed investment across Tomago and Boyne Island exceeds AUD 3 billion, signalling that major producers are treating Oceania smelter continuity as a strategic priority
- The decarbonisation pathway creates both risk and opportunity: Higher transition costs must be weighed against the potential for green aluminium pricing premiums as end-user demand for certified low-carbon metal intensifies
This article is based on industry production data and publicly available company disclosures. It is intended for informational purposes only and does not constitute financial or investment advice. Forward-looking statements regarding production trajectories, energy contract outcomes, and pricing dynamics involve material uncertainty and should not be relied upon as predictions of future performance.
Want to Track the Next Major ASX Minerals Discovery Before the Market Moves?
Discovery Alert's proprietary Discovery IQ model delivers real-time alerts on significant ASX mineral discoveries, translating complex data across more than 30 commodities into clear, actionable insights — giving subscribers an immediate edge in fast-moving markets. Explore how historic discoveries have generated substantial returns on Discovery Alert's dedicated discoveries page, and begin your 14-day free trial today to position yourself ahead of the broader market.