May 12, 2026
The Hidden Profit Machine: Why Production-Stage Gold Equities Still Trade at a Discount
Equity markets have a well-documented tendency to lag behind fundamental reality. When earnings improve sharply and quickly, institutional capital rarely rushes to reprice a sector overnight. Instead, it moves methodically, demanding proof across multiple reporting cycles before committing capital at higher multiples. This behavioural pattern, sometimes called the earnings lag, has created one of the more unusual conditions in the current resources market: production-stage gold equities generating the widest operating margins in modern mining history are simultaneously trading at meaningful discounts to their peer groups.
Understanding how that gap forms, what sustains it, and what could close it is essential context for any investor evaluating the gold equities space in 2026. The gold price forecast for the period ahead adds further weight to this analysis.
When big ASX news breaks, our subscribers know first
What "Production-Stage" Actually Means and Why the Classification Matters
The term production-stage is not merely descriptive. For investors, it carries a specific set of risk and return implications that separate this category of company from exploration and development-stage peers in meaningful ways.
A production-stage gold company is one that is actively extracting ore, processing it through its metallurgical facilities, and selling the resulting gold into the market. Revenue is real, cash flow is observable, and the fundamental question of whether the ore body actually exists has already been answered.
Contrast this with an exploration-stage company, which is still searching for economically viable deposits, or a development-stage company, which has confirmed its resource but has not yet built the infrastructure to process it. The different gold mining stock types each carry their own risk and return profiles worth understanding before committing capital.
The practical implications for investors include:
- Revenue and cash flow are current, not projected, making financial analysis grounded in observable data rather than modelled assumptions
- Operational risk is substantially lower than pre-production stages because the processing infrastructure exists and has been demonstrated to work
- Dividend capacity exists at this stage in ways that earlier-stage companies structurally cannot offer
- Self-funded expansion becomes possible when operating margins are wide, reducing reliance on equity issuance that dilutes existing shareholders
- Valuation is driven by earnings multiples, whereas development and exploration stages are priced primarily on resource estimates and discovery potential
The shift from a resource-discovery story to an earnings-delivery story fundamentally changes the analytical framework investors should apply. Production-stage gold equities are evaluated on the same terms as any profitable industrial business, yet they carry the additional optionality of exposure to gold price movements.
The Structural Disconnect: Record Cash Flow Meets Compressed Valuations
Understanding the Valuation Gap in Gold Mining Equities
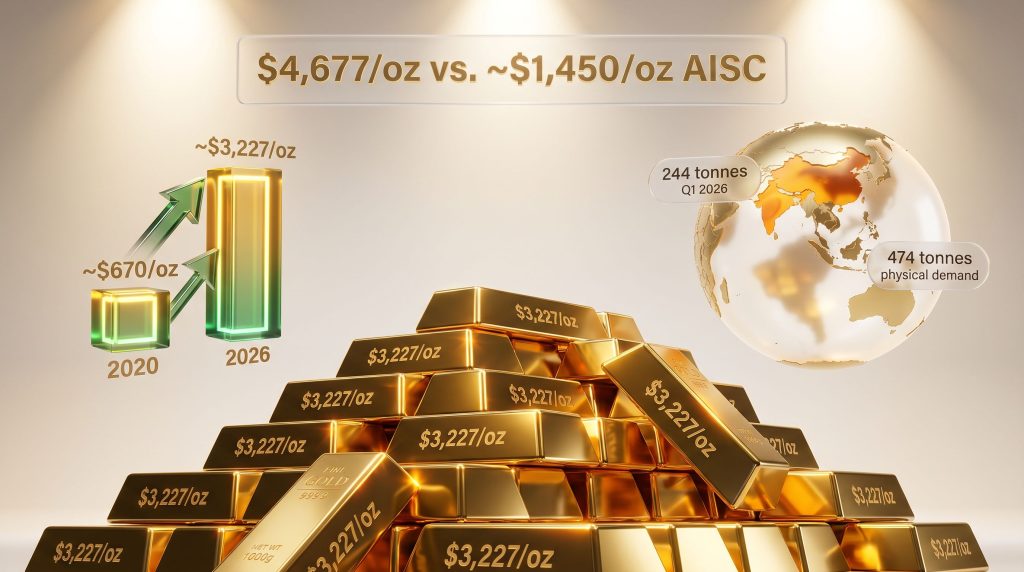
Gold traded at approximately $4,677/oz as of May 11, 2026, according to the World Gold Council and LBMA data, representing a decline of more than 10% from the January 2026 peak of $5,405/oz but remaining dramatically above the industry median all-in sustaining cost (AISC) of approximately $1,450/oz. The arithmetic of this spread is significant: producers operating below that cost threshold are generating gross profit of approximately $3,227 per ounce mined and sold, a figure with no precedent in the modern gold mining era.
Yet several production-stage gold equities are trading at 2026 estimated EV/EBITDA multiples of approximately 1.9x, compared to a peer-group average of 3.1x, implying a discount of roughly 39% on an earnings and cash flow basis. This gap is not explained by asset quality; Price-to-Net Asset Value (P/NAV) ratios for these producers sit broadly in line with peers at approximately 0.6x versus a peer average of 0.5x. The market is not dismissing the underlying ore bodies. It is discounting the perceived sustainability and repeatability of current earnings.
Several factors contribute to this lag:
- Many institutional valuation models were constructed using long-term gold price assumptions of $1,500 to $2,000/oz, which leaves current earnings structurally underrepresented in consensus estimates
- Smaller production-stage operators often lack the analyst coverage and trading liquidity that would accelerate institutional repricing
- Investors who experienced margin compression during prior gold cycles apply elevated scepticism to elevated margin figures, waiting for multi-quarter confirmation before adjusting their price targets
Furthermore, undervalued mining stocks in this space often remain overlooked precisely because legacy models fail to capture the scale of today's margin expansion.
What Is Driving Gold Prices Above $4,600/oz in 2026?
Central Bank Accumulation: The Demand Floor That Doesn't Flinch
The demand architecture underpinning gold prices at current levels differs materially from earlier bull cycles, which were frequently driven by speculative investment flows and ETF accumulation that could reverse quickly. The 2025–2026 cycle has been shaped more significantly by structural sovereign demand.
Central bank gold demand reached 244 tonnes on a net basis in Q1 2026, according to World Gold Council data. This figure was 3% above Q1 2025, exceeded both the prior quarter and the five-year quarterly average, and represents a continuation of a multi-year trend that began accelerating meaningfully after 2022. JPMorgan's commodities research projects 755 tonnes of full-year 2026 central bank purchases, well above the pre-2022 annual average of 400 to 500 tonnes.
What makes central bank demand structurally important is its insensitivity to short-term price movements. Reserve managers are not trading gold for return maximisation; they are diversifying reserve portfolios away from US dollar exposure, a motivation that does not dissolve when spot prices dip 10% from a peak.
Physical bar and coin demand reinforced this picture, reaching 474 tonnes in Q1 2026, a 42% year-on-year increase and the second-highest quarterly total on record. Asian retail investors were identified as the primary driver of this demand surge, reflecting a culturally embedded preference for physical gold ownership that tends to intensify during periods of currency and geopolitical uncertainty.
The Mine Supply Constraint That Cannot Be Fixed Quickly
On the supply side, the structural picture is equally supportive of elevated prices. Total global gold mine production declined 8.64% quarter-on-quarter in Q1 2026 to 1,230.9 tonnes, according to World Gold Council data. This decline reflects the inherent inertia of the mining industry: new mines simply cannot be built quickly, regardless of how attractive the economics appear.
The timeline from initial discovery through exploration, feasibility studies, permitting, construction, and commissioning typically spans 10 to 15 years for a greenfield gold project. Even simplified brownfield expansions commonly require three to five years from approval to meaningful production contribution.
This structural reality means that gold prices cannot stimulate sufficient new supply within any investment-relevant timeframe, a characteristic that distinguishes gold from many industrial commodities where supply responses are faster. As noted in recent analysis of constrained mine supply, this constraint is a key driver of margin expansion for existing producers.
The combination of demand growth exceeding pre-2022 historical averages and declining quarterly mine output creates a physical market dynamic that provides a durable floor beneath gold prices, even as speculative positioning fluctuates.
Institutional Price Targets and What They Imply for Producer Margins
| Institution | Year-End 2026 Gold Price Target | Implied Upside from ~$4,677/oz |
|---|---|---|
| JPMorgan | $5,000/oz | ~+6.9% |
| Goldman Sachs | $5,400/oz | ~+15.5% |
| Broader Analyst Forecasts | Up to $6,000/oz | ~+28.3% |
Even at the more conservative end of these institutional projections, each incremental dollar increase in gold above a producer's AISC flows almost entirely into operating cash flow. The operating leverage mathematics of gold mining mean that a 6.9% increase in gold price for a producer with fixed costs translates to a disproportionately larger percentage increase in earnings per share.
How the Gold Price-to-Cost Relationship Works: Operating Leverage in Practice
Understanding AISC and Why It Is the Right Benchmark
Before examining specific producer economics, it is worth clarifying why All-In Sustaining Cost (AISC) is the appropriate profitability metric for gold companies. Cash cost, which covers only direct mining and processing expenses, understates the true economic burden of maintaining a mine in continuous production.
AISC adds sustaining capital expenditure, royalties, corporate overhead, and ongoing maintenance capital, providing a complete picture of what it actually costs to keep an ounce coming out of the ground each year. The relationship between the gold price and mining equities becomes most apparent when examining how this cost structure interacts with current spot prices.
The evolution of industry-wide AISC and the expanding margin it has generated at rising gold prices is illustrated below:
| Gold Price Environment | Industry Median AISC | Gross Margin Per Ounce |
|---|---|---|
| 2020 (~$1,770/oz) | ~$1,100/oz | ~$670/oz |
| 2022 (~$1,800/oz) | ~$1,100–$1,200/oz | ~$600–$700/oz |
| 2024 (~$2,300/oz) | ~$1,350–$1,450/oz | ~$850–$950/oz |
| 2026 (~$4,677/oz) | ~$1,450/oz | ~$3,227/oz |
Source: World Gold Council; LBMA; Crux Investor Analysis
The critical observation from this table is that AISC has risen approximately 32% from 2020 to 2024, largely reflecting higher energy, labour, and input costs. The gold price over the same period rose approximately 164%. This asymmetry between revenue growth and cost growth is what drives the dramatic expansion in gross margin per ounce.
The Fixed Cost Advantage
A significant portion of gold mining costs are fixed once a mine reaches steady-state production. Power infrastructure, processing facilities, permitting, site management, and core labour are all expenses that remain broadly stable regardless of whether the gold price is at $2,000 or $4,677.
This means every dollar gold moves above a mine's AISC contributes disproportionately to cash flow, a mechanism known as operating leverage. Schroders has described this dynamic as part of a quiet boom in gold equities, highlighting how fixed-cost structures amplify the earnings benefit of rising gold prices.
Serabi Gold illustrates this dynamic clearly. The company reported full-year 2025 cash costs of $1,437/oz and AISC of $1,816/oz against an average realised price of $3,481/oz, generating strong margins even before the more recent gold price appreciation. At a spot price of approximately $4,677/oz, the implied operating margin for Serabi rises to approximately $2,861/oz, which is roughly 71.8% above the margin it generated on its 2025 average realised price. The cost base has not changed materially; the gold price did.
How Production-Stage Gold Companies Are Deploying Record Cash Flow
From Debt-Dependent Growth to Self-Funded Expansion
One of the less-discussed consequences of the current margin environment is the structural shift in how production-stage gold companies are funding growth. In prior gold bull cycles, mine expansions and development pipelines were typically funded through a combination of debt facilities and equity raises. Shareholders tolerated dilution as a cost of participation in growth. That model has shifted.
Several production-stage operators are now generating sufficient free cash flow to fund:
- First-time dividend programmes, signalling that free cash flow has reached a genuine surplus above reinvestment requirements
- Processing infrastructure expansions at existing, permitted operations
- Pre-production expenditures at adjacent development projects
- Balance-sheet strengthening through cash accumulation rather than leverage
Inaugural dividends deserve particular attention as an analytical signal. A company announcing its first dividend is communicating, in the most unambiguous financial terms available, that operating cash flow has reached a level where shareholder returns can be funded simultaneously with reinvestment. This contrasts sharply with development-stage peers that are structurally years away from any cash distribution.
Mill Capacity Expansion: The Capital-Efficient Growth Path
One of the most operationally effective and capital-efficient growth strategies available to production-stage operators is incremental processing capacity expansion at an existing, permitted facility. This approach carries materially lower risk than greenfield mine construction for several reasons:
- The land, environmental permits, water rights, and operational approvals are already secured
- Grid power and site infrastructure are in place and paid for
- Engineering teams are familiar with the specific characteristics of the ore body being processed
- Equipment procurement lead times are shorter, particularly when repurposing existing assets
Serabi Gold is executing precisely this strategy with a targeted fourth ball mill commissioning in Q4 2026, which would raise processing capacity at Palito to 330,000 tonnes per year. The total capital cost for this expansion is estimated at US$5 million, funded entirely from operating cash flow, with no equity dilution required.
Serabi's CEO Mike Hodgson has identified the business as having been plant-constrained, with mill expansion representing the clearest pathway toward production growth toward 70,000 to 80,000 ounces annually. Repurposing equipment previously designated for the Coringa project reduces both procurement lead times and execution risk, demonstrating how capital efficiency can be maximised within an existing operational footprint.
Self-Funded Development: Reaching Production Without Dilution
Integra Resources provides a compelling case study in self-funded development pipeline advancement. The company held $105.8 million in cash at March 31, 2026, up from $63.1 million at year-end 2025, a $42.7 million increase in a single quarter. This cash is being deployed into DeLamar Project pre-production work, including a $3.4 million deposit to Idaho Power for power infrastructure and a $12.5 million land acquisition.
Integra generated a 40% operating margin in Q1 2026 at an average realised gold price of $4,854/oz. The company's CEO George Salamis has framed the possibility that sufficient cash generation at current margins could allow the project to reach completion without requiring major equity dilution. For existing shareholders, this scenario would be meaningfully positive, as it preserves ownership percentages through the highest-value development phase.
The ability to self-fund a mine development pipeline from operating cash flow represents one of the most shareholder-friendly outcomes possible in the gold mining sector. It collapses the traditional trade-off between growth and dilution that has historically defined junior and mid-tier producer investing.
The next major ASX story will hit our subscribers first
Why Processing Infrastructure Ownership Is a Margin Multiplier
The Recovery Rate Gap: Third-Party Toll Milling vs. Owner-Operated Processing
One of the least visible but most financially significant structural differences between production-stage gold companies lies in who owns and operates the processing infrastructure. This variable can determine whether a company captures 55% or 92% of the gold it mines, a difference that flows directly and entirely into operating margins.
Companies that ship ore to third-party toll millers typically receive payment for only 55% to 60% of the gold contained in the ore delivered. The remainder is retained by the processor as payment for the service, or lost to metallurgical inefficiency in processing ore types that the facility was not optimised to handle. This margin leakage persists regardless of the gold price; it is structural rather than cyclical.
Owner-operated processing infrastructure, particularly pressure oxidation (POX) technology designed for refractory ore types, can increase gold recovery rates to approximately 92%. This represents a 32 to 37 percentage point improvement over toll milling arrangements. At any gold price level, this improvement translates directly into additional ounces sold and additional revenue retained.
Understanding Pressure Oxidation Technology
POX technology is specifically engineered to unlock gold that is chemically locked within sulphide mineral matrices, a type of ore deposit described as refractory because it resists conventional processing methods. In refractory ore, gold particles are physically encapsulated within pyrite or arsenopyrite crystals. Conventional cyanide leaching cannot access the gold until the sulphide minerals are first broken down.
POX achieves this oxidation under elevated temperature and pressure conditions, liberating the gold for subsequent recovery. The significance of this for investors is that refractory ore deposits are common in Nevada and other major gold-producing regions, and companies that own permitted POX infrastructure hold a processing advantage that cannot be easily replicated by competitors. Permitted POX facilities are rare, expensive to build, and subject to stringent environmental review requirements.
i-80 Gold's Lone Tree Transformation
i-80 Gold is currently refurbishing the fully permitted Lone Tree processing facility in Nevada with the explicit objective of eliminating third-party toll milling dependency. The company's COO Paul Chawrun has indicated that the refurbishment capital estimate of US$430 million is underpinned by a Level 3 engineering study, with the vast majority of the components at Level 2 engineering confidence.
This level of engineering study typically provides cost accuracy within a 10 to 20% range, which is meaningfully more reliable than the preliminary economic assessments commonly referenced in the junior mining sector. At a gold price of US$3,000/oz (well below current spot) and annual production of 150,000 to 160,000 ounces, the transition from toll milling at 55% to 60% recovery to owner-operated POX at approximately 92% recovery is projected to generate US$150 million to US$200 million in annual net cash flow against that US$430 million capital cost. The implied payback period at those projections is approximately two to three years.
Satellite Ore Sources and Existing Mill Utilisation
A related capital-efficiency strategy involves routing high-grade ore from a satellite deposit to an already-permitted but under-utilised processing facility. West Red Lake Gold Mines is advancing the Rowan Project as a high-grade satellite ore source for the Madsen mill, which holds a permitted capacity of 800 tonnes per day and was operating at 685 tonnes per day in early Q2 2026, leaving meaningful spare capacity available.
The Rowan Project holds an NI 43-101 Indicated resource of 196,747 ounces at 12.78 grams per tonne (g/t) gold, a grade that would be considered high quality in virtually any global gold jurisdiction. For context, the global average grade of operating gold mines has declined steadily over recent decades to approximately 1 to 1.5 g/t, making a 12.78 g/t resource particularly valuable from a processing economics standpoint. Higher grade ore requires less material to be moved and processed per ounce recovered, directly reducing per-ounce costs.
The standalone Rowan PEA reported an NPV of $125 million and an IRR of 42% against a $70 million capital estimate. The combined Madsen-Rowan Pre-Feasibility Study is targeted for Q3 2026. CEO Shane Williams has described a pathway to 150,000 ounces annually at Red Lake, with the Madsen mill capable of being scaled up to meet that production level with relatively modest incremental capital.
What the Valuation Discount Reveals About Re-Rating Potential
EV/EBITDA Multiples: Where the Sector Stands
| Metric | Selected Producer (Serabi Gold) | Peer Average |
|---|---|---|
| 2026E EV/EBITDA | 1.9x | 3.1x |
| Price-to-NAV (P/NAV) | 0.6x | 0.5x |
| Valuation Discount (EV/EBITDA) | ~39% below peers | — |
Source: Crux Investor Analysis
The divergence between the EV/EBITDA discount and the P/NAV comparison is analytically revealing. When a company trades at a discount to peers on earnings multiples but at a comparable level on asset value, the market is not questioning the quality or size of the underlying resource. It is questioning whether current earnings are repeatable. This is a meaningfully different problem to solve, and one that can be addressed through operational consistency rather than capital restructuring or geological work.
Serabi Gold reported full-year 2025 EBITDA of $77.9 million, a 117% year-on-year increase driven by higher gold prices and continued production. The company has also commenced dividend payments, providing a concrete signal that free cash flow has reached a sustainable surplus. The disconnect between this financial performance and the 39% EV/EBITDA discount to peers reflects the earnings lag dynamic discussed earlier.
The Catalyst Calendar: H2 2026 Milestones That Could Close the Gap
| Company | Target Milestone | Timing |
|---|---|---|
| Serabi Gold | Fourth ball mill commissioning | Q4 2026 |
| Integra Resources | Florida Canyon technical report and DeLamar Notice of Intent | Q3 2026 |
| West Red Lake Gold Mines | Madsen-Rowan Pre-Feasibility Study | Q3 2026 |
| i-80 Gold | First gold from Archimedes Underground, continued Lone Tree construction | H2 2026 |
Institutional investors typically require two to four consecutive quarters of earnings delivery before repricing equities toward peer multiples. Companies entering H2 2026 with strong Q1 and Q2 results are approaching the threshold at which re-rating becomes statistically more likely, assuming operational execution remains consistent.
The Investment Case: Current Fundamentals Rather Than Price Forecasts
Comparing Risk Profiles Across Development Stages
| Risk Factor | Production-Stage | Development-Stage | Exploration-Stage |
|---|---|---|---|
| Revenue generation | Active | None | None |
| Cash flow visibility | High | Low | None |
| Dilution risk | Lower (self-funded possible) | Higher | Highest |
| Operational risk | Moderate (ongoing) | High (construction) | Moderate |
| Valuation driver | Earnings multiple | NAV/resource | Discovery premium |
| Dividend potential | Emerging | None | None |
A critical insight for investors in the current environment is that production-stage gold equities do not require gold to return to the January 2026 peak of $5,405/oz to generate compelling economics. At approximately $4,677/oz, the sector is already producing positive EBITDA, funding dividends, and self-financing expansion programmes. The investment thesis is grounded in observable, current-period cash flows, not in optimistic price scenarios.
This represents a departure from how junior gold equities have historically been pitched to retail investors. The traditional narrative emphasised leverage to gold price appreciation, a speculative proposition dependent on future price movements. However, the current argument for production-stage names is fundamentally different: these businesses are already highly profitable at today's prices, and institutional capital has simply not yet fully recognised that profitability.
Key Risks Investors Should Evaluate
No investment case is complete without an honest assessment of downside scenarios. The following risks apply across the production-stage gold sector:
- Gold price risk: A sustained decline in spot gold compresses margins and reduces free cash flow available for dividends and expansion. The entire thesis weakens if gold reverts toward $3,000 or below
- Operational risk: Equipment failures, unexpected ore grade variability, labour disruptions, and processing inefficiencies can all reduce production below guidance, directly affecting earnings
- Regulatory and permitting risk: Changes in environmental regulation, Indigenous land rights determinations, or government policy in mining jurisdictions can affect operational continuity
- Currency risk: Producers earning revenue in US dollars against costs partly denominated in local currencies face exchange rate exposure that can affect reported margins
- Concentration risk: Single-asset producers face outsized business impact from any disruption at their sole operating mine, making diversification across multiple sites preferable from a risk management standpoint
- Capital cost risk: For producers undertaking major processing infrastructure investments, actual construction costs may exceed engineering estimates, particularly at earlier confidence levels
Frequently Asked Questions: Production-Stage Gold Equities
What distinguishes a production-stage gold company from a development or exploration company?
A production-stage gold company is actively mining, processing, and selling gold, generating real revenue and cash flow from existing operations. Development-stage companies have defined a resource and are progressing toward production but are not yet generating mining revenue. Exploration-stage companies are still identifying whether economically viable gold deposits exist. For investors, the production stage represents the lowest operational uncertainty within the mining lifecycle, with the resource proven and the processing infrastructure already generating income.
Why do production-stage gold stocks sometimes trade at a discount even during periods of record margins?
Equity markets update valuations conservatively. Even when a company's earnings improve sharply, institutional capital often waits for multiple quarters of consistent delivery before adjusting price targets upward. Additionally, smaller producers are frequently evaluated using gold price assumptions embedded in older models that do not reflect current spot prices. This creates a structural lag between fundamental improvement and market recognition, a gap that historically narrows as earnings consistency is demonstrated over time.
What makes a high gold grade, like Rowan's 12.78 g/t, economically significant?
Grade refers to the concentration of gold within a tonne of ore, expressed in grams per tonne. The global average grade at operating gold mines has declined to approximately 1 to 1.5 g/t over recent decades due to the depletion of higher-grade deposits. A resource grading 12.78 g/t contains roughly 8 to 12 times more gold per tonne of ore than the industry average. This means less material needs to be moved and processed to recover the same number of ounces, directly reducing per-ounce operating costs and improving project economics at any given gold price.
What does a 39% EV/EBITDA discount to peers mean in practical terms?
If a peer group of comparable gold producers trades at an average EV/EBITDA multiple of 3.1x and a specific company trades at 1.9x, the market is assigning approximately 39% less value per dollar of earnings to that company. Consequently, closing this gap through consistent earnings delivery and operational execution would imply a meaningful increase in enterprise value without any change in the underlying gold price or cost structure.
Are inaugural dividends from gold producers a reliable signal of financial health?
First-time dividend announcements indicate that a company's free cash flow has reached a level sufficient to fund both reinvestment and shareholder returns simultaneously. They are a credible signal of financial health when funded from operating cash flow rather than from borrowing or new share issuance. The primary sustainability risk is a significant and sustained fall in the gold price, which would compress margins and reduce the cash available for distributions.
Key Takeaways
- Gold at approximately $4,677/oz against an industry median AISC of approximately $1,450/oz is generating gross margins of approximately $3,227/oz, a historically unprecedented profitability environment for production-stage gold equities
- 244 tonnes of net central bank purchases in Q1 2026, combined with an 8.64% quarter-on-quarter decline in mine production, continue to support tightness in the physical gold market
- Serabi Gold's EBITDA grew 117% year-on-year in 2025, yet its 2026 EV/EBITDA multiple of 1.9x remains 39% below the peer average of 3.1x
- Transitioning from third-party toll milling at 55–60% recovery to owner-operated POX processing at approximately 92% recovery can increase annual net cash flow by US$150 to US$200 million at US$3,000/oz gold, without requiring any increase in the gold price
- High-grade satellite deposits like Rowan, grading 12.78 g/t gold against an industry average of approximately 1 to 1.5 g/t, offer substantially better per-ounce economics when routed to existing permitted processing infrastructure
- Consistent quarterly earnings delivery through H2 2026 is the primary mechanism through which the current EV/EBITDA discount is likely to narrow toward peer-group multiples
Disclaimer: This article is for informational purposes only and does not constitute financial or investment advice. All forecasts, price targets, and projections referenced are those of the named institutions and are subject to change. Past performance of gold prices or mining equities is not indicative of future results. Investors should conduct their own due diligence and consult a licensed financial adviser before making any investment decisions. References to company-specific figures are sourced from publicly available disclosures and third-party analysis.
Further Reading: Investors seeking deeper analysis of production-stage gold equities, producer cost structures, and physical gold market dynamics can access institutional-grade research and company interviews at Crux Investor, which publishes regular analysis covering the gold mining sector across all development stages and geographies.
Want to Know When the Next Major Gold Discovery Hits the ASX?
While production-stage gold equities are generating record margins, the most transformative returns in the sector have historically come from identifying significant new discoveries at the earliest possible moment — precisely what Discovery Alert's proprietary Discovery IQ model is built to do, delivering real-time ASX mineral discovery alerts to subscribers before the broader market has time to react. Explore Discovery Alert's discoveries page to understand how historic ASX mineral discoveries have generated exceptional returns, and begin a 14-day free trial to position yourself ahead of the next major find.