June 30, 2026
Understanding Qatar's Centralised LNG Production Model and Global Supply Dependencies
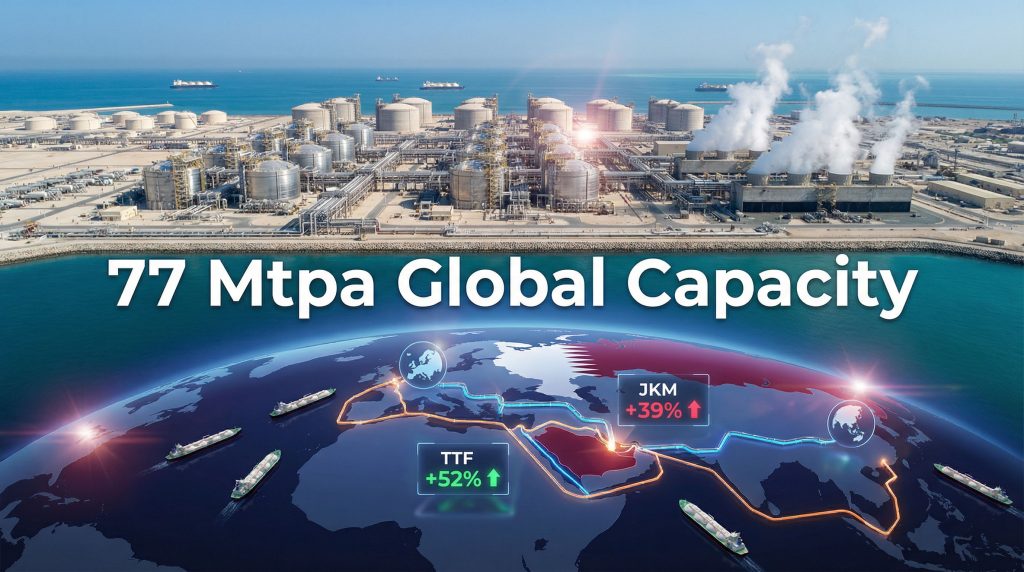
The global liquefied natural gas sector operates through a network of highly concentrated production hubs, with Qatar representing the most significant single point of supply vulnerability in international energy markets. The Qatar LNG production halt demonstrates how centralised infrastructure creates systemic risks extending far beyond regional energy security considerations. The nation's liquefaction infrastructure at Ras Laffan Industrial City encompasses 14 operational trains generating approximately 77 million tonnes per annum (Mtpa) of capacity, representing roughly 20% of worldwide LNG supply.
This centralised production approach, whilst delivering substantial economies of scale, creates systemic risks that extend far beyond regional energy security. Furthermore, when a single facility cluster handles such a massive proportion of global LNG exports, any operational disruption translates into immediate supply constraints affecting multiple continents simultaneously.
Qatar's Infrastructure Specifications and Technical Capabilities
Qatar's liquefaction complex operates as an integrated industrial ecosystem where natural gas from the North Field undergoes processing through sophisticated cryogenic systems. Each production train utilises advanced cooling technology to transform natural gas into liquid form at approximately -162°C (-260°F), enabling efficient maritime transport to global markets.
Table: Qatar's LNG Production Infrastructure Details
| Component | Specification | Current Status |
|---|---|---|
| Operational Trains | 14 units | Fully operational (pre-March 2026) |
| Total Capacity | 77 Mtpa | Active production capacity |
| Planned Expansion | 64 Mtpa additional | Phased development through 2035 |
| Export Distribution | Europe (40%), Asia-Pacific (60%) | Primary market allocation |
| Storage Capacity | Multiple tank systems | Supporting continuous export operations |
The facility's technical sophistication extends beyond basic liquefaction processes. Quality control systems ensure LNG meets specific buyer requirements across different regional markets, while loading terminals accommodate various vessel sizes from standard LNG carriers to specialised transport configurations.
Expansion Project Timeline and Investment Commitments
Qatar's strategic expansion through three major phases demonstrates long-term commitment to maintaining global market leadership. The North Field East (NFE) project targets 32 Mtpa additional capacity with first train operations scheduled for Q3 2026, pending infrastructure integrity assessments following recent disruptions.
North Field South (NFS) development plans include 16 Mtpa capacity targeting first gas delivery between late 2028 and early 2029. Moreover, the North Field West (NFW) expansion received Final Investment Decision approval, adding another 16 Mtpa to Qatar's production portfolio.
These expansion initiatives represent substantial capital commitments exceeding $50 billion across multiple project phases. Additionally, this indicates Qatar's confidence in sustained global LNG demand growth through the 2030s.
When big ASX news breaks, our subscribers know first
Force Majeure Declarations in LNG Operations and Recovery Protocols
Force majeure provisions in LNG supply contracts provide legal protection when extraordinary circumstances prevent contractual obligation fulfilment. The March 2026 Qatar situation illustrates how infrastructure damage from external events necessitates complete operational shutdowns across entire production facilities.
Recent Force Majeure Trigger Events:
- March 2, 2026: Drone strike on Ras Laffan gas facilities
- Complete production halt: All 77 Mtpa capacity offline
- Strait of Hormuz closure: Maritime traffic disruption
- Force majeure declaration: Contractual protection activated
Technical Requirements for LNG Facility Restart Operations
LNG facility restoration involves complex sequential procedures requiring systematic verification of multiple interconnected systems. Consequently, safety protocols mandate comprehensive damage assessment before any equipment reactivation attempts.
Table: LNG Facility Restart Timeline and Technical Requirements
| Restart Phase | Duration Range | Critical Technical Activities |
|---|---|---|
| Safety Assessment | 3-5 days | Infrastructure damage evaluation, gas leak detection, structural integrity verification |
| Equipment Inspection | 5-7 days | Turbine analysis, heat exchanger testing, control system verification, compressor functionality |
| Gradual Restart | 7-14 days | Phased production ramp-up, quality control testing, pressure vessel cycling |
| Full Capacity Achievement | 14-28 days | Complete operational restoration, contract volume delivery capability |
Total Recovery Timeline: 29-54 days maximum for complete facility restoration depending on damage extent and safety verification requirements.
Cryogenic System Restart Complexities
Liquefaction technology requires precise temperature control maintenance throughout restart procedures. Cryogenic equipment must undergo gradual cooling cycles to prevent thermal shock damage, while compression systems need systematic pressure testing before resuming natural gas processing.
Quality assurance protocols mandate LNG composition verification ensuring export products meet international specifications before contract deliveries resume. Export loading facilities require operational confirmation supporting maritime shipment capabilities.
Global Energy Market Interconnection and Price Transmission Mechanisms
The Qatar LNG production halt triggered immediate price responses across multiple energy commodity markets, demonstrating the interconnected nature of global energy systems. European TTF benchmark prices surged +52% within 24 hours, while Asian JKM pricing increased +39% across spot markets.
These developments align with broader oil price rally patterns driven by geopolitical tensions, whilst weekly natural gas trends showed unprecedented volatility. Oil market correlation effects pushed Brent crude to $84/barrel, reflecting energy complex disruption expectations among financial market participants.
These price movements represent historically significant volatility levels for such compressed timeframes. Furthermore, the US natural gas forecast requires revision considering these supply disruption implications.
Quantified Supply Loss Impact Scenarios
Energy consulting analysis indicates Qatar LNG production disruptions could eliminate between 3.3 million tonnes and 11.2 million tonnes of annual LNG supply depending on recovery duration and infrastructure damage severity.
Table: Qatar LNG Production Loss Scenarios for 2026
| Disruption Scenario | Duration | Lost Output (Mt) | % of Annual Capacity |
|---|---|---|---|
| Minimal Damage | 15 days | 3.3 | 4.3% |
| Moderate Damage | 3-4 weeks | 5.6 | 7.3% |
| Severe Disruption | 4-5 weeks | 11.2 | 14.5% |
Secondary Supply Chain Impact Mechanisms
LNG supply constraints generate cascading effects through industrial sectors dependent on natural gas as both feedstock and energy source. Petrochemical manufacturing experiences dual impact as natural gas provides raw materials for ethylene and propylene production while serving as process heating fuel.
Fertiliser production disruptions occur when natural gas shortage affects ammonia synthesis, representing approximately 70-80% of production costs in nitrogen fertiliser manufacturing. These constraints translate into higher agricultural input costs affecting global food supply chains.
Industrial gas supply for manufacturing sectors faces constraints as oxygen, nitrogen, and hydrogen production requires energy-intensive separation processes dependent on natural gas availability.
Regional Market Vulnerability Assessment and Import Dependency Analysis
Different global regions exhibit varying exposure levels to Qatar LNG supply disruptions based on import dependency ratios, alternative supplier access, and strategic storage capabilities.
European Market Exposure Patterns
Table: European LNG Import Dependency and Risk Assessment
| Country | Qatar Import Share | Alternative Suppliers | Storage Capacity (bcm) | Vulnerability Level |
|---|---|---|---|---|
| Germany | 15% | US, Norway, Algeria | 24.5 | Medium |
| Italy | 22% | Algeria, US, Russia | 17.8 | High |
| Spain | 8% | Algeria, US, Nigeria | 8.4 | Low |
| France | 18% | Algeria, US, Nigeria | 13.2 | Medium |
| Netherlands | 12% | US, Algeria, Qatar | 15.6 | Medium |
European markets demonstrate varied resilience levels with Italy facing highest vulnerability due to 22% Qatar import dependency combined with relatively limited storage infrastructure. In contrast, Spain maintains lowest risk exposure through diversified supplier base and reduced Qatar reliance.
Asia-Pacific Demand Response Mechanisms
South Asian markets exhibit higher price sensitivity compared to Northeast Asian buyers, creating distinct adjustment patterns during supply disruptions:
Price-Sensitive Market Responses:
- Bangladesh: Fuel switching to coal-fired power generation
- Pakistan: Industrial demand curtailment programmes activated
- India: Increased domestic coal utilisation for power sector
Premium Market Reactions:
- China/Japan/South Korea: Strategic reserve utilisation
- Taiwan/Singapore: Alternative supplier contract activation
- Australia: Domestic supply reallocation from export facilities
Alternative Supply Source Availability and Market Compensation Mechanisms
Global LNG supply flexibility depends on available spare production capacity across multiple producing regions and contractual arrangements enabling supply redirection during disruptions. However, geopolitical factors influence availability, with trade war oil movements affecting energy supply chains.
United States LNG Export Capacity Utilisation
US LNG facilities currently operate at 95-98% utilisation rates, limiting immediate supply increase capability without demand reduction elsewhere. Nevertheless, planned expansion projects include:
Upcoming US Capacity Additions:
- Corpus Christi Train 3: 5.0 Mtpa (scheduled 2026)
- Golden Pass LNG: 15.6 Mtpa (phased startup 2026-2027)
- Calcasieu Pass: Additional trains under development
- Rio Grande LNG: Final investment decisions pending
African LNG Production Potential
African producing regions offer limited immediate compensation capacity due to existing operational constraints and infrastructure limitations. Additionally, US tariff impacts could influence investment flows in these regions.
Nigeria LNG expansion projects target 8.0 Mtpa additional capacity through Train 7 development, though timeline uncertainty affects near-term supply availability.
Mozambique LNG restart scenarios could contribute 12.9 Mtpa potential from the Coral South project, contingent on security situation improvements and infrastructure restoration.
Egypt LNG export constraints limit compensation potential due to increasing domestic demand absorbing production capacity previously allocated for international markets.
Russian LNG Market Reintegration Scenarios
Under hypothetical sanctions relief conditions, Russian facilities could contribute significant additional supply:
Russian LNG Capacity Breakdown:
- Yamal LNG: 16.5 Mtpa operational capacity
- Arctic LNG 2: 19.8 Mtpa (currently sanctioned)
- Sakhalin-2: 10.9 Mtpa existing production
- Total Potential: Up to 47.2 Mtpa additional supply
However, sanctions reintegration scenarios remain highly unlikely due to geopolitical considerations and long-term US energy expansion interests.
Investment Strategy Shifts and Long-Term Market Structure Changes
Supply security concerns drive strategic modifications in LNG infrastructure development priorities, affecting global energy transition timelines and capital allocation patterns.
Accelerated Project Development Initiatives
US Gulf Coast expansion projects receive renewed investment priority as buyers seek supply diversification away from geopolitically vulnerable regions. Furthermore, Australian LNG capacity additions gain increased strategic importance despite higher production costs compared to Qatar facilities.
Qatar's North Field expansion maintains critical importance for global supply balance, though recent events highlight concentration risk considerations for long-term contracting strategies.
Supply Chain Diversification Investment Patterns
European buyers increasingly emphasise long-term contract diversity across multiple suppliers and geographic regions. Additionally, Asian importers accelerate floating storage and regasification unit (FSRU) deployment enabling greater supply flexibility.
Strategic LNG storage development follows petroleum reserve models with government-supported facilities providing supply security buffers during disruption periods.
The next major ASX story will hit our subscribers first
Market Stabilisation Mechanisms and Price Spiral Prevention
Despite short-term volatility, structural factors limit sustained price increases in global LNG markets through demand elasticity and substitution mechanisms. As Qatar's production halt demonstrates, however, initial market reactions can be severe.
Industrial Demand Elasticity Factors
Fuel switching capabilities in power generation enable rapid transitions between natural gas, coal, and oil-fired electricity production based on relative fuel costs.
Industrial process optimisation reduces gas consumption through efficiency improvements and production scheduling adjustments during high-price periods.
Seasonal demand variations provide natural adjustment flexibility as heating and cooling requirements fluctuate throughout annual cycles.
Economic Substitution Effects and Alternative Energy Acceleration
Coal-to-gas switching reversibility allows power markets to temporarily return to coal-fired generation during sustained LNG price increases.
Oil product alternatives for heating and industrial applications provide substitution options when natural gas pricing becomes economically unviable.
Renewable energy deployment acceleration occurs as high fossil fuel prices improve renewable project economics and investment returns.
FAQ: Qatar LNG Production Halt Impact Analysis
How long could Qatar's LNG production remain offline following infrastructure damage?
Technical restoration assessments suggest 2-4 weeks for complete facility recovery, depending on infrastructure damage extent and comprehensive safety verification requirements. Complex cryogenic systems require systematic restart procedures preventing immediate production resumption.
Which countries face the greatest vulnerability to Qatar LNG supply disruptions?
European nations with high Qatar import dependency including Italy (22% import share), France (18%), and Germany (15%) experience significant exposure. Price-sensitive South Asian markets including Bangladesh and Pakistan face substantial impact due to limited alternative supplier access and economic constraints.
Can other global LNG producers compensate for Qatar's lost output capacity?
Limited spare capacity exists globally with US facilities operating at 95-98% utilisation rates. Meaningful compensation requires either demand reduction through fuel switching or alternative energy source deployment rather than increased production from existing facilities.
What are the long-term implications for global LNG market structure and investment patterns?
Increased emphasis on supply diversification strategies, strategic storage facility development, and accelerated alternative energy deployment to reduce dependency risks. Investment priorities shift toward geographically distributed production capacity and enhanced supply chain resilience.
How do LNG supply disruptions affect downstream industries and commodity markets?
Petrochemical feedstock shortages impact polymer production, fertiliser manufacturing constraints affect agricultural supply chains, and industrial gas supply limitations create manufacturing sector bottlenecks. These secondary effects often persist longer than primary LNG market disruptions.
Disclaimer: This analysis contains forward-looking statements and market projections that involve inherent risks and uncertainties. Energy market conditions, geopolitical developments, and infrastructure restoration timelines may vary significantly from estimates presented. Readers should conduct independent research and consult qualified financial advisors before making investment decisions based on this information.
Ready to Capitalise on Global Energy Market Volatility?
Discovery Alert's proprietary Discovery IQ model delivers real-time alerts on significant ASX mineral discoveries, including energy sector opportunities that could benefit from market disruptions like Qatar's LNG production halt. Explore Discovery Alert's historic discoveries to understand how major mineral finds have generated substantial returns, then begin your 14-day free trial today to position yourself ahead of volatile energy markets.