
July 20, 2026
Energy markets operate within interconnected systems where single points of failure can trigger cascading disruptions across multiple regions and industries. The global liquefied natural gas infrastructure exemplifies this vulnerability, with concentrated production facilities and narrow transportation corridors creating systemic risks that extend far beyond immediate supply zones. The Qatar LNG shutdown in March 2026 demonstrated how critical minerals energy dependencies intersect with geopolitical disruptions to create widespread market volatility.
The Geographic Architecture of Global LNG Vulnerability
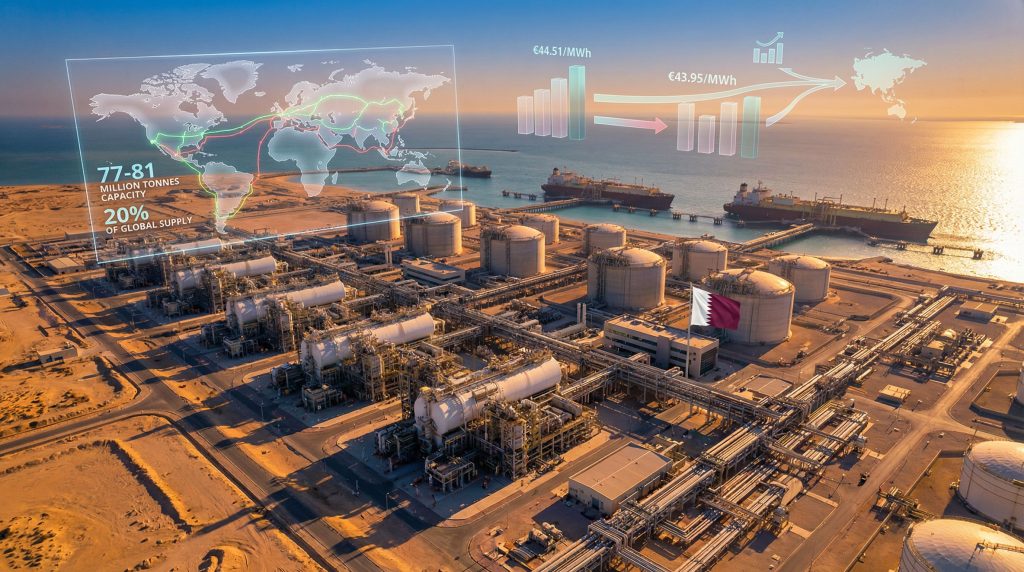
Qatar's position within the global energy ecosystem demonstrates how single-facility dependencies create disproportionate market influence. The nation operates as the world's third-largest LNG exporter, commanding approximately 20% of global seaborne LNG exports through its concentrated production infrastructure. This market share translates to annual export capacity ranging between 77-81 million metric tonnes, positioning Qatar as a critical supply anchor for both Asian and European markets.
Strategic Chokepoint Dynamics in Energy Transportation
The Strait of Hormuz functions as the primary transit corridor for Qatari LNG exports, with 90% of Qatar's production flowing through this narrow waterway. During 2025, approximately 81 million tonnes of LNG transited the strait, representing nearly one-fifth of global LNG supply moving through a single geographic bottleneck. This concentration creates what energy analysts describe as a global chokepoint where disruption affects worldwide market dynamics immediately.
Ras Laffan Industrial City serves as Qatar's primary LNG processing complex, housing multiple liquefaction trains and export terminals within a concentrated geographic area. The facility's integration with petrochemical operations means that LNG production shutdowns simultaneously affect downstream industries including urea, polymers, and methanol manufacturing. This interconnected design amplifies vulnerability by creating multiple product line disruptions from single infrastructure events.
Production Capacity Metrics Defining Market Dependencies
Qatar's export distribution patterns reveal asymmetric regional dependencies that shape global market responses during supply disruptions:
| Destination Region | Share of Qatar Exports | Strategic Significance |
|---|---|---|
| Asia | 85% | Primary demand centre |
| Europe | 12% | Secondary but critical market |
| Other regions | 3% | Marginal exposure |
European markets demonstrate lower direct dependency, with Qatar supplying approximately 7% of EU total LNG imports in 2025. However, this figure understates actual vulnerability due to competitive displacement effects when Asian buyers seek alternative sources during Qatari supply disruptions.
When big ASX news breaks, our subscribers know first
Crisis-Driven Market Psychology and Price Formation Mechanisms
Regional conflicts transform energy market dynamics through risk premium calculations that extend beyond direct supply arithmetic. Furthermore, natural gas markets exhibit heightened sensitivity to Middle Eastern disruptions compared to oil markets, reflecting structural differences in production concentration and storage capacity constraints.
Asymmetric Market Reactions During Geopolitical Crises
The March 2026 Qatar LNG shutdown demonstrated stark differences between oil and natural gas market psychology. While oil price analysis showed relative market stability, natural gas benchmarks experienced dramatic price escalations across multiple regions:
| Benchmark | Pre-Crisis Price | Peak Crisis Price | Percentage Increase |
|---|---|---|---|
| European TTF | €28.50/MWh | €44.51/MWh | 56% |
| Asian JKM | €26.20/MWh | €43.95/MWh | 68% |
| Intraday European TTF | €28.50/MWh | 50% surge during session | 50% |
These price movements occurred despite the disruption being precautionary rather than damage-based, illustrating how market psychology responds to perceived supply security threats rather than confirmed physical losses.
Storage Depletion Amplifying Crisis Vulnerability
European gas storage levels created additional vulnerability layers during the March crisis. Storage facilities registered 30% capacity utilisation compared to the seasonal average of 54% for early March periods. This 24 percentage point deficit below normal levels reduced the buffer capacity available to absorb supply disruptions.
Several major European storage sites reached critically low levels following the 2025 winter heating season, creating conditions where even temporary supply interruptions trigger acute market responses. The combination of depleted storage and concentrated supply sources generated what analysts characterised as a perfect storm for price volatility.
Regional Exposure Patterns and Strategic Dependencies
Global LNG import dependencies reveal asymmetric vulnerability patterns that determine market response intensity during supply crises. For instance, Asian markets demonstrate the highest concentration risk due to substantial reliance on Qatari volumes for power generation and industrial operations.
Asian Market Vulnerability Matrix
| Country | Qatar LNG Share | Annual Import Volume | Risk Classification |
|---|---|---|---|
| India | 42-52% | 25 million tonnes | Critical |
| China | 30% | 73 million tonnes | High |
| Taiwan | 25% | 18 million tonnes | High |
| South Korea | 14-19% | 47 million tonnes | Moderate |
India faces the most acute vulnerability with Qatar supplying between 42-52% of total LNG imports. This dependency level creates immediate industrial impacts during supply disruptions, as evidenced by Indian companies implementing 10-30% cuts to industrial gas supplies in anticipation of tighter availability.
China represents the largest absolute volume exposure despite lower percentage dependency. With 30% of imports sourcing from Qatar across 73 million tonnes of annual consumption, Chinese market responses significantly influence global price formation and alternative cargo competition.
European Secondary Impact Mechanisms
European markets face vulnerability through competitive displacement rather than direct supply dependency. Qatar's 7% share of EU LNG imports understates actual exposure because Asian buyers seeking replacement volumes bid against European importers in global spot markets.
The displacement effect intensifies when European storage levels are depleted, as occurred during early 2026. With storage at 30% capacity versus 54% seasonal average, Europe lacked buffer capacity to absorb competitive pressures from Asian replacement demand. Consequently, gas price trends 2025 showed heightened volatility during supply disruptions.
Industrial rationing protocols emerged immediately across price-sensitive European markets, demonstrating how supply psychology triggers demand destruction before physical shortages materialise.
Alternative Supply Source Mobilisation and Market Rebalancing
Global LNG markets possess inherent rebalancing mechanisms through alternative supply sources and demand flexibility, though activation requires time and creates temporary price premiums during transition periods.
US Export Capacity Expansion Opportunities
United States LNG exporters positioned themselves to capture market opportunities during the Qatar disruption. Facilities in Texas and Louisiana increased utilisation rates while accelerating planned capacity additions to serve higher-priced European and Asian markets.
Companies including Venture Global and Cheniere Energy experienced significant equity gains during the crisis:
- Venture Global shares: Nearly 20% increase on March 2, 2026
- Cheniere Energy: 5.6% gain reflecting investor expectations of enhanced margins
US producers benefit from geographic diversification advantages, operating multiple facilities across different regions rather than concentrated single-point infrastructure. This distributed model provides resilience during regional disruptions while enabling rapid response to market opportunities.
Global Trade Flow Reconfiguration Dynamics
LNG cargo redirection occurs rapidly during supply disruptions as traders route shipments toward highest-priced markets. The March 2026 crisis demonstrated how flexible cargo routing can partially offset supply losses, though transportation time delays create temporary regional shortages.
Australian export capacity faces seasonal constraints that limit ability to replace Middle Eastern volumes during certain periods. However, Russian LNG availability despite sanctions frameworks provides additional supply options, though geopolitical considerations affect European buyer willingness to increase Russian dependencies.
Floating storage and regasification units enable rapid deployment to markets experiencing acute shortages, though limited global fleet capacity constrains this flexibility mechanism during widespread disruptions.
Industrial Impact Cascades Beyond Energy Sectors
Natural gas supply disruptions create ripple effects throughout industrial value chains, particularly affecting sectors dependent on gas as both energy source and chemical feedstock. The Qatar LNG shutdown demonstrated how energy crises extend into food security and manufacturing supply chains.
Chemical Industry Feedstock Dependencies
Qatar's integrated hydrocarbon operations mean LNG production shutdowns simultaneously halt chemical and petrochemical manufacturing. The March 2026 disruption suspended production of:
- Urea (fertiliser feedstock)
- Polymers (plastic manufacturing inputs)
- Methanol (chemical industry intermediate)
These products serve global supply chains, with disruption effects extending far beyond energy markets. Furthermore, fertiliser price increases transmit directly into agricultural costs, creating food inflation pressures during supply shortages.
Power Generation Fuel Switching Economics
European power markets demonstrated demand flexibility through fuel switching mechanisms when natural gas prices exceeded economic thresholds. Coal-fired power plants became economically competitive when gas prices surpassed €40 per MWh, creating a natural price ceiling through demand destruction.
This switching capability provides market stabilisation during supply crises, though environmental considerations limit sustained coal utilisation as a gas replacement strategy. In addition, spring renewable energy generation patterns further reduce gas demand, creating seasonal windows for supply disruption management.
Long-Term Strategic Infrastructure Resilience Implications
The March 2026 Qatar LNG shutdown revealed structural vulnerabilities requiring strategic responses across multiple dimensions of energy security planning. Market participants began reassessing concentration risks and developing distributed supply strategies.
Investment Priorities for Supply Chain Diversification
Energy buyers initiated procurement strategy revisions to reduce single-source dependencies. Long-term contract negotiations incorporated enhanced force majeure provisions and multi-source supply requirements to mitigate concentration risks. Additionally, Qatar's drone attacks highlighted the vulnerability of concentrated energy infrastructure.
Infrastructure investment flows shifted toward distributed production facilities rather than concentrated mega-projects. This approach trades economies of scale for operational resilience, spreading production across multiple geographic locations.
Strategic petroleum and gas reserve expansion programmes gained priority as governments recognised storage capacity limitations during crisis periods. Enhanced reserve levels provide buffer capacity to manage supply disruptions without immediate market panic.
Demand-Side Management Evolution
Industrial users developed flexible consumption protocols enabling rapid demand reduction during supply emergencies. Manufacturing processes incorporated fuel switching capabilities and production scheduling flexibility to manage input cost volatility.
Dynamic pricing structures emerged to incentivise consumer behaviour modification during supply constraints. These mechanisms enable market-based demand management rather than administrative rationing during crisis periods.
The next major ASX story will hit our subscribers first
Energy Transition Acceleration Under Supply Security Pressures
Supply security concerns intensified renewable energy adoption timelines as governments and industries recognised diversification benefits beyond climate considerations. The Qatar disruption demonstrated how geopolitical events accelerate energy transition policies, particularly highlighting the importance of green transition materials for building resilient energy systems.
Renewable Energy as Strategic Independence Infrastructure
Solar and wind capacity deployment gained strategic priority as supply security measures rather than solely environmental initiatives. Battery storage infrastructure investment increased to provide grid stability during fossil fuel supply disruptions.
Hydrogen production scaling emerged as a long-term LNG alternative development pathway. Green hydrogen projects received accelerated investment commitments as buyers sought alternatives to geopolitically exposed fossil fuel supplies.
Critical Mineral Dependencies Creating New Vulnerability Patterns
Energy transition acceleration revealed emerging dependency risks in critical minerals required for renewable technologies. Lithium, cobalt, and rare earth supply chains demonstrate similar concentration patterns to fossil fuel infrastructure. Consequently, lithium industry innovations have become crucial for energy security planning.
Strategic stockpiling programmes developed for energy transition materials, recognising that renewable energy independence requires secure access to manufacturing inputs. Circular economy initiatives gained emphasis to reduce import dependencies through domestic recycling capacity.
Mining industry geopolitical exposure assessments became standard practice as energy transition minerals gained strategic importance equivalent to traditional energy resources.
Financial Risk Management and Crisis-Resistant Market Structures
Energy market participants developed sophisticated risk management tools following the March 2026 experience. Hedging strategies evolved to address geopolitical supply disruption scenarios beyond traditional price volatility management.
Advanced Hedging Mechanisms for Supply Security
Insurance products emerged covering geopolitical supply disruptions, enabling buyers to transfer concentration risks to financial markets. These instruments provide compensation during force majeure events that traditional commodity hedges cannot address.
Government intervention frameworks established protocols for energy emergency responses, including strategic reserve releases and international cooperation agreements for crisis resource sharing. Moreover, European gas market disruptions showed the interconnected nature of global energy security.
International Cooperation Frameworks for Energy Security
Regional energy security partnerships strengthened following the Qatar disruption, recognising that isolated national responses prove insufficient during global supply crises. Coordinated strategic reserve policies and emergency sharing agreements enhanced collective resilience.
Technology development accelerated for rapid supply chain reconfiguration capabilities, enabling faster alternative source activation during disruptions.
Readers analysing global energy market vulnerabilities should consider how geographic concentration, storage capacity constraints, and industrial integration patterns combine to create systemic risks extending beyond immediate supply calculations. The Qatar LNG shutdown experience provides valuable insights into energy security planning and market resilience mechanisms.
Disclaimer: This analysis contains forward-looking statements and market speculation based on current events and trends. Energy market dynamics involve significant uncertainties, and actual outcomes may differ materially from scenarios presented. Readers should conduct independent analysis before making investment or strategic decisions based on this information.
Ready to Stay Ahead of Energy Market Disruptions?
Discovery Alert's proprietary Discovery IQ model delivers real-time insights on ASX mineral discoveries, including critical energy transition materials that are becoming increasingly strategic during global supply disruptions. Stay informed about emerging opportunities in lithium, rare earths, and other essential minerals powering the renewable energy transition with a 14-day free trial today.