July 18, 2026
When the Bottleneck Is Downstream: Understanding the 2026 Fuel Pricing Paradox
Most energy market participants are conditioned to watch crude oil benchmarks as the primary signal for fuel costs. When Brent rises, diesel prices follow. When WTI falls, pump prices ease. That logic held for decades, and it built an entire generation of commodity analysts, mining finance teams, and capital allocators around a single upstream variable. In 2026, that framework has become dangerously incomplete.
The structural reality now shaping fuel markets operates one level further down the value chain, inside refinery gates, across processing trains, and through the complex physics of converting crude feedstock into usable fuel products. Refining capacity constraints and light sweet crude premiums have emerged as the two defining variables in energy pricing, not the headline oil benchmarks explained that dominate financial media coverage.
Understanding why this shift happened, what it means for different asset classes, and which signals will indicate when it reverses is now essential analytical infrastructure for anyone with meaningful exposure to energy markets, whether through direct investment, commodity hedging, or downstream cost management in sectors like mining.
When big ASX news breaks, our subscribers know first
The Decoupling Between Crude Prices and Fuel Margins
The IEA's July 2026 Oil Market Report documented something that challenged conventional energy economics: refined product crack spreads and margins climbed to near four-year highs during a period when benchmark crude prices were declining through June 2026. Brent fell as geopolitical risk premiums partially unwound following earlier supply concerns, yet the fuels refined from that crude became more expensive relative to the raw input.
This divergence has a precise explanation. Crack spreads measure the difference between what refined products fetch in the market and what the crude feedstock costs. When downstream processing capacity cannot keep pace with fuel demand, the product side of that equation holds firm or rises even as the input price softens. The spread widens not because crude is scarce, but because the machinery converting crude into usable fuel cannot run fast enough.
Furthermore, the crude price trends we observed heading into 2026 made this divergence all the more striking. The critical distinction here is between upstream scarcity and downstream incapacity. Strategic reserves and redirected tanker flows can address the former within days. Restarting damaged refineries, completing regulatory clearances, and ramping processing trains back to full throughput takes months, minimum.
OPEC's Monthly Oil Market Report placed the OPEC Reference Basket at $89.75 per barrel in June 2026, down $24.80 from May, though the year-to-date average remained $93.67 per barrel against a 2025 full-year average of $72.04. The crude price direction was clearly downward. The fuel margin direction was clearly upward. That contradiction is the defining feature of the current energy market structure.
Quantifying the Global Refining Shortfall
The numbers behind the capacity deficit are substantial enough that framing this as a temporary aberration would be a significant analytical error. According to the IEA's July 2026 Oil Market Report, global refinery runs remain approximately 6 million barrels per day below year-ago levels. That gap is not attributable to a single disruption but to three geographically distinct and structurally independent bottlenecks operating simultaneously.
| Constraint Factor | Estimated Scale |
|---|---|
| Global refinery runs vs. prior year | ~6 million b/d below |
| US effective capacity below historical peak | ~4 million b/d |
| Global capacity lost between 2019 and 2025 | ~4.5 million b/d |
| Projected additional net capacity reduction (2025) | ~188,000 b/d (BloombergNEF) |
| Average global refinery utilization rate | 82-85% |
| Meaningful new capacity additions expected | 2027-2028 |
Three Simultaneous Regional Disruptions
The three bottlenecks compressing global throughput each operate on different recovery timelines and carry different analytical implications:
-
Middle East: Export-oriented refineries remain offline following regional conflict. Even as geopolitical risk premiums ease at the crude level, physical restart of damaged or idled refinery infrastructure requires sequential engineering, procurement, and commissioning steps that cannot be compressed regardless of political developments.
-
Russia: Strikes on domestic processing infrastructure have curtailed throughput at key refining facilities, reducing available product exports. Russian refinery utilization data, tracked through IEA and EIA monthly reporting, has remained below pre-disruption levels, and recovery trajectories remain uncertain.
-
Asia: Multiple refining operators across the region continue running below their typical utilization rates, limiting regional fuel output at a time when demand fundamentals remain relatively firm.
What makes this combination particularly impactful is that each regional constraint operates independently. Resolving the Middle East situation does not restore Russian throughput. Asian utilization recovering does not rebuild Middle Eastern export capacity. The aggregate 6 million b/d deficit requires progress across all three vectors simultaneously to close meaningfully.
Why API Gravity Becomes a Pricing Variable Under Capacity Constraints
Crude oil quality is defined along two primary axes: API gravity, which measures density (higher API gravity indicates lighter crude), and sulfur content, which determines the processing complexity required to meet fuel product specifications. According to the American Fuel & Petrochemical Manufacturers, light, sweet crude sits at the premium end of both dimensions, typically exhibiting API gravity above 35 degrees and sulfur content below 0.5%.
The operational significance of these quality characteristics becomes amplified precisely when processing capacity is scarce. Light, sweet crude yields a higher proportion of middle distillates, specifically diesel and jet fuel, per barrel processed, while requiring fewer processing steps to achieve that yield. When refinery capacity is the binding constraint on fuel production rather than crude availability, feedstocks that minimise processing complexity and maximise high-value product output command structural premiums.
Current Premium Levels in Global Markets
| Market or Grade | Premium Above Brent (Approximate) |
|---|---|
| Norwegian and US light sweet crude (Asian delivery) | $8-$12 per barrel |
| Johan Sverdrup specific cargo (Asian delivery) | Up to $11.80/bbl above Brent |
| Canadian Mixed Sweet benchmark (North America, 2026) | $12-$12.65/bbl above May CMA Nymex |
These figures represent what market participants have described as historically unusual territory for light sweet differentials, reflecting not a temporary supply squeeze but a structural shortage of appropriate downstream processing capacity. Refiners configured for specific crude grades cannot seamlessly substitute alternative feedstocks without significant operational and capital adjustments, which means the premium is self-reinforcing as long as the capacity deficit persists.
A useful illustration of the investment-grade economics available when crude quality aligns with infrastructure constraints comes from exploration in southeastern Turkey. Trillion Energy's C-1 well at the M47 Block intersected 38 metres of net oil pay at 32.4 degrees API gravity, with an independent evaluation estimating 27.6 million barrels of 2C Contingent Resources at the North Discovery. The company's president has characterised the economics of onshore conventional light oil discovery as highly competitive, noting production cost estimates of approximately $10 per barrel, compared with roughly $50 per barrel in North American contexts. That cost differential illustrates why crude quality, reservoir type, and geographic jurisdiction collectively determine project economics in ways that aggregate commodity price benchmarks cannot capture.
Important disclaimer: Contingent Resources carry material uncertainty regarding development. 2C estimates represent the central estimate within a range and should not be interpreted as proven reserves. Unrisked NPV figures should always be assessed alongside the Chance of Development rather than used as standalone valuation metrics.
US Refinery Operations: A System at Its Ceiling
EIA data for the week ending July 10, 2026 provides a granular illustration of how domestic refining capacity is being pushed toward operational limits:
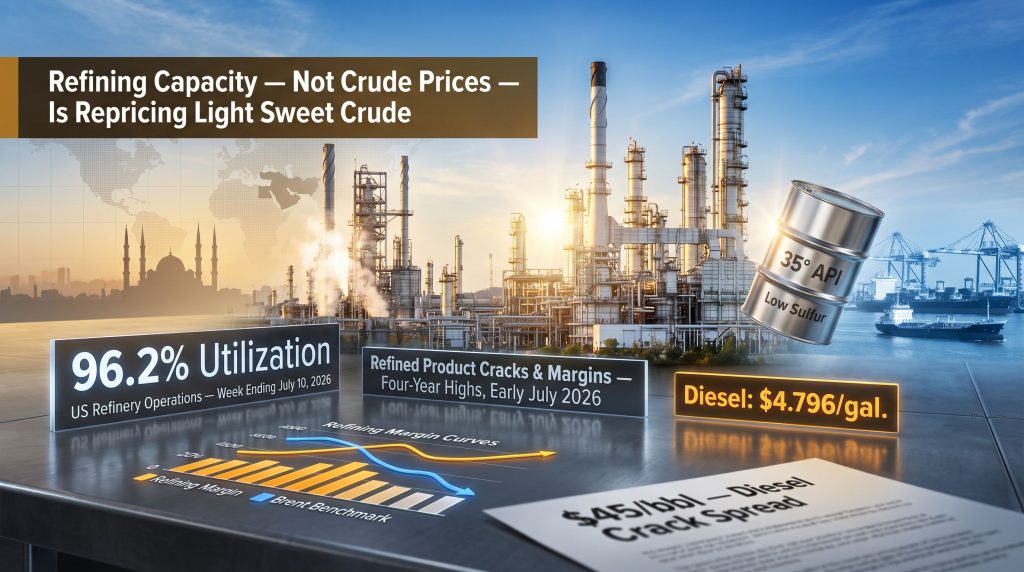
- Utilisation rate: 96.2%, effectively at maximum sustainable throughput
- Crude oil refinery inputs: 17.1 million barrels per day
- Commercial crude stocks (excluding Strategic Petroleum Reserve): 409.7 million barrels, approximately 6% below the five-year seasonal average, following a 1.7 million barrel decline
- Distillate inventory change: +4.6 million barrels build during the same period
The apparent paradox in that data set deserves careful attention. Distillate inventories increased by 4.6 million barrels while the national average retail diesel price simultaneously rose by $0.218 to $4.796 per gallon. Under conventional supply-demand reasoning, a meaningful inventory build should exert downward pressure on prices. The opposite occurred.
This counter-intuitive outcome confirms that inventory levels are not the primary pricing mechanism in the current environment. The structural shortage of refining capacity means that even when product builds occur at the margin, the underlying constraint on total fuel supply is the processing ceiling, not the storage level.
Diesel Pricing and the Mining Cost Transmission Mechanism
For mining operations, the conventional focus on gold or copper prices as the primary driver of financial performance misses an increasingly material cost variable. Diesel is not a peripheral input at most extraction operations. It is the primary energy source for haul trucks, excavators, drill rigs, and on-site power generation across open-pit configurations, and it typically represents 15% to 30% of total operating costs at haulage-intensive mines.
Jefferies has estimated that every 10% increase in crude oil prices raises production costs at the average open-pit gold mine by approximately $10 per ounce. At retail diesel levels of $4.796 per gallon, the sustained fuel cost pressure on these operations is measurable and direct, increasing all-in sustaining costs (AISC) in ways that require offsetting gold price strength to preserve operating margins. The commodity price impacts flowing from refining constraints are consequently far broader than a purely energy-sector analysis might suggest.
Fuel Cost Sensitivity by Operation Type
| Operation Type | Estimated Diesel Share of Operating Costs |
|---|---|
| Open-pit gold mines (haulage-intensive) | 15-30% |
| Copper SX-EW operations (grid-connected) | ~5% |
| Underground mines (partially electrified) | Below open-pit equivalents |
Jefferies' analysis places diesel at approximately 5% of operating costs for copper solvent extraction and electrowinning (SX-EW) operations, a figure that reflects two decades of progressive grid electrification at many of those facilities. The divergence between a 5% fuel cost exposure and a 30% exposure at a diesel-intensive open-pit gold mine is not a marginal analytical distinction. It represents a fundamentally different earnings profile in a sustained high-diesel-price environment.
Mines with active fuel hedging programmes, grid-connected power supply, underground configurations with lower haulage requirements, or proximity to renewable energy infrastructure all exhibit structurally lower sensitivity to refining margin dynamics than their open-pit, diesel-dependent counterparts. As refining capacity constraints have become a persistent feature rather than a transient disruption, fuel exposure has graduated from a secondary consideration to a primary differentiator in project economics evaluation.
The next major ASX story will hit our subscribers first
Natural Gas Divergence: Why Oil and Gas Require Separate Analytical Frameworks
The instinct to group oil and gas as a unified energy commodity thematic is a persistent source of analytical error, and the 2026 pricing environment has made that error unusually costly. While crude-linked fuel markets tightened through July 2026, US natural gas followed a completely different trajectory.
Henry Hub spot natural gas fell to $2.83 per MMBtu on July 13, 2026, its lowest level in two months, driven by US Lower 48 dry gas production running at approximately 110.2 billion cubic feet per day, near record levels. A concurrent LNG export outage at the Freeport terminal trapped additional domestic supply in the US market, amplifying the oversupply pressure on Henry Hub prices. In addition, the dynamics shaping global LNG supply continued to diverge sharply from domestic US conditions throughout this period.
| Factor | Crude Oil and Refined Products | US Natural Gas (Henry Hub) |
|---|---|---|
| Primary price driver | Refining capacity constraints | Domestic production surplus |
| Direction (mid-2026) | Margins rising despite lower crude | Prices falling to two-month lows |
| Global versus domestic exposure | Globally integrated | Predominantly domestic |
| LNG export linkage | Indirect | Direct (outage impact visible) |
European and Asian LNG markets maintained stronger pricing through this period because robust import demand and exposure to international supply risks continued to support global LNG benchmarks. The contrast with Henry Hub illustrates a structural feature of gas markets that is not present to the same degree in crude: domestic US gas prices can diverge sharply from global LNG pricing when export infrastructure constraints trap supply onshore.
For portfolio construction, treating oil-weighted and gas-weighted energy producers as interchangeable exposures within a single energy thematic risks systematic misvaluation. Cash flow profiles, earnings leverage, and appropriate valuation multiples differ materially between the two, particularly when the commodity dynamics are pulling in opposite directions as they were in mid-2026.
Indicators to Watch: When Will Refining Capacity Recovery Begin?
The trajectory of refining capacity constraints and light sweet crude premiums will be shaped by observable developments across a specific set of leading indicators over the next one to two quarters. Monitoring these variables provides a more direct read on fuel market direction than tracking headline crude benchmarks:
-
Middle East refinery restart progress: Physical restart timelines at export-oriented facilities will directly determine how quickly the 6 million b/d year-on-year gap begins to close. Geopolitical de-escalation at the crude level does not automatically accelerate refinery restart timelines.
-
Russian refining throughput data: Monthly IEA and EIA reporting on Russian product output will indicate whether strike-related curtailments are recovering or proving more persistent than initially expected.
-
Asian refinery utilisation rates: A return to historical utilisation levels across key Asian refining hubs would provide meaningful relief to global product supply constraints independent of Middle Eastern or Russian developments.
-
IEA Monthly Oil Market Reports: The next one to two editions represent the most authoritative consolidated source for tracking whether the aggregate capacity deficit is narrowing.
-
OPEC+ production decisions: The confirmed 188,000 b/d production increase effective August 2026 adds crude supply to the market. However, additional crude availability cannot increase diesel or jet fuel supply while downstream processing capacity remains the binding constraint. The bottleneck is at the refinery, not the wellhead.
-
US FOMC policy signals: Fed rate decisions, including the July 29 meeting, may influence energy demand expectations through their effect on economic activity, but monetary policy cannot resolve the structural refining capacity deficit underpinning current fuel market tightness.
Scenario Framework: Three Potential Paths Forward
| Scenario | Refinery Capacity Outcome | Likely Market Response |
|---|---|---|
| Rapid Middle East restart | Gap closes toward 3 million b/d | Margins normalise, light sweet premiums compress |
| Prolonged restart delays | Gap persists at 6 million b/d | Premiums remain elevated, diesel stays above $4.50/gallon |
| Additional capacity disruptions | Gap widens beyond 6 million b/d | Crack spreads approach prior crisis highs |
A Capital Allocation Framework Built Around Refining Realities
Constructing an analytical framework adequate to the current environment requires moving beyond Brent and WTI as primary valuation inputs. Several dimensions carry greater explanatory power for downstream fuel costs, project economics, and equity performance across the energy value chain. The broader mining commodity outlook reinforces why these downstream variables now matter as much as headline prices for resource sector investors.
Crude quality differentiation: Light, sweet crude assets carry structural pricing advantages that are amplified, not merely maintained, when refining capacity is constrained. The premiums documented in Asian markets in mid-2026 reflect a genuine scarcity of appropriate feedstock, not temporary sentiment.
Fuel cost exposure quantification: Mining and industrial operations with high diesel dependency face earnings sensitivity to refining margin dynamics that is not captured by crude price movements alone. Evaluating the diesel cost exposure profile of any extraction operation is now a necessary component of financial modelling, not an optional sensitivity analysis.
Infrastructure proximity: Exploration assets located near established export networks and existing refinery connections face lower development costs and shorter timelines to first revenue. Frontier basin assets carry additional infrastructure development risk that should be reflected explicitly in discount rates and NPV assumptions. The EIA's energy analysis on refinery infrastructure patterns provides useful context for assessing this risk dimension across different geographic markets.
Resource classification discipline: For exploration-stage oil and gas companies, distinguishing between Contingent Resources (2C) and Prospective Resources, and applying appropriate Chance of Development assessments to any NPV-based valuation, remains essential due diligence practice. These classification distinctions exist for good reason, and conflating them introduces material valuation error.
Commodity-specific fundamentals: The 2026 divergence between crude-linked fuel markets and Henry Hub gas pricing reinforces the principle that oil-weighted and gas-weighted producers require entirely separate analytical frameworks. Macroeconomic energy demand is not a sufficient substitute for commodity-specific supply and infrastructure analysis.
Until downstream processing capacity recovers at meaningful scale, refining capacity constraints and light sweet crude premiums are likely to remain more important determinants of fuel pricing, project economics, and equity performance across the energy sector than movements in benchmark crude prices. The bottleneck is structural, its resolution timeline is measured in years rather than quarters, and the investment implications run across multiple asset classes simultaneously.
Disclaimer: This article contains forward-looking statements, forecasts, and scenario analyses that involve inherent uncertainty. Past commodity price performance is not indicative of future results. All resource estimates referenced should be evaluated in the context of their applicable regulatory classification standards. This article does not constitute financial advice.
Want to Stay Ahead of the Next Major ASX Mineral Discovery?
Discovery Alert's proprietary Discovery IQ model scans ASX announcements in real time, delivering instant alerts on significant mineral discoveries across more than 30 commodities — transforming complex data into actionable insights for investors at every experience level. Explore historic discoveries and their extraordinary returns, then begin your 14-day free trial to ensure you're positioned before the broader market moves.