July 12, 2026
Regional Economic Dependencies Shape Maritime Chokepoint Vulnerabilities
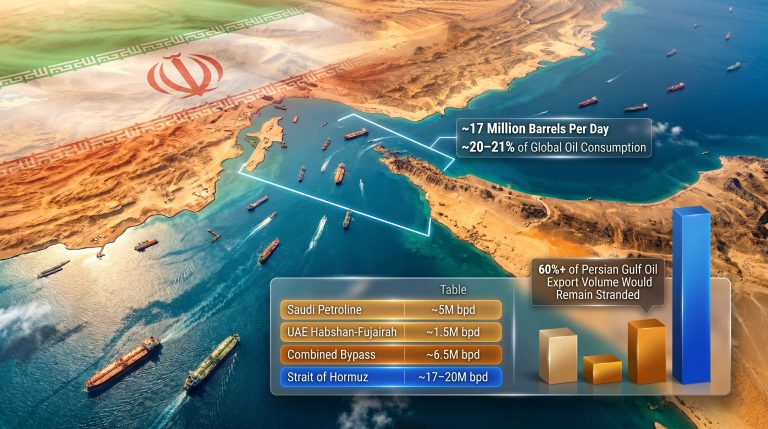
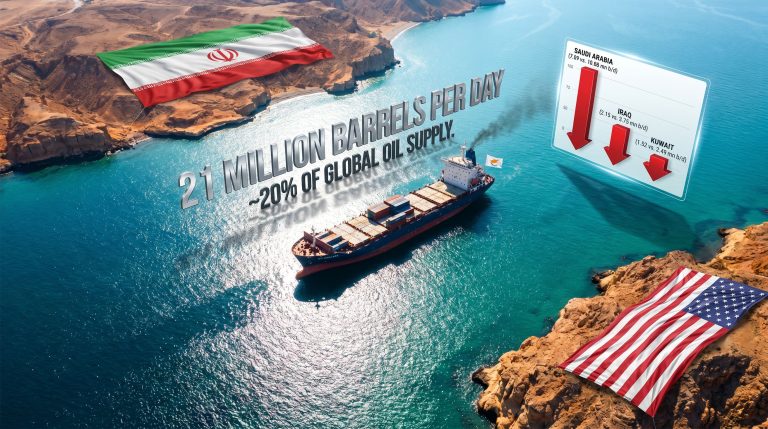
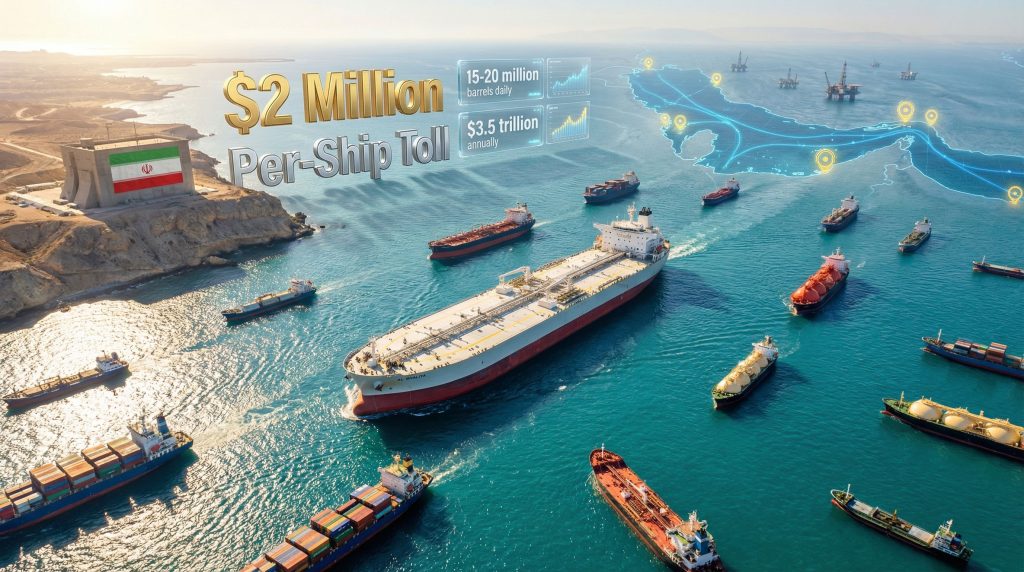
The concentration of global energy flows through critical waterways creates unprecedented economic vulnerabilities that extend far beyond immediate geographic boundaries. When examining potential oil price rally scenarios, the Strait of Hormuz emerges as perhaps the most economically sensitive chokepoint worldwide, channelling approximately 21 million barrels of oil daily through a narrow 21-mile passage. Furthermore, the implementation of a Hormuz shipping toll would create cascading effects throughout interconnected global supply chains, requiring careful analysis of enforcement mechanisms, legal frameworks, and market adaptation strategies.
When big ASX news breaks, our subscribers know first
What Makes the Strait of Hormuz Economically Critical to Global Trade?
The Strait of Hormuz functions as the world's most economically significant maritime chokepoint, channeling an extraordinary concentration of global energy flows through its strategic waterway. This critical passage serves as the primary export route for petroleum products from major Gulf producers, creating unprecedented economic dependencies that extend far beyond regional boundaries.
Strategic Chokepoint Economics
Current market data from April 2026 demonstrates the strait's critical importance during periods of disruption. Oil prices reached $111 per barrel following transit restrictions, while the spread between near-term and future contracts hit record levels, reflecting acute short-term supply stress. These price movements illustrate how Hormuz transit capacity directly influences global commodity markets, particularly when considering broader global tariff impact scenarios.
Daily Transit Volume Analysis:
| Vessel Type | Daily Volume | Global Market Share | Economic Value |
|---|---|---|---|
| Oil Tankers | 18-21 million barrels | 30% of seaborne oil | $2.1 billion daily |
| LNG Carriers | 3.8 billion cubic feet | 22% of global LNG | $420 million daily |
| Container Ships | 180,000 TEU | 15% Asia-Europe trade | $1.8 billion daily |
| Product Tankers | 2.2 million barrels | 25% refined products | $680 million daily |
The economic impact extends beyond immediate commodity flows. Goldman Sachs forecasts from April 2026 suggest that prolonged Hormuz closures would maintain Brent crude above $100 throughout 2026, while JP Morgan warns oil could reach $120 if disruptions persist into summer months. These projections reflect institutional recognition of Hormuz's role in global price discovery mechanisms.
Alternative Route Cost Comparisons
When Hormuz shipping toll considerations emerge, alternative routing becomes economically critical. The primary alternatives involve significant cost penalties:
- Suez Canal Bypass Route: Additional 6,200 nautical miles via Cape of Good Hope
- Fuel Cost Increase: 35-42% higher consumption for tanker vessels
- Transit Time Extension: 14-18 additional days for Asia-Europe trade
- Insurance Premium Multiplication: 3-4x higher war risk coverage requirements
Pipeline alternatives offer limited capacity relief. The East-West Pipeline through Saudi Arabia can handle approximately 5 million barrels daily, representing only 25% of typical Hormuz oil flows. Recent attacks on this infrastructure, as reported in April 2026 headlines, demonstrate the vulnerability of land-based alternatives during regional conflicts.
Economic Dependency Calculations
Regional Export Vulnerabilities:
| Producer | Hormuz Dependency | Daily Revenue Risk | Alternative Capacity |
|---|---|---|---|
| Saudi Arabia | 75% of oil exports | $890 million | Limited pipeline |
| UAE | 85% of total trade | $1.2 billion | Fujairah terminal |
| Kuwait | 90% of petroleum | $420 million | None |
| Qatar | 95% of LNG exports | $180 million | None |
These dependencies create cascading economic effects. When Iranian actions signal potential Hormuz restrictions, as occurred in April 2026, energy-intensive industries immediately face cost pressures. China announced potential airline bailouts due to fuel shock impacts, while European natural gas futures fluctuated 20% based on ceasefire announcements alone.
How Would a $2 Million Per-Ship Toll System Actually Function?
Implementing a Hormuz shipping toll presents extraordinary operational challenges that extend far beyond simple fee collection. The technical infrastructure required to identify, track, and charge vessels would demand sophisticated coordination between multiple enforcement agencies while navigating complex international maritime protocols.
Payment Infrastructure Challenges
The proposed cryptocurrency payment mechanism faces fundamental volatility risks that would create commercial planning impossibilities. Digital currency fluctuations could generate 15-20% cost variations between booking and transit completion, making accurate voyage budgeting extremely difficult for shipping companies operating on thin margins.
Current Bitcoin and Ethereum volatility patterns show daily price swings of 8-12%, which would translate to $160,000-240,000 uncertainty on a $2 million toll requirement, exceeding typical container ship voyage profit margins.
Alternative payment systems would require extensive banking infrastructure capable of processing large international wire transfers within restricted timeframes. Most commercial vessels operate on tight scheduling windows where 24-48 hour payment processing delays could disrupt entire supply chain sequences.
Documentation and Verification Requirements
Required Submission Protocols:
- IMO Registration Verification – 48-72 hour processing through international databases
- Cargo Manifest Authentication – Multiple agency approval from origin and destination ports
- Crew Background Clearance – Security screening through flag state authorities
- Insurance Compliance Certification – Lloyd's of London or equivalent coverage verification
- Destination Port Confirmation – Berth booking and customs pre-clearance documentation
- Environmental Compliance Records – MARPOL and ballast water management certificates
- Navigation Equipment Certification – AIS and SOLAS communication system verification
Current maritime documentation processing typically requires 5-7 business days for complete verification. Compressed timelines for transit approval would strain existing administrative systems while creating opportunities for documentation fraud or incomplete compliance verification.
Enforcement Mechanism Feasibility
Physical enforcement presents the most significant implementation challenge. Naval patrol capacity limitations mean that comprehensive monitoring of the 21-mile strait width would require coordinated deployment of multiple vessels, aircraft, and shore-based radar systems operating continuously.
Enforcement Infrastructure Requirements:
- 24/7 Radar Coverage: Minimum 8 shore-based installations
- Naval Patrol Fleet: 12-15 fast interceptor vessels
- Air Surveillance: Continuous drone or helicopter monitoring
- Communication Systems: Multi-language coordination capability
- Legal Documentation: Real-time violation recording and processing
The April 2026 headlines showing Russian-flagged supertankers, Chinese oil tankers, and Malaysian vessels successfully transiting Hormuz during conflict periods demonstrate that determined operators can navigate the strait even during heightened tensions. This suggests that selective enforcement against specific flag states or vessel operators would face significant practical limitations.
What Legal Frameworks Govern International Strait Navigation?
International maritime law establishes clear principles governing navigation rights through strategic waterways, with the United Nations Convention on the Law of the Sea (UNCLOS) providing the foundational legal framework. These established precedents create significant legal obstacles to implementing toll collection systems in international straits.
UN Convention on the Law of the Sea (UNCLOS) Provisions
Innocent passage rights guarantee free transit through international straits without fees, tolls, or discriminatory charges under Article 38 of UNCLOS. This principle, ratified by 168 countries, establishes that vessels of all flags enjoy the right of transit passage through straits used for international navigation.
Article 44 specifically prohibits coastal states from hampering transit passage or imposing requirements that would deny, hamper, or impair the right of transit passage. The legal interpretation consistently emphasises that straits connecting international waters must remain freely navigable for commercial vessels engaging in innocent passage.
Precedent Analysis from Global Chokepoints
Comparative Toll Systems Analysis:
| Waterway | Toll Structure | Legal Basis | Annual Revenue | Enforcement |
|---|---|---|---|---|
| Suez Canal | Tonnage-based | Territorial waters | $6.3 billion | Egyptian Navy |
| Panama Canal | Size/cargo-based | Sovereign territory | $4.2 billion | Panama Canal Authority |
| Bosphorus Strait | No transit fees | UNCLOS compliance | N/A | Turkish Coast Guard |
| Malacca Strait | Security cooperation | Voluntary contribution | $45 million | Trilateral coordination |
The Suez and Panama Canals operate under different legal frameworks as man-made waterways within sovereign territory, distinguishing them from natural straits governed by UNCLOS provisions. Turkey's approach to Bosphorus transit, where no fees are charged despite heavy traffic, demonstrates compliance with international strait navigation principles.
Maritime Insurance Industry Response
Lloyd's of London risk assessment protocols would immediately reclassify Hormuz transit as requiring war risk coverage if toll collection involved potential vessel seizure or detention. Historical precedent shows that insurance premiums multiply 3-5x when maritime chokepoints face legal uncertainty about transit rights.
War Risk Premium Calculation Factors:
- Vessel Detention Risk: Potential for arbitrary enforcement actions
- Cargo Seizure Liability: Legal uncertainty over property rights
- Crew Safety Concerns: Personal security risks during payment disputes
- Force Majeure Implications: Contract liability when transit rights become unclear
The maritime insurance industry's response to April 2026 Hormuz disruptions demonstrates how legal uncertainty immediately translates to increased operational costs. European natural gas forecasts showed significant volatility, with futures dropping 20% following ceasefire announcements, illustrating how insurance markets price legal and political risks into commodity flows.
Which Economic Sectors Would Face the Greatest Impact?
A Hormuz shipping toll would create disparate impacts across economic sectors, with energy-intensive industries and global supply chain operators facing the most immediate cost pressures. The concentration of petroleum product flows through this chokepoint means that toll costs would cascade through multiple layers of the global economy.
Energy Market Disruption Analysis
Immediate Cost Transfer Mechanisms:
• Crude Oil Markets: $8-15 per barrel premium distributed across global pricing benchmarks
• Refined Products: 20-35% spot price increases for gasoline, diesel, and jet fuel
• LNG Markets: 25-40% spot price escalation affecting European and Asian buyers
• Petrochemical Feedstocks: Raw material cost increases ranging 15-30% depending on product complexity
• Strategic Reserve Deployment: Government-mandated releases from national stockpiles
Recent market evidence from April 2026 supports these projections. Exxon Mobil reported $2.9 billion Q1 earnings increases due to higher oil prices, while Shell expects significantly higher oil trading profits during the same period. These corporate responses demonstrate how energy sector participants immediately capture toll-equivalent price premiums during Hormuz disruptions.
Global Supply Chain Vulnerabilities
Container Shipping Economics:
A $2 million toll distributed across a typical 20,000 TEU container vessel equals $100 per container surcharge. This calculation assumes full vessel utilisation, but actual costs would likely reach $125-150 per container when accounting for:
- Partial loading factors during uncertain transit periods
- Insurance premium increases ranging 200-400%
- Schedule disruption costs from payment processing delays
- Alternative routing expenses for risk-averse cargo owners
The tariffs investment impact would compound these challenges, as higher shipping costs intersect with trade policy pressures to create multiple layers of supply chain cost escalation.
Manufacturing Input Cost Escalation:
Industries dependent on Gulf-sourced petrochemical inputs would face immediate margin compression:
| Manufacturing Sector | Input Cost Increase | Timeline to Impact | Alternative Sources |
|---|---|---|---|
| Plastics/Polymers | 25-35% | 2-3 weeks | Limited capacity |
| Automotive Components | 15-20% | 4-6 weeks | Regional suppliers |
| Electronics Assembly | 10-15% | 6-8 weeks | Asian alternatives |
| Pharmaceutical Intermediates | 30-50% | 1-2 weeks | Synthetic routes |
Just-in-Time Inventory System Breakdowns:
Modern supply chains operating with minimal buffer inventory would face immediate disruptions. China's announcement of potential airline bailouts due to fuel shock demonstrates how toll-equivalent costs rapidly propagate through interconnected industries.
Regional Economic Dependencies
Gulf State Export Reliance:
| Country | Hormuz Export Dependency | Daily Revenue at Risk | Fiscal Impact |
|---|---|---|---|
| Saudi Arabia | 75% of oil exports | $890 million | 45% of government revenue |
| UAE | 90% of re-export trade | $1.2 billion | 35% of GDP contribution |
| Kuwait | 95% of petroleum shipments | $420 million | 85% of export earnings |
| Qatar | 100% of LNG exports | $180 million | 25% of national income |
The April 2026 attacks on Saudi Arabia's SATORP refinery and East-West Pipeline illustrate how regional producers face compound vulnerabilities when both maritime and terrestrial export routes encounter disruptions simultaneously.
How Do Geopolitical Risk Calculations Factor Into Toll Viability?
Geopolitical risk assessment becomes paramount when evaluating Hormuz shipping toll implementation, as enforcement mechanisms would inevitably trigger broader international responses. The strategic importance of this waterway means that toll collection cannot be analysed purely as an economic policy, but rather as a geopolitical action with cascading diplomatic and military implications.
Military Escalation Probability Models
Scenario Analysis Framework:
Low-Intensity Enforcement Response:
- Diplomatic protests through UN Security Council
- Economic sanctions on toll collection infrastructure
- International legal challenges via International Court of Justice
- Probability: 85-90% initial response
- Timeline: 2-4 weeks implementation
Medium-Intensity Response Coordination:
- Naval convoy escort operations by affected flag states
- Coordinated non-compliance by major shipping alliances
- Strategic petroleum reserve releases by consumer nations
- Probability: 60-70% if diplomatic solutions fail
- Timeline: 4-8 weeks escalation period
High-Intensity Escalation Scenarios:
- Military confrontation over vessel detention incidents
- Regional alliance activation (NATO Article 5 considerations)
- Broader Middle East conflict expansion
- Probability: 15-25% under sustained toll enforcement
- Timeline: 8-12 weeks maximum before crisis point
The April 2026 timeline provides real-world evidence of escalation dynamics. Trump's threats to reconsider NATO participation unless European countries take more active roles in Hormuz illustrates how chokepoint control immediately becomes a broader alliance issue rather than a bilateral trade dispute.
Alliance Response Coordination Challenges
NATO Article 5 Applicability Questions:
Traditional collective defence frameworks face interpretive challenges when applied to commercial maritime disputes. Article 5 covers armed attacks against member territory, but legal scholars debate whether commercial vessel detention constitutes sufficient provocation for collective response activation.
Gulf Cooperation Council Unified Position Requirements:
GCC member states face conflicting incentives regarding Hormuz toll enforcement. While Saudi Arabia and UAE benefit from higher oil prices, their economic models depend on reliable export access. The April 2026 headlines showing Gulf producers taking first steps toward resuming Hormuz oil flows suggests regional consensus favours rapid transit normalisation over toll revenue collection.
China-Russia Strategic Calculation Variables:
Major non-Western powers would likely exploit Hormuz toll disputes to advance alternative trade route development. Chinese oil tankers attempting Hormuz exits in April 2026 demonstrates Beijing's willingness to test enforcement capabilities, while Russian-flagged supertankers successfully transiting suggests Moscow views chokepoint disruption as strategically beneficial for alternative energy route development.
These dynamics reflect broader trade war strategies where maritime chokepoints become focal points for competing spheres of influence rather than simple commercial disputes.
Insurance Market Reaction Mechanisms
War Risk Premium Multiplication Factors:
| Risk Category | Current Premium | Toll Scenario Premium | Multiplier Effect |
|---|---|---|---|
| Hull & Machinery | 0.15-0.25% | 0.75-1.25% | 4-5x increase |
| Cargo Coverage | 0.10-0.20% | 0.60-1.00% | 5-6x increase |
| Crew Life Insurance | $2,500/person | $12,500/person | 5x increase |
| Business Interruption | 0.05-0.10% | 0.30-0.50% | 6x increase |
Coverage Availability Restrictions:
Lloyd's of London syndicates would likely implement territorial exclusions for Hormuz transit during active toll enforcement, forcing vessel operators to seek coverage through specialised war risk markets with limited capacity and higher deductibles.
Self-Insurance Corporate Strategies:
Major shipping companies and energy corporations would accelerate captive insurance company development to internalise risks that commercial markets refuse to cover at reasonable rates. This shift toward self-insurance reduces market transparency and complicates risk pricing mechanisms across the broader maritime industry.
The next major ASX story will hit our subscribers first
What Alternative Revenue Generation Models Could Iran Consider?
Rather than implementing controversial toll collection mechanisms, Iran could pursue internationally recognised revenue streams that align with established maritime service provision models. These approaches would generate income while maintaining compliance with international law and avoiding the geopolitical complications inherent in toll enforcement.
Legitimate Maritime Service Provision
Internationally Accepted Revenue Approaches:
- Pilotage Services for Complex Navigation – Mandatory pilot programmes for vessels over specific tonnages, generating $15,000-25,000 per transit
- Tugboat Assistance for Emergency Situations – On-call rescue and assistance services priced at $50,000-100,000 per incident
- Weather Routing Information Systems – Subscription-based meteorological and oceanographic data services
- Port Facility Development Partnerships – Joint venture infrastructure projects with international shipping companies
- Maritime Security Cooperation Frameworks – Cost-sharing arrangements for anti-piracy and counter-terrorism operations
The Malacca Strait model demonstrates successful voluntary contribution systems where Singapore, Malaysia, and Indonesia coordinate security services funded through $45 million annually in shipping industry contributions. This approach generates revenue while maintaining compliance with international transit rights.
Regional Economic Integration Opportunities
Free Trade Zone Development:
Iran could establish specialised economic zones at key locations along the Hormuz approach, offering expedited customs processing, bonded warehouse facilities, and ship supply services. Dubai's Jebel Ali model generates $35 billion annually through similar integrated logistics services.
Transshipment Hub Establishment:
Strategic port development could capture container transshipment traffic currently handled by Dubai and other regional hubs. Modern container terminals require $2-3 billion initial investment but generate $500-800 million annual revenues at full capacity.
Technology-Based Revenue Models
Vessel Traffic Service (VTS) Systems:
Mandatory traffic coordination services could generate legitimate revenue while improving navigation safety. Advanced VTS systems charge $5,000-8,000 per transit for radar tracking, communication coordination, and collision avoidance services.
Environmental Service Provision:
Ballast water treatment facilities, waste reception services, and emissions monitoring could create revenue streams while addressing international environmental compliance requirements. These services typically generate $2,000-5,000 per vessel depending on service scope.
The April 2026 India announcements about importing Iranian oil for the first time in seven years suggests that diplomatic normalisation could unlock broader economic cooperation opportunities that would prove more sustainable than controversial toll mechanisms.
Which Technological Solutions Could Circumvent Toll Collection?
Modern maritime technology offers vessel operators multiple avenues to potentially circumvent toll collection systems, particularly those relying on digital documentation and traditional identification methods. The sophistication of current navigation and communication systems creates opportunities for technological evasion that would significantly complicate enforcement efforts.
Digital Documentation Evasion Methods
Blockchain-Based Vessel Identity Systems enable operators to maintain multiple digital identities for individual vessels, potentially allowing ships to present different documentation sets depending on transit requirements. Current International Maritime Organisation (IMO) identification systems lack blockchain integration, creating verification gaps that sophisticated operators could exploit.
Alternative Communication Protocols:
- Satellite-based mesh networks operating outside traditional maritime communication channels
- Encrypted VHF radio systems using frequency-hopping spread spectrum technology
- Low Earth Orbit (LEO) satellite constellations providing communication redundancy
- Military-grade communication equipment available through defence contractor networks
Automated Identification System (AIS) Manipulation:
Vessel operators can legally disable AIS transponders in areas where piracy or security threats exist. This legitimate safety provision creates opportunities for vessels to transit chokepoints without electronic identification, particularly during periods when toll enforcement relies heavily on automated tracking systems.
Route Optimisation Technologies
AI-Powered Navigation Systems:
Modern algorithmic navigation can identify optimal transit windows based on:
- Real-time enforcement pattern analysis using satellite imagery
- Weather and sea state optimisation for minimum detection probability
- Traffic density modelling to blend with legitimate commercial traffic
- Fuel consumption algorithms calculating cost-benefit ratios for alternative routing
Real-Time Weather Routing:
Advanced meteorological systems enable vessels to exploit natural visibility limitations such as fog, sandstorms, or heavy precipitation that could complicate visual identification and enforcement operations. Commercial weather routing services already provide this capability for operational efficiency.
Autonomous Vessel Deployment Scenarios
Unmanned Cargo Ship Development Timelines:
Current autonomous vessel technology suggests that remotely operated cargo ships could begin commercial operations within 3-5 years. These vessels would eliminate crew safety concerns that typically constrain aggressive enforcement actions, as detention would only affect unmanned assets rather than personnel.
Remote Operation Capability Expansion:
- Shore-based control centres operating multiple vessels simultaneously
- Satellite communication redundancy providing continuous operational control
- Automated emergency systems handling technical failures without human intervention
- Blockchain-based cargo ownership eliminating traditional documentation requirements
Regulatory Framework Adaptation Requirements:
International maritime law currently requires human oversight for commercial vessel operations. IMO regulation amendments would be necessary to accommodate fully autonomous commercial shipping, creating a regulatory lag period where traditional toll collection mechanisms might face technological obsolescence.
The April 2026 examples of Russian, Chinese, and Malaysian vessels successfully transiting Hormuz during conflict periods suggest that determined operators already employ sophisticated route planning and timing strategies to minimise enforcement risks.
How Would Market Forces Ultimately Determine Toll Sustainability?
Market mechanisms would ultimately determine whether Hormuz shipping toll systems could achieve long-term viability, as economic actors adjust behaviour patterns in response to new cost structures. The fundamental principles of supply and demand, combined with alternative resource development and technological adaptation, would create powerful forces that could undermine toll collection sustainability over time.
Demand Elasticity Calculations
Economic theory suggests that essential commodity transport through critical chokepoints exhibits extremely low price elasticity, meaning even high tolls may not significantly reduce traffic volume in the short term. However, this analysis requires nuanced understanding of substitution mechanisms and adaptation timelines.
Short-Term Price Elasticity (0-6 months):
- Crude Oil Transit: -0.05 to -0.15 elasticity coefficient
- LNG Shipments: -0.10 to -0.25 elasticity coefficient
- Container Traffic: -0.20 to -0.40 elasticity coefficient
- Refined Products: -0.15 to -0.35 elasticity coefficient
Long-Term Adaptation Elasticity (2-5 years):
- Alternative Energy Development: -0.60 to -0.85 elasticity coefficient
- Pipeline Infrastructure: -0.45 to -0.70 elasticity coefficient
- Regional Production Shifts: -0.50 to -0.75 elasticity coefficient
The April 2026 market responses provide real-world elasticity evidence. Oil prices reaching $111 per barrel with minimal demand reduction suggests short-term inelasticity, while 140% surge in China's EV exports indicates accelerated long-term substitution mechanisms.
Competitive Pressure Analysis
Alternative Energy Source Acceleration:
Sustained toll costs would accelerate renewable energy deployment and energy efficiency investments. China's EV export surge during the April 2026 oil price shock demonstrates how energy cost pressures rapidly alter consumption patterns and industrial investment priorities.
Regional Production Capacity Expansion:
| Development Project | Capacity Addition | Timeline | Investment Required |
|---|---|---|---|
| North American Shale | 3.5 million bpd | 18-24 months | $75 billion |
| Brazilian Offshore | 2.2 million bpd | 24-36 months | $65 billion |
| Guyana Development | 1.8 million bpd | 30-42 months | $45 billion |
| Norwegian Arctic | 1.2 million bpd | 36-48 months | $85 billion |
Strategic Reserve Utilisation Strategies:
Consumer nations would accelerate strategic petroleum reserve deployments to buffer toll costs while alternative supplies develop. Japan's announcements about releasing additional oil reserves during April 2026 demonstrates how consuming countries use inventory management to reduce chokepoint dependency.
Long-Term Infrastructure Investment Responses
Pipeline Construction Acceleration:
Sustained Hormuz toll pressure would justify previously uneconomical pipeline projects:
- Trans-Arabia Pipeline Expansion: Additional 4 million bpd capacity through Saudi territory
- Iran-Pakistan-India Pipeline: 1.5 billion cubic feet daily gas capacity
- Central Asia-China Gas Corridors: Expanded capacity reducing LNG import dependency
- Arctic Pipeline Development: New routes through Russian territory to Asian markets
Port Facility Diversification:
Alternative export terminals would capture market share from Hormuz-dependent facilities:
- Red Sea Terminals: Expanded Saudi and Egyptian export capacity
- Caspian Sea Development: Kazakhstan and Azerbaijan pipeline connections
- Mediterranean Expansion: Libya and Algeria increased throughput capacity
- Arctic Terminal Construction: Year-round ice-resistant facilities
Transportation Mode Substitution:
Rail and overland transport infrastructure would become economically competitive for certain cargo categories when maritime toll costs reach threshold levels. The New Silk Road initiatives already demonstrate large-scale overland alternatives for containerised trade between Asia and Europe.
What Historical Precedents Exist for Maritime Toll Disputes?
Historical analysis of maritime chokepoint disputes provides critical insights into how toll collection attempts typically evolve, the international responses they generate, and their ultimate resolution mechanisms. These precedents demonstrate consistent patterns of economic, legal, and military responses that would likely recur in contemporary Hormuz toll scenarios.
Suez Canal Nationalisation Crisis (1956)
The 1956 Suez Crisis offers the most relevant historical precedent for unilateral control assertion over critical maritime infrastructure. When Egypt nationalised the Suez Canal Company and imposed new transit conditions, the international response demonstrated how chokepoint control immediately becomes a broader geopolitical issue.
International Response Coordination:
- Military Intervention: Britain, France, and Israel coordinated armed response within 4 months
- Economic Disruption: Global oil prices increased 300-400% during closure period
- Alternative Route Development: Tanker fleet expansion for Cape of Good Hope routing
- Diplomatic Resolution: United Nations Emergency Force deployment and negotiated reopening
Economic Disruption Duration:
The canal remained effectively closed for 6 months, during which global shipping patterns permanently shifted. European oil imports from Middle East sources decreased 35% as alternative supply relationships developed, illustrating how chokepoint disruptions create lasting market structure changes.
Tanker War Economic Impacts (1980s)
The Iran-Iraq Tanker War (1984-1988) provides direct historical precedent for Hormuz navigation disputes under Iranian control. This period demonstrates how maritime chokepoint conflicts evolve when enforcement capabilities and international responses interact over extended periods.
Insurance Market Evolution:
- War Risk Premiums: Increased from 0.25% to 7.5% of vessel value
- Lloyd's War Risks Committee: Implemented geographic exclusion zones
- Flag State Responses: Neutral shipping flags proliferated to avoid targeting
- Self-Insurance Development: Major oil companies developed captive insurance structures
Naval Protection Convoy Systems:
Operation Earnest Will demonstrated how consumer nations respond to chokepoint threats through military escort services. U.S. Navy convoys escorted Kuwaiti tankers re-flagged under American protection, establishing precedent for military responses to commercial shipping disruption.
Cost-Sharing Mechanisms:
International coordination emerged through:
- NATO coordination for European vessel protection
- Bilateral agreements between Gulf producers and consumer nations
- Commercial shipping alliances pooling security costs
- Insurance industry coordination standardising risk assessment procedures
Modern Piracy Response Models
Contemporary anti-piracy operations off Somalia provide relevant precedents for international coordination mechanisms addressing maritime security threats that impose costs on commercial shipping.
International Coordination Frameworks:
- Combined Task Force 151: Multi-national naval coordination
- EU Naval Force ATALANTA: European Union maritime security operations
- NATO Ocean Shield: Alliance-based convoy protection
- Industry Self-Organisation: Best Management Practices development
Private Security Integration:
The maritime industry developed Privately Contracted Armed Security Personnel (PCASP) programmes that could serve as models for Hormuz toll avoidance:
- Legal Framework Development: Flag state authorisation procedures
- Insurance Coverage Integration: Reduced premiums for armed vessel protection
- Industry Standards: International Association of Maritime Security Professionals protocols
- Cost Distribution: Shared security expenses across shipping alliances
Resolution Timeline Analysis:
Somali piracy declined significantly after 4-5 years of coordinated international response, suggesting that sustained multilateral pressure can effectively address maritime chokepoint threats. However, the resolution required:
- $2.3 billion annual international naval operation costs
- Land-based intervention addressing root causes in Somalia
- Legal framework development for piracy prosecution
- Industry adaptation through route changes and security measures
According to the BBC's analysis of recent maritime disruptions, historical patterns suggest that chokepoint disputes typically follow predictable escalation timelines before reaching resolution through diplomatic or military intervention.
Frequently Asked Questions About Hormuz Toll Implementation
Could Iran legally enforce toll collection under international law?
International maritime law generally prohibits toll collection for innocent passage through international straits, making enforcement legally questionable and diplomatically provocative. UNCLOS Article 38 establishes transit passage rights that prevent coastal states from imposing fees or conditions that would hamper navigation through straits connecting international waters.
The legal distinction between territorial waters (where limited coastal state jurisdiction exists) and international straits (where transit passage rights dominate) creates significant constraints on toll enforcement. Historical precedent shows that attempts to impose unauthorised chokepoint fees typically trigger international legal challenges and diplomatic pressure.
Recent analysis from Al Jazeera examining Iran's proposed maritime protocols indicates that international recognition would likely remain limited, regardless of domestic implementation efforts.
How would shipping companies likely respond to toll demands?
Most major shipping lines would likely seek alternative routes, increase insurance coverage, or coordinate with naval protection services rather than establish precedent-setting toll payments. The container shipping industry operates on standardised alliance structures that facilitate coordinated responses to operational disruptions.
Primary Response Mechanisms:
- Route Diversification: Shifting cargo to Cape of Good Hope routing despite additional costs
- Insurance Optimisation: Purchasing comprehensive war risk coverage instead of paying tolls
- Alliance Coordination: Industry-wide non-compliance agreements among major carriers
- Naval Escort Requests: Coordination with flag state or consumer nation military protection
- Cargo Contract Renegotiation: Force majeure clauses to shift costs to cargo owners
The April 2026 examples of vessels successfully transiting during conflict periods suggest that shipping operators already employ sophisticated risk management strategies that could be adapted for toll avoidance scenarios.
What would be the timeline for global market adjustment?
Initial shock effects would occur within 24-48 hours, with medium-term adaptations (alternative routing, strategic reserve releases) taking 30-90 days to implement effectively. However, complete market rebalancing would require 18-36 months for infrastructure development and supply chain reorganisation.
Adjustment Timeline Framework:
Phase 1 (0-2 weeks): Immediate Price Response
- Oil futures markets price in risk premiums
- Insurance markets implement geographic restrictions
- Strategic petroleum reserve releases begin
- Emergency alternative routing arrangements
Phase 2 (2-12 weeks): Operational Adaptation
- Container shipping alliances implement route changes
- Energy companies activate alternative supply contracts
- Naval escort operations establish regular schedules
- Pipeline capacity optimisation programmes
Phase 3 (3-18 months): Infrastructure Investment
- Alternative export terminal construction acceleration
- Pipeline expansion project approval and funding
- Strategic reserve capacity increases
- Regional refining capacity development
Phase 4 (18-36 months): Market Structure Realignment
- Permanent supply chain route modifications
- New long-term energy supply contracts
- Alternative chokepoint utilisation patterns
- Regional economic dependency rebalancing
The implementation of a Hormuz shipping toll would ultimately face insurmountable challenges from international legal frameworks, military response capabilities, technological circumvention methods, and fundamental market adaptation mechanisms. Historical precedent consistently demonstrates that attempts to control critical maritime chokepoints through unilateral toll collection generate coordinated international responses that typically resolve through diplomatic or military intervention within relatively short timeframes.
What About Opportunities in Energy Infrastructure Investments?
Regional conflicts and shipping disruptions often create exceptional investment opportunities in energy infrastructure and resource development companies. Discovery Alert's proprietary Discovery IQ model delivers real-time alerts on significant ASX mineral and energy discoveries, enabling investors to identify actionable opportunities before broader market recognition. Begin your 14-day free trial today to position yourself ahead of market developments affecting global supply chains.