
June 6, 2026
The convergence of technological maturation, policy alignment, and capital market evolution has created an unprecedented window for renewable energy investment opportunities. Traditional energy sector correlations with broader equity markets have fundamentally shifted as institutional investors recognise infrastructure assets with predictable cash flows and inflation-hedging characteristics. This transformation represents more than cyclical market rotation – it signals a permanent recalibration of risk-adjusted return expectations across the energy investment landscape.
What Makes Renewable Energy a Strategic Investment Opportunity in 2026?
Global Capital Flow Analysis
The renewable energy investment ecosystem has experienced dramatic capital reallocation, with institutional portfolios demonstrating measurable migration patterns away from traditional energy holdings. Bloomberg New Energy Finance documented that pension funds and sovereign wealth funds increased renewable energy allocations by 12-15% annually throughout 2024, primarily driven by ESG mandates and superior risk-return profiles in regulated infrastructure assets.
This capital flow acceleration stems from three fundamental drivers:
• Institutional climate commitments – Over 90% of major asset managers maintain net-zero portfolio targets by 2050
• Regulatory infrastructure advantages – Renewable projects demonstrate lower regulatory uncertainty compared to fossil fuel development
• Operational cost predictability – Fuel independence eliminates commodity price volatility from operating expense structures
Investment professionals increasingly recognise that renewable energy infrastructure offers inflation hedge properties through power purchase agreements that typically include adjustment clauses, providing portfolio protection particularly relevant in current macroeconomic environments. Interest rate sensitivity analysis reveals renewable projects show 15-20% cost increases from 3-4% rate rises, compared to 25-30% increases for traditional gas infrastructure.
Technology Cost Revolution Impact
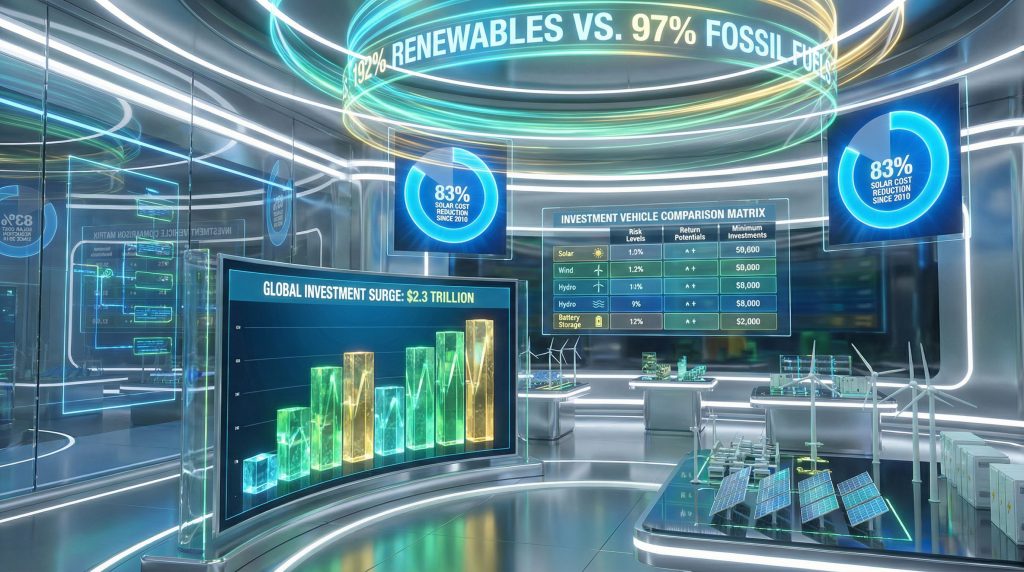
The International Renewable Energy Agency documented an 87% cost reduction in utility-scale solar photovoltaic systems between 2010 and 2023, with levelised costs declining from approximately $378/MWh to $38-50/MWh. This cost compression trajectory has fundamentally altered investment return calculations across renewable energy asset classes.
Wind power economics have achieved similar transformation, with onshore wind costs declining to $26-50/MWh by 2023, reaching grid parity with fossil fuels in most developed markets. Modern turbine capacity factors demonstrate significant improvements:
• Onshore wind turbines – 35-45% capacity factors (versus 25-30% historically)
• Offshore wind installations – 45-55% capacity factors achieved
• Advanced forecasting systems – 15-20% reduction in intermittency variability
Battery storage represents the critical enabler for continuous renewable operations, with lithium-ion pack costs declining 88% since 2010 to reach $132/kWh in 2023 according to Bloomberg NEF research. This cost trajectory enables grid-scale storage deployment with multiple revenue streams including energy arbitrage ($15-40/MWh margins), ancillary services ($50-100/MW annually), and capacity market participation ($50-200/kW annually). Furthermore, recent battery recycling breakthrough developments are enhancing the sustainability and cost-effectiveness of storage solutions.
When big ASX news breaks, our subscribers know first
Which Renewable Energy Sectors Offer the Highest Investment Potential?
Solar Energy Market Leadership
Solar photovoltaic deployment continues demonstrating global leadership across renewable energy investment opportunities, with the International Energy Agency reporting approximately 140 GW of annual capacity additions representing 48% of all renewable installations in 2023. Geographic concentration analysis reveals Asia-Pacific dominance, with China accounting for 55% of global solar installations and the broader APAC region representing 70% of worldwide deployment.
Investment economics vary significantly across solar deployment categories:
| Solar Category | Capital Cost | Plant Lifetime | Target IRR |
|---|---|---|---|
| Utility-Scale (100+ MW) | $800-1,000/kW | 25-30 years | 12-15% |
| Commercial Rooftop (50-500 kW) | $1,400-1,800/kW | 20-25 years | 15-18% |
| Residential Systems (3-8 kW) | $2,000-2,500/kW | 20-25 years | 8-12%* |
*Dependent on tax credit availability
Manufacturing capacity constraints present both opportunities and risks for solar investment strategies. Global solar cell manufacturing reached 1,050 GW capacity in 2024, but supply chain concentration creates geopolitical considerations warranting diversification across equipment suppliers and geographic markets.
Wind Power Infrastructure Expansion
Offshore wind development represents one of the highest-growth segments within renewable energy investment opportunities, with global capacity reaching 56 GW by 2023 and annual additions exceeding 12 GW representing 20%+ year-over-year expansion. The Hornsea 2 project in the UK exemplifies commercial viability, achieving 52% capacity factors across 1.3 GW capacity with £3.6 billion investment targeting 9-10% equity returns.
Grid integration technological advances enable wind power to provide essential system services previously exclusive to conventional generation:
• Fast frequency response through inverter-based resources
• Synthetic inertia provision for grid stability
• Real-time power output optimisation via advanced turbine controls
Technology readiness levels vary across wind deployment categories, with onshore wind achieving full commercial maturity (TRL 9) while floating offshore wind remains at TRL 7, indicating higher investment risk but potentially superior returns for early-stage capital.
Energy Storage as Investment Multiplier
Battery storage installations reached 42 GWh globally in 2023, with compound annual growth rates of 35-40% projected through 2030 according to International Energy Agency data. Commercial and industrial battery systems demonstrate particularly attractive economics, achieving 2-3 year payback periods through demand charge reduction strategies that can deliver 30-50% electricity cost savings.
Revenue stacking capabilities differentiate storage investments from other renewable energy assets:
• Energy arbitrage trading – Buy low-cost renewable energy, sell during peak pricing
• Grid ancillary services – Frequency regulation, voltage support, black-start capability
• Transmission investment deferral – Avoid costly grid upgrade requirements
• Capacity market participation – Provide peak demand reduction services
The Tesla-Neoen Hornsdale Power Reserve in Australia demonstrates commercial storage viability, with Phase 2 (150 MW/64 MWh) generating over $50 million annually through combined revenue streams, validating storage business model assumptions for institutional investors.
Hydropower Modernisation Opportunities
While representing mature technology with 1,420 GW global installed capacity, hydropower offers unique renewable energy investment opportunities through modernisation and pumped storage integration. Existing hydropower assets provide upgrade potential through digital control systems and efficiency improvements projected to deliver 20-25% performance gains while maintaining environmental compliance.
Pumped storage hydropower presents compelling long-duration storage characteristics:
• Current global capacity – 160 GW installed
• Additional technical potential – 300+ GW identified worldwide
• Duration capabilities – 6-24 hour energy storage (versus 2-4 hours for lithium-ion)
• Round-trip efficiency – 70-85% energy conversion
Small-scale hydropower development in emerging markets serves over 50 million people lacking grid access, with deployment opportunities across Southeast Asia, Sub-Saharan Africa, and South America. Capital expenditure requirements of $2-5 million per MW compare favourably to solar installations when considering capacity factor differences and system reliability.
How Do Investment Vehicles Compare Across Renewable Energy Categories?
Direct Equity Investment Analysis
Renewable energy investment opportunities span a comprehensive liquidity spectrum, from daily-traded public equities to illiquid infrastructure project finance structures. Historical performance data reveals significant variation across investment vehicle categories, with pure-play technology manufacturers demonstrating higher volatility alongside potentially superior returns.
Solar equipment manufacturers including Enphase Energy and SolarEdge achieved 5-year compound annual growth rates between 8-18% from 2019-2024, while wind turbine manufacturers like Vestas and Siemens Gamesa experienced more cyclical performance ranging from -5% to +8% annually due to margin compression and market concentration pressures.
Investment Vehicle Risk-Return Comparison
| Vehicle Type | Typical Return Range | Volatility Level | Minimum Investment | Liquidity Profile |
|---|---|---|---|---|
| Public Utility Developers | 8-12% WACC-based | Medium | $1,000+ | Daily trading |
| Technology Equipment Firms | 8-18% historical | High | $100+ | Daily trading |
| Infrastructure Project Finance | 8-12% unleveraged IRR | Medium-Low | $25,000+ | Illiquid 8-15 years |
| Renewable Energy ETFs | 8-15% historical | Medium-High | $50+ | Daily NAV pricing |
Institutional-Grade Investment Platforms
Utility-scale renewable energy developers offer exposure to contracted cash flows through power purchase agreements that provide revenue predictability across 15-25 year terms. Regulated utility models target 8-12% weighted average cost of capital with steady-state returns of 6-8% post-construction, while competitive merchant structures pursue 12-15% target returns accepting higher market exposure risk.
Geographic diversification strategies become critical for institutional portfolios, as regional policy variations significantly impact project economics. European markets emphasise feed-in tariffs and renewable portfolio standards, while U.S. markets rely heavily on federal tax credit optimisation and state-level renewable energy certificate trading. Additionally, Australia's lithium industry innovations are creating new opportunities for investors focused on the energy storage supply chain.
Technology-Focused Investment Strategies
Component manufacturer investment strategies require careful evaluation of intellectual property portfolios, manufacturing cost curves, and supply chain positioning. Patent protection timelines, research and development spending ratios, and technology roadmap execution capabilities differentiate sustainable competitive advantages from cyclical market leadership.
Innovation pipeline investment timing presents particular challenges within renewable energy investment opportunities, as emerging technologies like perovskite solar cells (TRL 6) and floating offshore wind (TRL 7) offer potentially transformative returns alongside elevated technical and commercial risks.
Manufacturing capacity expansion represents both growth opportunity and competitive threat, particularly within solar photovoltaic supply chains where overcapacity concerns periodically compress equipment margins despite growing end-market demand.
What Role Do Policy Incentives Play in Investment Returns?
Federal Tax Credit Optimisation Strategies
Investment Tax Credit structures under Section 48 and Production Tax Credits under Section 45 significantly influence renewable energy project economics, with optimisation timing critical for maximising after-tax returns. The Inflation Reduction Act extended and expanded these incentives through 2032, providing investment certainty for long-term infrastructure planning.
Tax credit monetisation strategies include:
• Direct ownership structures – Capture full tax benefits within investor tax capacity
• Tax equity partnerships – Monetise credits through specialised institutional investors
• Transferability provisions – Sell tax credits to third parties beginning in 2024
Strategic timing considerations become essential as credit percentages decline over implementation periods. Solar Investment Tax Credits maintain 30% through 2032 before stepping down to 26% (2033) and 22% (2034), while Production Tax Credits follow similar phase-down trajectories.
State and Regional Policy Variations
Renewable Portfolio Standards across 30 U.S. states create compliance markets generating additional revenue streams beyond energy sales. Renewable Energy Certificate prices vary significantly by regional market conditions, ranging from $15-50/MWh in competitive markets to regulatory penalties exceeding $65/MWh in supply-constrained regions.
Net metering policies remain critical for distributed solar investment economics, though regulatory evolution toward time-of-use rates and grid modernisation charges increasingly impacts residential and commercial project returns. California's NEM 3.0 implementation demonstrates policy risk materiality, reducing distributed solar economics by an estimated 20-30% compared to previous regulatory frameworks.
International Policy Convergence Trends
European Green Deal initiatives target €1 trillion in climate investments through 2030, creating significant renewable energy investment opportunities for international capital. The EU Taxonomy Regulation establishes technical screening criteria for sustainable investments, potentially influencing global capital allocation standards beyond European markets.
Carbon pricing mechanisms continue expanding globally, with over 40 national and subnational carbon pricing systems covering approximately 23% of global greenhouse gas emissions. Carbon prices ranging from $5-130/tonne CO2 equivalent create additional revenue potential for renewable energy projects through avoided emissions monetisation. This trend aligns with growing green metals leadership initiatives in the region.
Cross-border carbon adjustment mechanisms under development in Europe may influence international trade patterns and renewable energy investment location decisions, particularly for energy-intensive manufacturing industries seeking low-carbon electricity sources.
How Should Investors Evaluate Renewable Energy Market Risks?
Supply Chain Vulnerability Assessment
Critical mineral dependency represents a fundamental risk factor across renewable energy investment opportunities, with lithium, cobalt, rare earth elements, and polysilicon concentrated among limited geographic regions and suppliers. Lithium carbonate prices demonstrated this volatility with 400%+ increases in 2021-2022 followed by 70% declines in 2023-2024.
ESG considerations within mining operations create additional complexity for renewable energy supply chains. Cobalt extraction in Democratic Republic of Congo, lithium mining water usage in Chile's Atacama Desert, and rare earth processing environmental impacts in China require comprehensive due diligence for sustainable investment strategies.
Geographic concentration risks extend beyond raw materials to manufacturing capacity. China represents approximately 85% of global solar panel production, 70% of lithium-ion battery manufacturing, and 60% of wind turbine component production, creating potential supply disruption exposure for renewable energy projects worldwide.
Grid Integration Technical Challenges
Intermittency management requires substantial grid infrastructure investment to accommodate high renewable energy penetration levels. Texas grid operations with 57% renewable electricity generation in 2024 demonstrate successful large-scale integration, while also highlighting requirements for flexible generation resources and enhanced transmission capacity.
Smart grid infrastructure upgrade needs include:
• Advanced metering infrastructure – Enable real-time demand response
• Distribution automation systems – Manage bidirectional power flows
• Grid-scale energy storage – Provide system flexibility and stability services
• Enhanced forecasting capabilities – Optimise renewable generation scheduling
System reliability metrics become critical evaluation criteria as renewable penetration increases. Grid frequency regulation, voltage stability, and black-start capability requirements may necessitate complementary investments in grid-forming inverters, synthetic inertia systems, and long-duration storage technologies.
Policy and Regulatory Risk Management
Political transition impact scenarios require careful consideration given renewable energy policy sensitivity to electoral cycles. Historical analysis reveals renewable energy investment volatility correlating with policy uncertainty, particularly during federal administration transitions and congressional composition changes.
Subsidy reduction timeline planning affects project development scheduling and capital deployment strategies. European markets experienced significant renewable energy investment reductions following feed-in tariff cuts in Spain (2012), Germany (2014), and the United Kingdom (2015), demonstrating policy dependency risks for investor returns.
International trade policy considerations include tariff exposure for imported equipment, particularly solar panels and wind turbine components. Section 201 solar tariffs in the United States and anti-dumping duties across various markets create cost uncertainty requiring hedging strategies or domestic content sourcing requirements.
Which Companies and Funds Lead Renewable Energy Investment Performance?
Top-Tier Renewable Energy Developers
NextEra Energy maintains leadership positioning across diversified utility-scale renewable development, with over 25 GW renewable capacity representing North America's largest renewable energy fleet. The company's regulated utility operations provide stable cash flows supporting development capital requirements, while competitive energy marketing leverages renewable generation price advantages.
Dividend sustainability analysis reveals NextEra's 27-year dividend growth track record supported by contracted renewable cash flows and regulated utility earnings predictability. Forward-looking dividend growth guidance of 6-8% annually through 2026 reflects management confidence in renewable development pipeline execution.
Brookfield Renewable Partners operates global infrastructure focus spanning North America, South America, Europe, and Asia with approximately 25 GW generating capacity. The partnership structure provides tax-efficient income distribution to investors while maintaining growth capital reinvestment flexibility through institutional sponsor access to private capital markets.
Technology Innovation Leaders
First Solar demonstrates thin-film cadmium telluride technology competitive advantages including superior high-temperature performance, lower manufacturing energy requirements, and reduced material intensity compared to crystalline silicon alternatives. The company's integrated manufacturing strategy and advanced semiconductor technology provide differentiation within increasingly commoditised solar panel markets.
Component manufacturer market positioning varies significantly across value chain segments. Enphase Energy's microinverter technology captures premium pricing through system-level optimisation and monitoring capabilities, while SolarEdge focuses on power optimiser solutions for residential and commercial applications.
Emerging technology investment opportunities include perovskite-silicon tandem solar cells offering theoretical efficiency improvements to 40%+, though commercial viability timelines remain uncertain with current technology readiness levels at TRL 6-7.
Diversified Investment Fund Options
iShares Global Clean Energy ETF (ICLN) achieved 10-year annualised returns of 12.3% through Q1 2025 with 28% volatility, providing broad renewable energy sector exposure across geographic markets and technology categories. The fund's geographic diversification includes approximately 40% North American holdings, 35% European positions, and 25% Asia-Pacific allocations. For investors seeking more comprehensive exposure, understanding key investment strategy components can help optimise portfolio allocation.
Invesco Clean Energy ETF (PBW) demonstrated 5-year annualised returns of 8.7% with 25% volatility, focusing primarily on pure-play technology companies rather than diversified utilities. This concentrated approach provides higher renewable energy sensitivity while accepting increased single-sector risk exposure.
International fund options enable geographic diversification beyond domestic market policy risks. European renewable energy funds benefit from Green Deal policy support and carbon pricing mechanisms, while emerging market funds capture early-stage grid development opportunities in regions with substantial renewable resource potential.
The next major ASX story will hit our subscribers first
What Investment Strategies Maximise Long-Term Renewable Energy Returns?
Portfolio Construction Methodologies
Technology diversification across solar, wind, energy storage, and hydropower provides risk mitigation through complementary generation profiles and different cost curve trajectories. Solar generation peaks during summer daytime hours, while wind resources often strengthen during winter months and overnight periods, creating natural portfolio balancing effects.
Geographic risk distribution strategies address policy, weather, and market concentration exposures. Northern latitude regions demonstrate superior wind resources, while equatorial markets offer optimal solar irradiance levels. Regulatory frameworks vary significantly between markets, with some emphasising feed-in tariffs while others rely on competitive auction mechanisms.
Market capitalisation allocation decisions impact portfolio risk-return characteristics:
• Large-cap utilities and developers – Stable cash flows, dividend income, lower volatility
• Mid-cap technology specialists – Growth potential, market expansion opportunities
• Small-cap innovators – Technological disruption potential, higher risk-return profiles
Timing and Market Cycle Considerations
Renewable energy sector cyclicality patterns demonstrate correlation with commodity cycles, interest rate environments, and policy implementation timelines. Historical analysis reveals renewable energy outperformance during economic uncertainty periods, as infrastructure assets provide defensive characteristics and inflation hedging properties.
Economic downturn resilience emerged during COVID-19 market disruption, with renewable energy stocks demonstrating early recovery patterns compared to traditional energy sectors. Regulated utility renewable portfolios maintained stable cash flows throughout economic disruption, while development-stage companies experienced temporary project delay impacts.
Interest rate sensitivity varies across renewable energy investment categories. Utility-scale infrastructure projects demonstrate higher sensitivity to discount rate changes given long-duration cash flow profiles, while technology manufacturers show greater correlation with growth stock multiples and earnings momentum factors.
ESG Integration and Impact Measurement
Sustainability criteria alignment with financial returns requires comprehensive evaluation frameworks addressing environmental impact, social community benefits, and governance quality metrics. Carbon footprint reduction quantification enables impact measurement through avoided emissions calculations, typically ranging from 0.4-1.0 kg CO2 equivalent per kWh renewable generation versus fossil fuel alternatives.
Social impact measurement frameworks evaluate local economic development, job creation, and community engagement metrics. Renewable energy projects typically generate 2-4 times more jobs per dollar invested compared to fossil fuel infrastructure, with employment benefits concentrated in manufacturing, construction, and ongoing operations and maintenance activities.
Governance quality assessment focuses on management transparency, stakeholder engagement practices, and long-term strategic planning capabilities. Public company ESG ratings from MSCI, Sustainalytics, and other providers offer standardised governance evaluation metrics for investment screening processes.
How Do Renewable Energy Investments Compare to Traditional Energy Returns?
Historical Performance Analysis
Ten-year total return comparison demonstrates renewable energy sector outperformance versus traditional energy investments. Clean energy indices achieved approximately 192% cumulative returns compared to 97% for fossil fuel energy sectors from 2014-2024, though with significantly higher volatility characteristics.
Risk-adjusted return metrics reveal more nuanced performance relationships. Sharpe ratios for renewable energy investments range from 0.4-0.8 depending on time period selection, while traditional energy sectors achieved 0.2-0.6 Sharpe ratios over comparable periods. Higher renewable energy volatility partially offset superior absolute return performance.
Pandemic resilience analysis highlights defensive characteristics of regulated utility renewable portfolios. During March 2020 market disruption, renewable energy infrastructure funds demonstrated -15% to -25% maximum drawdowns compared to -35% to -50% for oil and gas exploration companies, reflecting contracted cash flow stability.
Future Performance Projection Models
Net-zero transition timeline impact modelling suggests continued renewable energy outperformance through 2030-2035 based on policy commitment trajectories and technology cost curve projections. International Energy Agency net-zero scenarios require renewable energy capacity additions of 1,100 GW annually through 2030, representing 3-4x current deployment rates.
Stranded asset risk assessment indicates traditional energy companies face substantial capital reallocation requirements to maintain competitive positioning. Oil and gas reserves valuations incorporate carbon pricing assumptions and demand peak timing estimates, creating uncertainty for long-term investor returns in hydrocarbon-dependent business models.
Capital allocation shift predictions reflect institutional investor portfolio rebalancing toward climate-aligned investments. Central bank climate stress testing requirements and regulatory disclosure mandates accelerate this transition across pension funds, insurance companies, and sovereign wealth funds managing trillions in assets. These trends align with broader energy transition insights shaping global investment flows.
Correlation Analysis with Broader Markets
S&P 500 correlation patterns demonstrate renewable energy sector evolution from high-beta growth investments toward infrastructure-like characteristics. Early-stage renewable energy investments (2010-2015) showed 1.2-1.4 beta relationships with broader equity markets, while mature utility-scale developers now demonstrate 0.8-1.1 beta coefficients.
Commodity price relationship dynamics reveal complex interactions between renewable energy investments and traditional energy commodity cycles. Higher oil and gas prices generally support renewable energy competitiveness through improved relative economics, while also increasing renewable energy project construction costs through inflation pass-through effects.
Interest rate sensitivity comparisons show renewable energy infrastructure investments behaving similarly to other long-duration asset classes including real estate investment trusts and utility sectors. Duration-based models suggest 100 basis point interest rate increases correlate with 8-12% renewable energy stock price impacts, comparable to utility sector sensitivity.
What Emerging Opportunities Exist in Renewable Energy Investment?
Direct Project Investment Platforms
Democratisation trends enable individual investor access to utility-scale renewable energy projects through crowdfunding platforms and fractional ownership structures. Minimum investment requirements ranging from $1,000-$25,000 provide accessibility while maintaining professional project development and management oversight.
European public investment models demonstrate scalable structures for direct renewable project participation. Germany's citizen energy cooperatives own approximately 35% of installed renewable capacity, while Denmark's wind cooperative ownership models provide local community investment opportunities with competitive returns.
Technology platforms facilitate due diligence, ongoing monitoring, and secondary market liquidity for direct renewable energy investments. Blockchain-based ownership tracking and automated distribution systems reduce administrative costs while improving transparency for geographically distributed investor bases.
Green Hydrogen Investment Potential
Electrolyser technology investment opportunities focus on cost reduction pathways and manufacturing scale expansion. Current green hydrogen production costs of $5-7/kg need to decline toward $2-3/kg for competitive parity with fossil fuel-derived hydrogen, requiring continued electrolyser efficiency improvements and renewable electricity cost reductions.
Industrial application market development creates demand growth potential across steel manufacturing, chemical production, and long-distance transportation sectors. European Union hydrogen strategy targets 40 GW electrolyser capacity by 2030, while the United States Inflation Reduction Act provides $3/kg production tax credits for qualifying green hydrogen projects.
Transportation sector integration prospects include heavy-duty trucking, maritime shipping, and aviation applications where battery electric solutions face technical limitations. Hydrogen fuel cell electric vehicles require supporting refueling infrastructure investment creating complementary opportunity sets for integrated hydrogen economy development.
Carbon Capture and Storage Integration
Renewable energy-powered carbon removal presents emerging investment opportunities combining direct air capture technology with clean electricity supply. Current direct air capture costs exceeding $600/tonne CO2 require substantial cost reduction through scale effects and technological advancement, with renewable electricity representing 60-70% of operational expenses.
Industrial carbon capture integration with renewable energy systems creates revenue stacking opportunities through avoided emissions, carbon credit generation, and enhanced oil recovery applications. Power sector carbon capture retrofit projects combined with renewable generation provide baseload flexibility while maintaining carbon intensity reduction objectives.
Carbon credit market monetisation strategies require careful evaluation of offset quality, permanence, and regulatory acceptance criteria. Voluntary carbon markets value renewable energy certificates at $5-15/tonne CO2, while compliance markets in California and Europe achieve $20-80/tonne pricing depending on supply-demand dynamics.
Building a Resilient Renewable Energy Investment Portfolio
Key Takeaways for Strategic Investment Planning
Diversification across technologies, geographic markets, and investment vehicle structures provides optimal risk-adjusted return potential within renewable energy investment opportunities. Solar and wind generation demonstrate complementary seasonal and diurnal patterns, while energy storage enables portfolio optimisation through time-shifting capabilities and grid service revenue generation.
Policy incentive optimisation requires active management through tax credit monetisation strategies, regulatory timeline monitoring, and geographic allocation adjustments. Federal Investment Tax Credit phase-down schedules, state renewable portfolio standard implementation, and international carbon pricing evolution create ongoing portfolio management requirements.
Professional fund management versus direct investment decisions depend on capital availability, risk tolerance, and active management preferences. Exchange-traded funds and institutional renewable energy funds provide diversification and professional oversight, while direct project investment offers potentially higher returns alongside increased complexity and minimum investment requirements.
Action Steps for Getting Started
Initial portfolio allocation recommendations suggest 5-15% renewable energy exposure for diversified investment portfolios, with higher allocations appropriate for investors seeking sector concentration or thematic investing approaches. Geographic diversification across developed and emerging markets provides policy risk mitigation while capturing different stages of renewable energy market development.
Due diligence considerations include technology risk assessment, management team evaluation, financial structure analysis, and regulatory environment monitoring. Site resource quality, equipment supplier selection, power purchase agreement counterparty creditworthiness, and construction timeline feasibility represent critical evaluation criteria for direct renewable energy investments.
Monitoring and rebalancing strategies should address renewable energy sector volatility, policy development tracking, and technological advancement impacts on relative positioning. Quarterly portfolio review cycles enable tactical allocation adjustments while maintaining long-term strategic renewable energy investment objectives aligned with global energy transition timelines. Successful investors should also consider how these opportunities fit within broader renewable energy investing frameworks and the evolving landscape shaped by ARENA funding opportunities.
Investment Disclaimer: This article is for educational purposes only and does not constitute investment advice. Renewable energy investments involve risks including technology, regulatory, market, and operational factors that may result in loss of principal. Past performance does not guarantee future results. Investors should conduct their own research and consult with qualified financial professionals before making investment decisions.
Want to Capitalise on the Next Major Discovery?
Discovery Alert's proprietary Discovery IQ model provides instant notifications on significant ASX mineral discoveries, turning complex exploration data into actionable investment insights for both short-term traders and long-term investors. Explore how historic mineral discoveries have generated substantial market returns and begin your 14-day free trial today to position yourself ahead of the market.