June 6, 2026
Why Cross-Asset Ratios Reveal What Prices Alone Cannot
Across long cycles of monetary history, the investors who consistently misread precious metals markets share a common analytical error: they watch the price and ignore the relationship. A metal trading at $75 per ounce tells you its nominal cost in the current fiat unit of account. It tells you almost nothing about whether that price represents extraordinary value, fair value, or overvaluation relative to the broader landscape of investable assets. The silver-to-Dow ratio exists precisely to fill this gap, transforming isolated price data into comparative valuation intelligence that spans decades.
Rather than asking what silver costs today, the silver-to-Dow ratio asks a fundamentally different question: how much silver does it take to purchase the entire basket of thirty companies that make up the Dow Jones Industrial Average? The answer, expressed as a single number, encodes far more information than a spot price chart ever could. It captures the relative purchasing power of physical silver against paper equity claims across a historical record stretching back a century.
The Limits of Nominal Price Analysis in Precious Metals Investing
Nominal price tracking creates a particular blind spot for precious metals investors. Consider that silver reached a nominal all-time high of $121.67 per ounce in January 2026, a figure that generated considerable excitement across financial media. Yet when measured against its 1980 peak of approximately $49.45 per ounce, adjusted for inflation, that January 2026 high translated to roughly $194 to $200 in today's purchasing power terms. In real terms, silver had not yet matched its prior cycle peak despite achieving a new nominal record.
This is where ratio analysis becomes indispensable. The silver-to-Dow ratio strips out the currency distortion embedded in nominal prices and measures silver's value in terms of what it can purchase in the real economy of investable assets. When the ratio is high, silver is cheap relative to equities. When it is low, silver has outperformed and the relative case for holding it weakens. Neither conclusion is visible from a spot price chart alone.
What Is the Silver-to-Dow Ratio and How Is It Calculated?
The mechanics are straightforward. The silver-to-Dow ratio is calculated by dividing the current closing level of the Dow Jones Industrial Average by the silver spot price per troy ounce, expressed in US dollars. The result represents the number of ounces of physical silver required to purchase one unit of the index at any given point in time.
A step-by-step walkthrough of the calculation:
- Record the most recent Dow Jones Industrial Average closing level.
- Record the silver spot price per troy ounce in US dollars at the same point in time.
- Divide the Dow level by the silver price to produce the ratio.
The table below illustrates how this calculation produces meaningfully different readings across different market conditions:
| Date | Dow Level | Silver Price (USD/oz) | Silver-to-Dow Ratio |
|---|---|---|---|
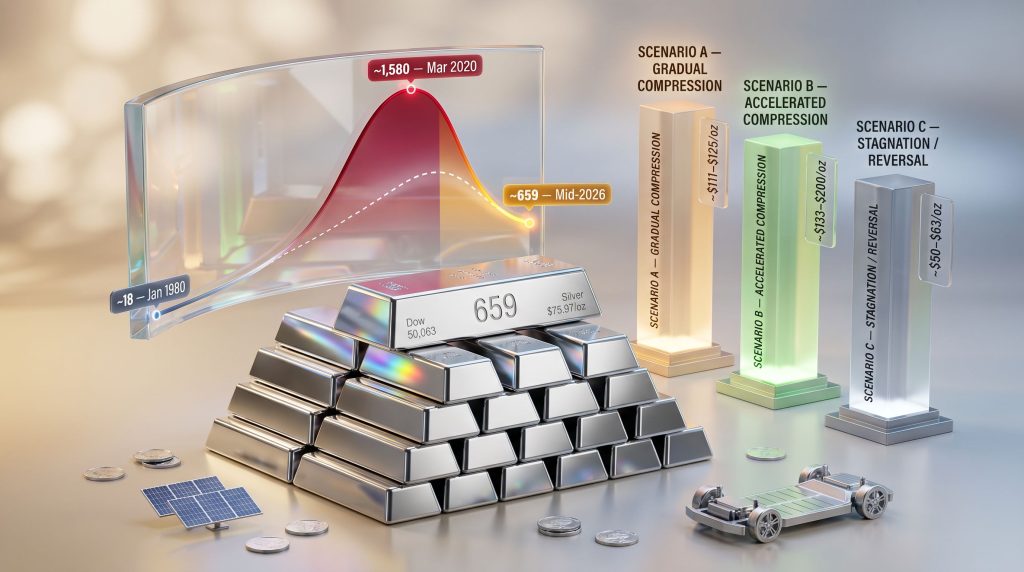
| January 1980 | ~875 | ~$49.00 | ~18 |
| March 2020 | ~19,000 | ~$12.00 | ~1,580 |
| January 2026 | ~42,500 | ~$121.67 (ATH) | ~400-410 |
| Mid-May 2026 | 50,063 | $75.97 | ~659 |
Source: MacroTrends, Trading Economics, GoldSilver
The contrast between the January 1980 reading of approximately 18 and the March 2020 reading of approximately 1,580 illustrates the ratio's extraordinary range. These two extremes represent opposite ends of the cycle between hard asset dominance and paper asset dominance, and both were preceded by conditions that, in hindsight, made the outcome predictable to investors using ratio frameworks.
Important context: The silver-to-Dow ratio is not a mainstream institutional benchmark. It is a comparative valuation tool used primarily within macro-commodity and precious metals analysis frameworks. It functions as a long-cycle positioning indicator, not a short-term trading signal, and should be applied alongside other metrics rather than in isolation.
One structural distinction worth understanding is why silver produces more extreme ratio swings than gold. Gold is primarily a monetary metal, with demand driven overwhelmingly by its store-of-value function, central bank reserve accumulation, and investment demand. Furthermore, silver's dual nature — carrying both a monetary identity and a significant industrial identity — means approximately 60% of annual demand comes from industrial applications including solar photovoltaic manufacturing, electronics, and electric vehicle production. This dual-demand architecture introduces industrial cycle volatility that can push silver to extremes in either direction.
When big ASX news breaks, our subscribers know first
A Century of Evidence: What the Historical Range Actually Tells Investors
Mapping the Full Spectrum From 18 to 1,580
The modern-era range of the silver-to-Dow ratio spans from approximately 18 at its floor to approximately 1,580 at its ceiling, and the conditions that produced each extreme are illuminating in equal measure. Understanding what drove these readings provides the analytical foundation for interpreting where a mid-2026 reading of approximately 659 sits within the broader cycle architecture.
The floor reading of approximately 18 emerged in January 1980 under conditions that represented the culmination of a decade-long shift away from paper asset confidence. The Dow was trading near 875 points while silver was priced near $49 per ounce, the product of an extraordinary run in which silver had appreciated approximately 700% in a single year and gold had gained more than 2,300% across the full decade of the 1970s. The monetary backdrop was defined by the collapse of Bretton Woods in 1971, the subsequent surge in inflation, two oil price shocks, and a Federal Reserve that had repeatedly failed to contain price rises before Paul Volcker's aggressive tightening eventually brought the cycle to its close.
At the ratio's floor, eighteen ounces of silver could purchase the entire Dow, reflecting a generation of equity underperformance against hard assets.
The ceiling reading of approximately 1,580 arrived under entirely different conditions in March 2020. The COVID-19 pandemic triggered a simultaneous collapse in industrial demand expectations and a brief equity market panic, with silver falling to approximately $12 per ounce while the Dow briefly traded near 19,000. The extreme ratio reading reflected silver's industrial demand exposure amplifying its decline at exactly the moment that conventional safe-haven logic might have suggested otherwise. This reading represented one of the most extreme silver undervaluations relative to equities recorded in the modern financial era.
The symmetry between these extremes carries an important message: neither has ever been permanent. Every ceiling has preceded a compression phase, and every floor has preceded an expansion phase.
How Monetary Regimes Drive the Ratio's Long-Term Direction
The single most powerful force governing the silver-to-Dow ratio's long-term direction is the monetary regime in operation at any given time. This relationship has been consistent across a century of data and operates through a well-established mechanism.
When central banks expand their balance sheets aggressively and money supply grows faster than economic output, the real purchasing power of paper-denominated claims erodes over time. Equities, denominated in the same fiat currency being expanded, can maintain nominal prices but struggle to maintain real purchasing power when measured against hard assets. Silver, which carries no counterparty risk and cannot be manufactured through a policy decision, captures monetary debasement directly.
Conversely, when monetary policy tightens aggressively and real interest rates turn meaningfully positive, paper assets benefit and hard assets underperform. The 1982 to 1999 expansion cycle in the ratio illustrates this dynamic precisely: as Volcker's tightening regime transitioned into a prolonged era of declining rates and equity appreciation, the ratio climbed for nearly two decades. Furthermore, a gold-stock market relationship guide reveals how these secular cycles operate across asset classes over multi-decade horizons.
The table below compares the silver-to-Dow ratio with related valuation metrics to provide multi-dimensional context:
| Ratio | What It Measures | Current Reading (Mid-2026) | Historical Cycle Low |
|---|---|---|---|
| Silver-to-Dow Ratio | Ounces of silver per Dow unit | ~659 | ~18 (January 1980) |
| Dow-to-Gold Ratio | Dow units per ounce of gold | ~10 | 1-2 (cycle bottoms) |
| Gold-to-Silver Ratio | Ounces of silver per ounce of gold | Tracked separately | ~16-17 (historical) |
Source: MacroTrends, GoldSilver
The Dow-to-gold ratio sitting near 10 is a particularly important corroborating signal. Historically, full hard-asset cycle completions have been associated with Dow-to-gold readings of 1 to 2, representing the point at which one ounce of gold purchases between one and two units of the Dow. At 10, this ratio remains well above those historical bottoms, suggesting that the broader rotation from paper wealth to hard assets has room to continue across multiple years.
What Structural Forces Actually Compress the Silver-to-Dow Ratio?
Force 1: Monetary Debasement and the Erosion of Fiat Purchasing Power
The foundational driver of ratio compression across every historical cycle has been the gap between money supply growth and productive economic output. When the currency unit in which both the Dow and silver are priced is being systematically devalued, hard assets with finite supply and no counterparty risk absorb that debasement into their relative price appreciation.
The current monetary environment provides several relevant data points. April 2026 CPI registered at 3.8%, above the consensus forecast of 3.7%, representing a continuation of above-target inflation that has persisted well beyond the Federal Reserve's initial projections. The federal funds rate currently sits in the 3.50 to 3.75% range, meaning that the spread between the nominal policy rate and reported inflation is narrow and, depending on the inflation measurement used, potentially negative in real terms.
This configuration, where real rates hover near zero or below, has historically been associated with hard asset outperformance as the opportunity cost of holding physical silver diminishes. Silver functions as a monetary asset in this context because it holds value independently of any government's fiscal position or central bank's credibility, having been used as money across cultures and millennia precisely because it cannot be created through policy action.
Force 2: Equity Overvaluation Relative to Hard Asset Benchmarks
The second compression driver operates from the equity side of the ratio. The Dow Jones Industrial Average crossed 50,000 for the first time in February 2026, and its ascent from 40,000 to 50,000 was completed in approximately 21 months, making it the fastest 10,000-point gain in the index's history. This pace of equity appreciation, measured against subdued silver prices, contributed to the elevated ratio reading that persisted through early 2026.
Mean reversion logic dictates that when any asset class outperforms another dramatically over an extended period, the conditions for relative underperformance accumulate. The ratio's decline from approximately 1,580 in March 2020 to approximately 659 in mid-May 2026 reflects this dynamic in partial operation, though the distance between 659 and the historical cycle low of 18 remains substantial. For additional context, a gold-silver ratio analysis for 2025 provides further insights into how these cross-asset relationships evolve.
Force 3: Industrial Demand Structurally Underpinning Silver's Floor
Unlike gold, which can theoretically fall to levels purely determined by monetary sentiment, silver's pricing is structurally supported by industrial demand that operates independently of financial market conditions. This creates a valuation floor that gold does not possess.
The industrial demand picture for silver has strengthened materially across the past decade. Solar photovoltaic manufacturing alone accounted for 29% of total silver industrial demand in 2024, according to the Silver Institute's The Next Generation Metal report published in December 2025. This single application sector has become a dominant demand driver, and its trajectory is governed by global renewable energy investment rather than financial market sentiment.
Additional structural demand pillars include:
- Electric vehicle production, where silver is used extensively in electrical contacts, printed circuit boards, and battery management systems.
- Semiconductor fabrication, where silver's unmatched electrical conductivity makes it irreplaceable in advanced chip manufacturing processes.
- 5G infrastructure deployment, which requires silver-based components at multiple points across the technology stack.
Investor perspective: Industrial demand drivers, including solar, EVs, and semiconductors, operate on multi-year capital deployment cycles that are structurally independent of geopolitical events and short-term trade negotiations. They represent a long-duration demand foundation that supports silver's valuation regardless of diplomatic outcomes in any single week or quarter.
In addition, silver supply deficits continue to exert upward pressure on prices as demand persistently outpaces mine production, further reinforcing silver's structural valuation floor.
Force 4: Statistical Mean Reversion Across Full Market Cycles
The fourth compression driver is perhaps the most mathematically reliable: no extreme ratio reading in the historical record has been sustained indefinitely. The ratio's compression from approximately 1,580 in March 2020 to approximately 659 in mid-May 2026 represents a 58% decline over a six-year period, yet this still leaves the ratio approximately 36 times higher than the 1980 cycle low of 18. The distance between the current reading and the historical floor is not a trivial amount of remaining potential, and mean reversion forces that have operated across a century of data continue to exert directional pressure.
Scenario Modelling: Three Possible Ratio Trajectories from Current Levels
How to Use Scenario Frameworks for Long-Cycle Positioning
Scenario modelling is a more intellectually honest approach to long-cycle ratio analysis than point forecasting, because it acknowledges that the future is governed by multiple possible monetary and macroeconomic pathways rather than a single predetermined outcome. Three variables primarily govern which trajectory the silver-to-Dow ratio follows from current levels: the persistence of inflation, the trajectory of monetary policy, and the resilience of equity market valuations.
Scenario A: Gradual Compression
Conditions required: Inflation remains above the Federal Reserve's 2% target but does not re-accelerate materially. Real rates stay near zero or marginally positive. Equity markets consolidate rather than declining sharply.
Under this base-case scenario, the ratio continues its current compression trajectory at a measured pace, moving from approximately 659 toward a 400 to 450 range over a 12 to 24 month horizon. At a Dow level of 50,000, this scenario implies a silver price in the range of approximately $111 to $125 per ounce. The historical analogue for this pathway is the 2002 to 2008 compression cycle, during which silver steadily outperformed equities as real rates remained low and inflation gradually accumulated.
Scenario B: Accelerated Compression
Conditions required: Inflation re-accelerates above 4%, the Federal Reserve pivots to rate cuts in response to economic weakness, and equity markets experience a correction of 20% to 30% from current levels.
This bull-case scenario projects a ratio trajectory from approximately 659 to a 200 to 300 range over a 24 to 36 month period. At a Dow level of 40,000 following a correction, this scenario implies silver prices in the range of approximately $133 to $200 per ounce. The historical analogue is the 1977 to 1980 compression cycle, one of the most dramatic hard-asset rotations in modern financial history. Notably, silver's inflation-adjusted 1980 peak of approximately $49.45 equates to roughly $194 to $200 in 2026 dollars, meaning that achieving real parity with the prior cycle high would itself fall within this scenario's implied price range.
Scenario C: Ratio Stagnation or Reversal
Conditions required: Inflation falls sharply back toward the 2% target, the Federal Reserve maintains or increases its policy rate, and the equity bull market extends substantially beyond current levels.
This bear-case scenario projects a ratio expansion from 659 toward an 800 to 1,000-plus range, implying silver prices of approximately $50 to $63 per ounce at a Dow level of 50,000. The historical analogue is the 1982 to 1999 expansion cycle, during which disinflation, positive real rates, and an extraordinary equity bull market pushed the ratio steadily higher for nearly two decades.
Summary Scenario Table
| Scenario | Macro Conditions | Ratio Target | Implied Silver Price (Dow ~50,000) | Timeframe |
|---|---|---|---|---|
| A: Gradual Compression | Sticky inflation, flat rates | 400-450 | ~$111-$125/oz | 12-24 months |
| B: Accelerated Compression | Re-accelerating inflation, rate cuts | 200-300 | ~$133-$200/oz | 24-36 months |
| C: Stagnation or Reversal | Disinflation, sustained rate policy | 800-1,000+ | ~$50-$63/oz | Ongoing |
Scenario projections are illustrative frameworks based on historical analogues and should not be interpreted as price forecasts. All investments carry risk. Past performance is not indicative of future results.
How Should Investors Practically Apply the Silver-to-Dow Ratio?
Establishing Decision Thresholds Rather Than Entry Points
The most common misapplication of ratio-based analysis is treating it as a timing mechanism. The silver-to-Dow ratio does not indicate when silver will outperform equities. It indicates the probable direction of relative value over a multi-year horizon based on where the ratio sits within its historical distribution. This is a meaningful but distinct form of investment intelligence.
Three historically significant threshold zones help translate ratio readings into positioning logic:
| Ratio Zone | Historical Interpretation | Strategic Implication |
|---|---|---|
| Above 1,000 | Extreme silver undervaluation vs. equities | Long-cycle accumulation zone |
| 300-1,000 | Transitional compression phase | Active monitoring; staged accumulation |
| Below 50 | Maturing outperformance cycle | Consider rotation back toward equities |
The current reading of approximately 659 places the ratio within the transitional compression phase. Compression from the 2020 extreme is confirmed and underway, but the historical evidence suggests that a reading of 659 remains substantially elevated relative to the 18 to 50 range that has characterised the most advanced stages of prior hard-asset cycles. Furthermore, understanding silver market dynamics in 2025 adds important context around how positioning and liquidity factors can amplify ratio movements during transitional phases.
What the Ratio Cannot Tell You
Intellectual honesty requires acknowledging the ratio's limitations as clearly as its strengths:
- The ratio ignores dividends entirely. The Dow's constituent companies distribute cash to shareholders over time, a return that physical silver does not generate. Over long periods, this dividend compounding creates a meaningful advantage for equity holders that the ratio does not capture.
- The Dow represents just thirty large-cap companies, a narrow slice of total equity market wealth. Using it as a proxy for all paper asset valuations introduces representational limitations that broader equity indices would partially address.
- The ratio provides no timing signal within a cycle. A reading of 659 confirms that the cycle is at a particular stage; it does not indicate whether the next move occurs in three weeks or three years.
- Geopolitical events, such as trade policy uncertainty, diplomatic developments, and supply chain disruptions, affect industrial silver pricing without altering the monetary thesis embedded in the ratio's long-cycle message. For historical context, Dow vs silver ratio charts spanning a century of data illustrate how these short-term disruptions have consistently failed to derail longer-term compression cycles.
Critical distinction: The silver-to-Dow ratio answers the long-horizon question of where we are in the cycle. It does not answer what silver will do this week. Investors who conflate these two different questions will systematically misapply the framework and draw incorrect conclusions from short-term price movements.
Integrating the Ratio Into a Broader Portfolio Framework
The silver-to-Dow ratio achieves its greatest analytical value when used alongside complementary metrics rather than in isolation. The Dow-to-gold ratio provides corroborating evidence of the broader paper-to-hard-asset rotation, with its current reading near 10 remaining well above the 1 to 2 range that has historically characterised full cycle completions. The gold-to-silver ratio provides additional granularity on relative metal positioning within a precious metals allocation.
Portfolio construction considerations in the current ratio environment include the distinction between physical silver, silver ETFs, and silver mining equities. Physical silver provides direct exposure to the monetary thesis without counterparty risk. ETFs provide liquidity and ease of access but introduce custody and counterparty elements. Mining equities offer operational leverage to silver prices but also introduce company-specific geological, operational, and financing risks that are distinct from the metal itself.
Why Short-Term Price Volatility Does Not Invalidate the Long-Cycle Thesis
Anatomy of a Silver Price Correction: Industrial Versus Monetary Drivers
Understanding why silver fell approximately 10% on May 15, 2026, following the conclusion of the Trump-Xi summit in Beijing without a meaningful trade deal requires distinguishing between the two distinct demand engines that drive silver's price. The summit had generated anticipatory positioning in silver prices across the preceding days, as market participants priced in the possibility of a trade agreement that would support US-China industrial supply chains. When that agreement failed to materialise, the industrial demand premium evaporated rapidly.
This mechanism explains a dynamic that repeatedly confuses investors who treat silver as a purely monetary metal. Because approximately 60% of annual silver demand is industrial, and because significant portions of that industrial demand flow through US-China supply chains in solar manufacturing, electronics, and EVs, diplomatic and trade developments can trigger sharp silver price movements that have nothing to do with the monetary thesis embedded in the ratio framework. The May 2026 sell-off was precisely this type of event: an industrial demand repricing that left the monetary case structurally intact.
Historical Precedent: What Follows Major Silver Corrections
The historical pattern of silver corrections within compression cycles is instructive. According to analysis from GoldSilver's Silver Price Crash History research, the largest drawdowns in silver prices during periods of long-cycle ratio compression have consistently been followed by recoveries that exceeded the pre-correction high. This pattern reflects the underlying dynamic of compression cycles: the structural forces driving ratio compression do not reverse because of a single diplomatic event or industrial demand shock.
Silver's price history demonstrates that distinguishing between an industrial demand correction and a monetary thesis breakdown is the critical analytical skill for long-cycle precious metals investors. An industrial correction leaves the monetary drivers intact. A monetary thesis breakdown, by contrast, would require either persistent positive real rates, a sustained return of fiat currency credibility, or a dramatic structural decline in money supply growth — conditions that a failed trade summit does not produce.
The next major ASX story will hit our subscribers first
Frequently Asked Questions: Silver-to-Dow Ratio
What exactly does the silver-to-Dow ratio measure?
The silver-to-Dow ratio quantifies how many ounces of physical silver are needed to purchase one unit of the Dow Jones Industrial Average at any given point in time. It is derived by dividing the Dow's current level by the silver spot price per ounce. Rather than tracking absolute prices, it measures the relative purchasing power of silver against US equities, making it a long-cycle valuation instrument rather than a short-term trading indicator.
What was the silver-to-Dow ratio at its historical low?
The ratio reached its modern-era low of approximately 18 in January 1980, when the Dow was trading near 875 and silver was priced near $49 per ounce. This reading coincided with the peak of a decade-long precious metals bull market, during which silver appreciated approximately 700% in a single year and gold gained more than 2,300% across the full decade.
What was the silver-to-Dow ratio at its historical high?
The ratio reached approximately 1,580 in March 2020, during the COVID-19 market dislocation. Silver fell to around $12 per ounce while the Dow briefly traded near 19,000, creating one of the most extreme silver undervaluations relative to equities in modern financial history.
What is the silver-to-Dow ratio in 2026?
As of mid-May 2026, the silver-to-Dow ratio stands at approximately 659, calculated using a Dow level of 50,063 and a silver price of $75.97 per ounce. This reading sits well below the 2020 peak of approximately 1,580 and well above the 1980 cycle low of approximately 18, indicating that the compression cycle is underway but historically far from complete.
Is the silver-to-Dow ratio a reliable investment signal?
The ratio is a long-cycle positioning tool with a well-documented historical track record of identifying extreme valuations. However, it carries significant limitations: it ignores equity dividends, uses a narrow 30-stock proxy for equities, and provides no timing signal within a cycle. It is best used as one input within a broader multi-ratio analytical framework rather than as a standalone buy or sell trigger.
Why does silver produce more extreme ratio swings than gold?
Silver's price is driven by two distinct demand engines: monetary demand, functioning as a store of value and inflation hedge, and industrial demand from sectors including solar panels, electronics, and EVs. This dual structure makes silver more volatile than gold, which is primarily a monetary metal. Industrial demand shocks can compress silver's price independently of monetary conditions, creating more extreme ratio readings at both ends of the cycle.
What ratio level historically signals that silver is extremely undervalued?
Readings above 1,000 have historically corresponded to periods of extreme silver undervaluation relative to equities, representing the most compelling long-cycle accumulation conditions. Readings below 50 have historically signalled a maturing outperformance cycle, suggesting that the rotation from hard assets back into equities may be approaching.
Key Takeaways: Interpreting the Silver-to-Dow Ratio in the Current Monetary Environment
The silver-to-Dow ratio provides a framework that resolves one of the most persistent problems in precious metals investing: knowing the price but not the value. The key conclusions from the full analytical framework presented here are as follows:
- The silver-to-Dow ratio is a long-cycle cross-asset valuation tool, not a short-term price predictor. Its analytical value operates across years and decades, not days and weeks.
- Its modern-era range spans approximately 18 at the 1980 cycle low to approximately 1,580 at the March 2020 COVID peak, with each extreme reflecting the full exhaustion of the prevailing monetary regime.
- The mid-2026 reading of approximately 659 confirms that compression from the 2020 extreme is underway, but remains historically distant from the floor readings associated with prior hard-asset cycle completions.
- Four structural forces drive ratio compression: monetary debasement and erosion of fiat purchasing power, equity overvaluation relative to silver's historical relationship with stocks, industrial demand growth across solar, EVs, and semiconductors, and the mathematical force of mean reversion across full market cycles.
- Silver's inflation-adjusted 1980 peak equates to approximately $194 to $200 in 2026 dollars, meaning that despite achieving a nominal all-time high of $121.67 in January 2026, silver has not yet matched its prior cycle high in real purchasing power terms.
- Short-term corrections driven by industrial demand disruptions, such as trade policy uncertainty or diplomatic outcomes, do not alter the monetary thesis embedded in the ratio's long-cycle framework.
- The ratio delivers its greatest analytical value when applied alongside complementary metrics, including the Dow-to-gold ratio currently near 10 and the gold-to-silver ratio, providing multi-signal confirmation of the broader hard-asset cycle position.
Disclaimer: This article is for informational and educational purposes only. It does not constitute financial or investment advice. Scenario projections and ratio analysis are illustrative frameworks based on historical data and do not guarantee future outcomes. All investments, including precious metals, carry risk and may result in partial or total loss. Readers should consult a qualified financial adviser before making any investment decisions. Past performance is not indicative of future results.
Want to Identify ASX Mineral Discoveries Before the Broader Market Does?
While cross-asset ratio frameworks help position precious metals investments within long-cycle valuations, Discovery Alert's proprietary Discovery IQ model delivers real-time alerts on significant ASX mineral discoveries — instantly translating complex data across 30-plus commodities into actionable insights for both traders and long-term investors. Explore Discovery Alert's dedicated discoveries page to understand how historic mineral discoveries have generated substantial market returns, and begin your 14-day free trial to gain a market-leading edge.