May 16, 2026
The Hidden Mechanics Behind Commodity Price Cycles
Most investors assume that when the price of a raw material rises sharply, the explanation must lie in a shortage of physical supply. Factories cannot get what they need, miners cannot dig it out fast enough, and prices climb until the imbalance resolves. This mental model works reasonably well for oil, agricultural commodities, and certain base metals. For platinum, however, it regularly leads investors to misread market conditions entirely, sometimes with costly consequences.
Understanding why platinum prices rise requires a fundamentally different analytical framework, one that separates fabrication demand from investment demand, distinguishes structural scarcity from portfolio positioning, and recognises that the marginal price setter in a platinum surplus can still be a financial institution reallocating capital rather than an automaker scrambling for autocatalyst material.
When big ASX news breaks, our subscribers know first
What Is Actually Driving Platinum Prices Higher in 2025?
The Investor Demand Thesis: More Than Just a Speculative Spike
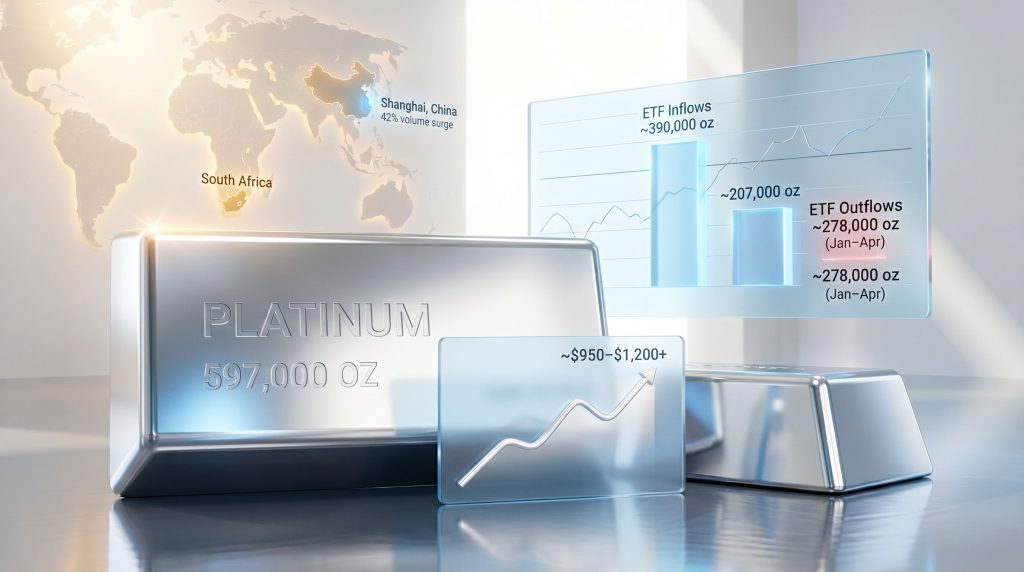
The platinum price rise driven by investor demand over the past two years is a textbook illustration of investor-led price formation. According to CPM Group's supply-demand data, platinum ETFs absorbed approximately 390,000 ounces in net additions during 2024, followed by a further 207,000 ounces in 2025, bringing cumulative net ETF inflows across the two-year period to roughly 597,000 ounces. That single data point explains the price rally far more precisely than any fabrication deficit narrative.
The platinum price rose from approximately $800 per ounce during its consolidation phase to levels approaching $3,000 as this wave of investor buying hit the market. This was not caused by industrial users bidding against each other for scarce metal. It was caused by portfolio allocation decisions, driven in part by bullish marketing reports released around platinum week in London during late May 2024, which characterised supply and demand conditions in ways that CPM Group's independent analysis directly contradicts.
How Platinum Fits Into the Broader Precious Metals Rotation
The broader precious metals market experienced significant investor interest throughout 2024 and into 2025. Gold advanced from around $2,660 at the start of the period to record levels above $3,200 by April, supported by Federal Reserve policy uncertainty, geopolitical stress, and a broad rotation into hard assets. Silver followed a similar trajectory.
Platinum, which had been trading at a historically wide discount to gold and had underperformed for years, attracted contrarian investors who identified the valuation gap as an opportunity. This catch-up trade added momentum to the investor-driven rally already underway.
| Metric | Gold | Platinum |
|---|---|---|
| Primary Price Driver | Macro/Monetary | Industrial + Investment |
| 2024-2025 Price Trajectory | Strong upward | Lagged, then accelerating |
| Investor Sensitivity | High (macro-led) | Moderate (fabrication-anchored) |
| Safe-Haven Perception | Established | Emerging/Catch-up |
| Supply Flexibility | High (above-ground stocks) | Geographically concentrated |
Why Platinum Was Structurally Undervalued Before the Rally Began
Following the institutional selling that CPM Group facilitated in 2011 and 2012, and the price collapse that followed the 2014 South African mining strike settlement, platinum entered an extended sideways consolidation that persisted for most of the decade. The metal traded in a range that reflected surplus supply conditions rather than strategic value. CPM Group issued a buy recommendation around 2020, recognising that the accumulation phase was beginning again, a call that preceded the multi-year recovery that ultimately accelerated in mid-2024.
How Does Platinum's Supply-Demand Balance Really Work?
Understanding the Difference Between Fabrication Demand and Investment Demand
One of the most consequential analytical distinctions in commodity markets is the difference between how a fabricator and an investor interact with physical metal. A fabricator, whether an automotive parts manufacturer, a chemical catalyst producer, or a jewellery maker, purchases platinum and locks it into a product. That metal does not re-enter the market for years, sometimes 8 to 10 years on average in the case of autocatalysts before recycling occurs, and even then with efficiency losses.
An investor holding platinum in sponge or bar form can liquidate their position at any moment. The metal sits in a vault in liquid commercial form, ready to be returned to the market the instant the price outlook changes. This structural difference is what makes investor positioning the true marginal force in platinum price formation, even in a market that is running a fabrication surplus.
Key Insight: In commodity markets, fabricators consume metal and lock it into products for years. Investors, by contrast, hold metal in liquid form and can re-enter or exit the market rapidly, making them the true price-setting force at the margin, even in a surplus environment.
Why Surplus Markets Can Still Experience Sharp Price Increases
CPM Group's supply-demand data shows that platinum has operated in surplus conditions for the vast majority of years since data collection began in 1976, with the notable exception of the 2014 South African strike period, which produced a deficit of approximately one million ounces. Despite persistent surpluses, platinum has experienced multiple sharp price rallies, all of which were investor-driven.
The mechanism is straightforward. When investors collectively decide to accumulate 597,000 ounces of a metal whose annual surplus might be 200,000 to 800,000 ounces, they effectively absorb the entire excess supply and more. The spot market responds to this marginal demand with price increases that can be dramatic and rapid.
The Role of Newly Refined Supply vs. Recycled Metal in Platinum's Balance Sheet
| Supply-Demand Factor | 2023 | 2024 | 2025 (Est.) |
|---|---|---|---|
| Newly Refined Supply | Surplus | Surplus | Larger Surplus |
| ETF Net Additions (oz) | N/A | ~390,000 | ~207,000 |
| ETF Net Redemptions (oz) | N/A | N/A | ~278,000 (Jan-Apr) |
| Price Range (approx.) | ~$900-$1,000 | ~$900-$1,100 | ~$950-$1,200+ |
Note: Supply-demand framework sourced from CPM Group methodology. ETF flow data referenced from industry tracking sources. Price ranges are approximate and for illustrative purposes only.
A critical and often overlooked detail in the platinum supply picture is the form in which metal trades commercially. Industrial fabricators, particularly those producing autocatalysts, primarily use platinum in powder or sponge form rather than cast bars. When investors are advised to hold platinum in sponge form stored in Zurich rather than conventional bars, it is precisely because sponge commands a premium from fabricators when positions are ultimately liquidated. This is a nuance that separates informed institutional positioning from retail-style bar accumulation.
What Role Have ETFs and Physical Investment Played in Platinum's Price Rally?
ETF Inflows as a Leading Indicator: Nearly 600,000 Ounces Absorbed Over Two Years
Since platinum ETFs were introduced in 2007, flow data has provided one of the clearest real-time signals of investor appetite. The cumulative net buying of approximately 597,000 ounces between 2024 and early 2025 represents a substantial market intervention, particularly against the backdrop of a metal that was already in structural surplus from newly refined production.
The timing of this accumulation phase is also notable. CPM Group's analysis links the beginning of the price rally to the publication of bullish marketing documents around platinum week in late May and early June 2024. This sequence — marketing narrative followed by investor response followed by price escalation — illustrates how information framing can trigger real capital flows regardless of whether the underlying supply-demand picture supports it.
Bars, Coins, and Institutional Accumulation: The Physical Demand Layer
Beyond ETF vehicles, physical platinum demand from institutional investors during the 2001 to 2007 bull market demonstrated how concentrated buying in sponge form stored in Zurich could sustain multi-year price appreciation. During that cycle, millions of ounces were accumulated specifically in powder and sponge format, a form preferred by fabricators, giving institutional holders a commercial advantage when liquidating into rising demand.
This historical episode is directly relevant today because it illustrates that platinum price cycles are not random. They follow identifiable patterns of investor accumulation, fabrication-anchored baseline demand, and eventual liquidation as prices approach levels that trigger profit-taking.
Why Recent ETF Outflows of ~278,000 Ounces in Early 2025 Are a Cautionary Signal
Between January and April 2025, platinum ETF holders liquidated approximately 278,000 ounces, which represents more than the entire net addition recorded in 2025 prior to that point. This reversal, occurring while the projected fabrication surplus is simultaneously widening, creates a compounding risk scenario.
Warning: When investors who drove a price rally begin liquidating positions at scale, the same mechanism that pushed prices up can accelerate a reversal. Monitoring ETF flow data is essential for platinum price forecasting.
Is Platinum in a Real Deficit, or Is the Narrative Misleading Investors?
How Marketing Reports Can Distort Commodity Supply-Demand Analysis
Each year around platinum week in London, reports produced by organisations whose mandate includes promoting platinum investment present supply-demand analyses that tend toward bullish conclusions. A common methodological choice in these reports is to aggregate fabrication demand and investment demand into a single demand figure, then compare it against newly refined supply.
When investment buying is running hot, this approach can generate an apparent deficit even in a market where fabricators are fully supplied and face no material scarcity. The result is a narrative that conflates structural industrial tightness with investor positioning, a conflation that can mislead market participants about the durability and nature of any price move.
The Critical Distinction: Fabrication Deficit vs. Total Demand Deficit
A genuine fabrication deficit occurs when industrial users cannot source sufficient metal to meet their production requirements, forcing them to outbid each other for available supply. This is a self-correcting, price-supportive condition that reflects real structural scarcity.
An investment-demand-driven price rise reflects portfolio allocation decisions that are inherently more reversible. The same investor who paid $2,500 per ounce in a rising market will sell at $3,000 if the price hits their target or if their macro view changes. No autocatalyst manufacturer makes decisions with the same speed or motivated by the same factors.
Analytical Framework: A genuine fabrication deficit occurs when industrial users cannot source enough metal to meet production needs, driving them to bid prices higher. An investment-driven price rise is fundamentally different: it reflects portfolio allocation decisions that can reverse quickly, not structural industrial scarcity.
Historical Precedent: The 2014 South African Mining Strike
The 2014 strike at South African platinum mines is one of the most instructive episodes in modern platinum market history. Supply was genuinely disrupted, with several million ounces of platinum effectively removed from production for the better part of a year, producing a deficit of approximately one million ounces against fabrication demand.
Yet the platinum price did not rise materially during the strike. It flatlined. The reason was investor behaviour. The head of Rustenberg publicly stated on multiple occasions during the first half of 2014 that adequate supplies existed to meet all client needs and that investors should not react by buying metal. Institutional investors who had accumulated sponge holdings in Zurich during the prior bull cycle concluded that once the strike was resolved, oversupply would return and prices would fall. They accelerated their selling, and the strike-era production gap was effectively filled by investor liquidation. When the strike settled, the platinum price fell exactly as the logic predicted.
This episode revealed something profound about how platinum markets work: fabrication deficits without investor buying do not necessarily produce price appreciation, and investor selling can neutralise even genuine supply shocks.
How Do Macroeconomic Conditions Shape Investor Appetite for Platinum?
Inflation, Interest Rate Uncertainty, and the Hard Asset Rotation
The Federal Reserve's communication through 2024 and into 2025 has been a significant driver of precious metals sentiment. Signals from the Jackson Hole conference in August 2025 indicating a potential acceleration of rate cuts triggered sharp upward moves across gold, silver, and other hard assets. When the Fed subsequently shifted to a more hawkish tone in March 2025, citing persistent inflation and a stronger-than-expected economy, commodity prices including gold in volatile markets corrected meaningfully.
Platinum, sitting at the intersection of industrial metal and investment asset, responded to this macro environment with less direct sensitivity than gold but still benefited from the broader hard asset allocation trend. Investors who had already positioned in gold began looking at platinum's relative discount as an additional opportunity.
Federal Reserve Policy Signals and Precious Metals Markets in 2025
Gold's journey from $2,660 to above $5,400 and back below $5,000 during early 2025 illustrated the acute sensitivity of precious metals to Fed communication. The open market committee's indication that it would not lower rates and might actually need to raise them given ongoing inflation sent gold down toward $4,100 before a recovery.
Platinum's price behaviour through this period was shaped by two overlapping forces: the macro-driven precious metals rotation and the sector-specific investor demand dynamics described above. Furthermore, examining precious metals relative value helps contextualise why platinum attracted contrarian buyers during this cycle. This dual sensitivity makes platinum price forecasting particularly complex.
The next major ASX story will hit our subscribers first
What Industrial Demand Factors Are Supporting Platinum Prices Alongside Investor Activity?
Autocatalyst Demand and PGM Consumption in the Hybrid Era
Both the United States and China, the world's two largest automobile markets, recorded relatively solid auto production and sales in the early months of 2025, particularly for internal combustion engine vehicles and hybrids. Both vehicle types consume platinum group metals in their exhaust treatment systems, providing a baseline of fabrication demand that underpins the market even as investor flows dominate price formation.
The persistence of ICE and hybrid vehicle production at current levels is relevant because the transition to battery electric vehicles, which do not use PGMs in their powertrains, has been slower than many forecasts suggested even three years ago. This extends the window of autocatalyst-driven platinum demand. In addition, understanding platinum and palladium dynamics provides further context for how PGM markets interact under these conditions.
Hydrogen Economy Applications: A Long-Term Structural Layer
Platinum is a critical catalyst in proton exchange membrane fuel cells, the technology underlying both hydrogen fuel cell vehicles and stationary power generation systems. While this demand layer remains relatively small compared to autocatalyst volumes in 2025, it represents a structural growth story that provides a long-term demand thesis for platinum independent of both investor positioning and conventional ICE applications.
The hydrogen economy's development trajectory is uncertain in terms of timing, but the directional demand implication for platinum is broadly positive over a multi-decade horizon. Consequently, a commodities diversification strategy that incorporates platinum may capture both near-term investor-driven momentum and longer-term industrial growth.
How Does the Shanghai Futures Exchange Factor Into Platinum's Price Discovery?
The 42% Volume Surge in Shanghai Platinum Futures
One of the most significant and least discussed developments in platinum market structure over the past year has been the 42% increase in trading volume on the Shanghai Futures Exchange for platinum futures contracts. This growth reflects expanding participation from Asian investors in platinum price discovery, a structural shift that adds a new and potentially more volatile demand layer to the market.
Asian investor behaviour in commodity futures markets tends to be responsive to domestic economic conditions, currency dynamics, and local investment alternatives in ways that may not correlate perfectly with Western precious metals sentiment cycles. According to recent analysis of platinum's safe-haven potential, this geographic broadening of investor participation is increasingly recognised as a key structural development.
Futures Volume vs. Physical ETF Flows: Reading the Full Investor Demand Picture
Tracking platinum market dynamics effectively requires reading both the physical ETF flow data and futures market volume data simultaneously. ETF flows indicate longer-duration investment positioning, while futures volume growth reflects shorter-term speculative and hedging activity. The combination of strong ETF inflows across 2024 and significant Shanghai futures volume growth during the same period created a reinforcing demand signal that drove prices sharply higher.
The divergence now emerging, where ETF flows have turned negative while futures volume remains elevated, is itself an important signal about the evolving risk profile of current platinum price levels.
What Is the Historical Track Record of Platinum Price Cycles?
Timeline of Key Platinum Price Inflection Points:
-
Late 1990s: Decade-long price stagnation; early signs of investment demand building as supply-demand balance tightened
-
1999-2001: Three sequential buy signals issued as institutional interest began to emerge; price rose, corrected, and recovered
-
2001-2007: Sustained bull market driven by institutional accumulation of physical platinum sponge stored in Zurich, with millions of ounces accumulated by high-net-worth and institutional investors
-
2008: Final price spike triggered by South African power outages disrupting mine production; subsequent volatility
-
2011-2012: Market reassessment; institutional selling facilitated as post-GFC economic outlook weakened
-
2014: Strike-era supply disruption; investor selling offset the fabrication shortfall; price flatlined then fell when strike settled
-
2014-2020: Extended sideways consolidation; structural surplus persisted; platinum traded in a depressed range
-
2020: New buy recommendation issued; recovery phase commenced
-
2024-2025: Investor-led rally accelerated; ETF inflows reached approximately 597,000 oz over two years; early 2025 ETF outflows signal potential reversal risk
How Should Investors Interpret the Current Platinum Rally?
Three Scenarios for Platinum Prices From Mid-2025 Onward
Scenario 1: Continued Investor Accumulation
If macro uncertainty deepens, the precious metals rotation broadens further, and Asian investor participation through Shanghai futures continues to expand, ETF inflows could resume and provide price support above current levels. This scenario depends on investment sentiment remaining constructive and the macro environment continuing to favour hard assets.
Scenario 2: Consolidation and Profit-Taking
The early 2025 ETF outflows of approximately 278,000 ounces suggest that a segment of investors who accumulated during the rally are already trimming positions. A sideways consolidation phase is plausible, with price supported by fabrication demand and residual investor interest but capped by ongoing profit-taking from earlier buyers.
Scenario 3: Sharp Correction
If the projected widening of the fabrication surplus materialises as expected and investor sentiment reverses more broadly, platinum prices could retrace significantly. The combination of more newly refined supply entering the market and net investor selling creates a compounding downside scenario. Historical cycles, particularly the 2014 to 2020 consolidation, demonstrate that platinum corrections can be prolonged.
Key Takeaway: Platinum's price is not being driven by industrial scarcity. It is being driven by investor positioning. That makes the rally more reversible than structural deficit narratives suggest, but also potentially more explosive if macro conditions intensify safe-haven demand.
Important disclaimer: This article is for informational purposes only and does not constitute financial advice. Commodity markets are inherently volatile, and past price cycles are not indicative of future performance. Investors should conduct independent research and consult qualified financial advisers before making investment decisions.
Frequently Asked Questions About Platinum's Price Rise
Is platinum in a supply deficit right now?
Based on CPM Group's methodology, which measures total newly refined supply against fabrication demand, platinum has been running a surplus, not a deficit. The apparent deficits reported in some industry publications arise from adding investment demand to fabrication demand, which conflates two structurally different types of market activity.
What percentage of platinum demand comes from investors vs. industrial users?
Industrial fabrication, primarily autocatalysts, accounts for the majority of platinum consumption by volume. However, investors are the marginal price-setting participants because they can accumulate or liquidate holdings rapidly. Even a relatively modest shift in investor positioning, such as the 597,000-ounce net ETF buying over two years, can override the price-dampening effect of a fabrication surplus.
How do platinum ETFs work and why do they influence spot prices?
Platinum ETFs hold physical metal to back their shares. When investors buy ETF units, the fund must acquire physical platinum, directly reducing available above-ground supply in the spot market. When investors sell, that metal is returned to the market. This direct link between financial instrument flows and physical supply means ETF flow data is one of the most reliable indicators of platinum price direction.
Is platinum a better investment than gold in the current macro environment?
Platinum and gold serve different roles in a portfolio. Gold responds primarily to macro and monetary conditions. Platinum combines industrial demand anchoring with investment overlay sensitivity. Platinum's historically wide discount to gold attracted contrarian investors through 2024 and 2025, but the investment case carries higher reversibility risk given the current surplus and emerging ETF outflows.
What would cause platinum prices to fall from current levels?
The primary risk factors are: continued ETF liquidation by investors taking profits; a widening of the fabrication surplus as projected; softening in auto production in the US and China; and a broader precious metals risk-off environment driven by Federal Reserve hawkishness or improving macroeconomic stability.
How does the hydrogen economy affect long-term platinum demand?
Platinum's role as a catalyst in hydrogen fuel cells provides a long-term structural demand growth story that is independent of both ICE vehicle cycles and short-term investor positioning. The timeline for hydrogen economy scaling remains uncertain, but the directional implication for platinum demand over a multi-decade horizon is broadly constructive.
Key Takeaways: What the Platinum Rally Tells Us About Commodity Price Mechanics
-
The platinum price rise driven by investor demand since mid-2024 has been the primary engine of price appreciation, not fabrication shortfalls
-
ETF inflows of approximately 597,000 ounces over two years absorbed surplus supply and drove prices sharply higher
-
Early 2025 ETF outflows exceeding 278,000 ounces represent a meaningful reversal signal that warrants close monitoring
-
Shanghai futures volume growth of 42% reflects the expanding role of Asian investor participation in platinum price formation
-
Industrial demand from autocatalysts and emerging hydrogen applications provides a secondary support layer but is not the marginal price driver
-
Marketing narratives around platinum deficits often conflate fabrication demand with investment demand, a distinction critical to accurate price analysis
-
Historical platinum cycles confirm that investor-driven rallies can be sharp and sustained, but are also vulnerable to rapid reversal when positioning unwinds
-
The form in which platinum is held matters commercially: sponge and powder formats command premiums from fabricators over cast bars, a structural advantage for sophisticated institutional investors
Readers seeking a deeper understanding of platinum group metals market dynamics and independent supply-demand methodology may find value in exploring the publicly available research and video content produced by CPM Group at cpmgroup.com.
Want to Stay Ahead of the Next Major Mineral Discovery on the ASX?
Discovery Alert's proprietary Discovery IQ model delivers real-time alerts on significant ASX mineral discoveries, turning complex commodity data into actionable investment insights for both short-term traders and long-term investors — begin your 14-day free trial today and explore how historic mineral discoveries have generated substantial returns to understand what early positioning can mean for your portfolio.