May 22, 2026
The Yield Trap That Catches Mining Dividend Investors Every Cycle
Income investing in commodity-linked equities carries a paradox that trips up even experienced portfolio builders. When a mining company's share price surges dramatically, the trailing dividend yield compresses in a way that can mislead investors into underestimating what they are actually buying. Conversely, during periods of commodity weakness, a high trailing yield can signal an impending dividend cut rather than genuine income value. Understanding this dynamic is the single most important conceptual framework for anyone evaluating the Rio Tinto dividend yield before committing capital.
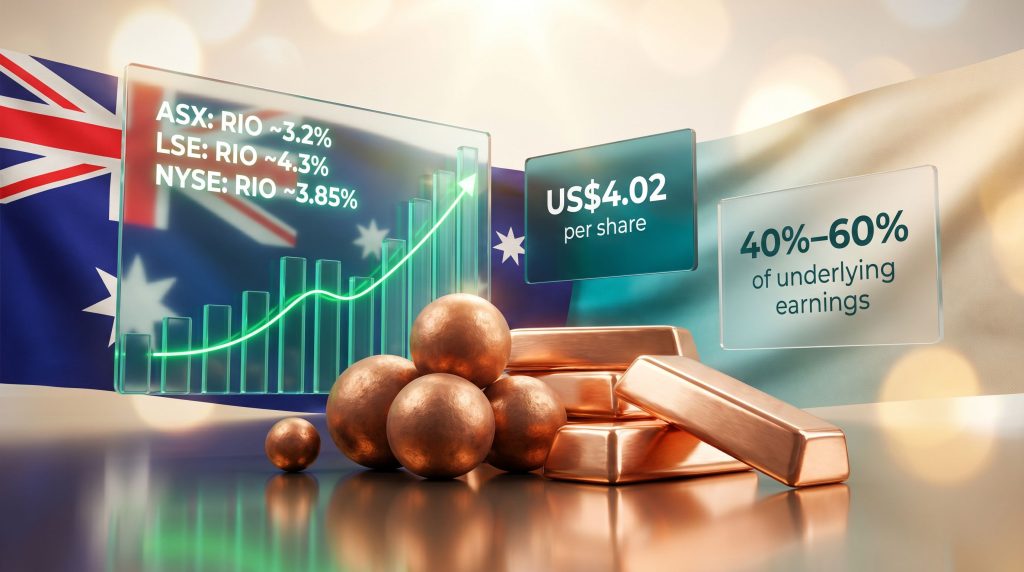
Rio Tinto Ltd (ASX: RIO) sits at an interesting inflection point for income investors in 2026. The share price has climbed approximately 36.5% in 2026 alone, reaching $184.02 per share at the time of recent trading data, and has surged roughly 65% over the prior 12-month period. This extraordinary capital appreciation has been driven by rallying commodity prices and mining equities, elevated inflation expectations, and renewed institutional appetite for hard-asset exposure. However, for dividend-focused investors, that same share price rally has meaningfully compressed the trailing yield metric, raising legitimate questions about whether the current entry point represents genuine income value.
When big ASX news breaks, our subscribers know first
Understanding Rio Tinto's Dividend Policy Architecture
How the 40%–60% Payout Framework Operates in Practice
Rio Tinto's board operates under a formal capital return policy that commits the company to distributing between 40% and 60% of underlying earnings to shareholders over the commodity cycle. A critical distinction that many retail investors overlook is that this commitment is anchored to underlying earnings, not free cash flow or statutory net profit. This matters enormously because underlying earnings strip out impairments, one-off charges, and non-cash items, providing a cleaner but sometimes more flattering picture of operational profitability.
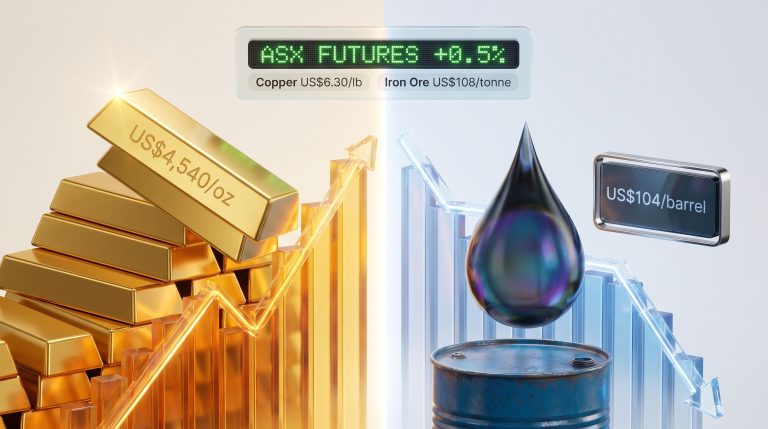
The practical implication is direct: when iron ore prices are elevated and copper demand is firm, underlying earnings swell and dividends follow. When commodity prices retreat, the earnings base contracts and the payout range mechanically produces a lower absolute dividend. This is not a flaw in the policy; it is the policy functioning as designed.
Mining dividends are structurally different from the progressive dividend frameworks used by banks or utilities. Investors who approach Rio Tinto expecting steady, growing annual income payments will repeatedly be surprised by the cyclical reality of commodity-linked earnings.
Semi-Annual Payment Schedule and Recent Dividend History
Rio Tinto pays dividends on a semi-annual basis, with an interim dividend typically settled in September and a final dividend in April of the following year. The two most recently declared payments establish the baseline for any current yield analysis:
- 2025 Final Dividend: US$2.54 per share, ex-dividend 5 March 2026, paid 16 April 2026
- 2025 Interim Dividend: US$1.48 per share, paid 25 September 2025
- Combined trailing 12-month total: US$4.02 per share
Both payments were made with full franking credits attached, consistent with Rio Tinto's long-established practice on its ASX-listed shares. Furthermore, it is worth noting that these two payments were actually lower than the dividends received over the prior 12-month period, even as the share price continued to rally strongly. This divergence between declining dividend quantum and rising share price is precisely the mechanism producing the compressed trailing yield figure. You can review Rio Tinto's full dividend history directly on their investor relations page for additional context.
The Franking Credit Multiplier: A Hidden Yield Advantage
One of the most underappreciated dimensions of the Rio Tinto dividend yield story for Australian investors is the value embedded in franking credits. Because Rio's ASX dividends are typically fully franked, the gross yield is materially higher than the cash yield figure suggests.
| Investor Type | Cash Yield Benefit | Franking Credit Impact |
|---|---|---|
| Australian resident (top marginal rate) | Partial offset of dividend tax | Reduces effective tax burden on income |
| Australian resident (low or zero tax rate) | Full cash yield retained | Significant enhancement to after-tax return |
| SMSF in pension phase | Full cash yield retained | Franking credits refunded in full |
| Non-resident investor | Cash yield only | No franking benefit applies |
For self-managed superannuation funds (SMSFs) in pension phase, where tax on earnings is zero, fully franked dividends from large miners are particularly powerful. The franking credit refund mechanism can add approximately 1.0% to 1.5% to the effective after-tax yield above the stated cash yield, depending on the investor's marginal tax rate. This materially changes the attractiveness calculus when comparing Rio Tinto to international income alternatives that carry no franking benefit.
What Is the Rio Tinto Dividend Yield Across Different Listings?
Yield Divergence Across the ASX, LSE, and NYSE
Rio Tinto operates a dual-listed corporate structure across three major exchanges, and this creates meaningful yield differences depending on which share class an investor holds. Currency effects, share price differentials between listings, and market-specific pricing dynamics all contribute to the variation.
| Exchange | Ticker | Approximate Dividend Yield |
|---|---|---|
| London Stock Exchange | RIO (LSE) | ~4.3% |
| New York Stock Exchange (ADR) | RIO (NYSE) | ~3.85%–3.89% |
| Australian Securities Exchange | RIO (ASX) | ~3.2% trailing |
The ASX-listed trailing yield of approximately 3.2% appears lower than its global counterparts primarily because the Australian-listed shares have experienced more pronounced price appreciation relative to the dividend quantum. Yield figures are also sensitive to whether trailing or forward estimates are used, the currency of measurement, and the precise calculation date. In addition, historical dividend yield data across multiple cycles can help investors contextualise whether the current yield sits at a historically elevated or compressed level.
Why All Rio Dividends Carry Currency Risk for Australian Investors
Rio Tinto declares all dividends in US dollars, regardless of the listing venue. For ASX investors, the actual Australian dollar amount received depends entirely on the USD/AUD exchange rate at the time of conversion. This is a risk factor that receives insufficient attention in most yield discussions.
| USD/AUD Exchange Rate | US$4.02 Annual Dividend | AUD Equivalent Received |
|---|---|---|
| 0.60 (weak Australian dollar) | US$4.02 | ~A$6.70 |
| 0.65 (neutral rate) | US$4.02 | ~A$6.18 |
| 0.70 (strong Australian dollar) | US$4.02 | ~A$5.74 |
A strengthening Australian dollar directly reduces the AUD-equivalent dividend income, even when the USD dividend remains unchanged. This currency translation effect can meaningfully alter the real yield experienced by domestic investors and is often overlooked during periods of AUD strength.
Is a 3.2%–4.3% Yield Competitive Within the Mining Sector?
Benchmarking Rio Tinto Against Global Mining Peers
To assess whether the current Rio Tinto dividend yield represents genuine income value, it is useful to benchmark the company against the broader peer group of diversified global miners.
| Company | Approximate Dividend Yield | Payout Policy | Franking on ASX |
|---|---|---|---|
| Rio Tinto (ASX: RIO) | ~3.2%–4.3% | 40%–60% of underlying earnings | Typically fully franked |
| BHP Group (ASX: BHP) | ~4%–5% | 50% minimum payout | Typically fully franked |
| Anglo American (LSE) | Variable | Reduced during restructuring phases | Not applicable |
| Glencore (LSE) | ~4%–6% | Discretionary plus buybacks | Not applicable |
Rio Tinto's yield sits at the lower end of this peer comparison on a trailing basis, largely reflecting the extraordinary share price appreciation the stock has experienced. On a gross franking-adjusted basis, however, Rio's effective yield for eligible Australian investors is considerably more competitive than a simple comparison of headline figures would suggest.
Mining Dividends Versus ASX Bank Dividends: A Structural Comparison
Income investors frequently compare mining dividends to those offered by ASX-listed major banks. The following framework illustrates the fundamental structural differences between these two income sources:
| Attribute | Rio Tinto (ASX: RIO) | Major ASX Banks (CBA, NAB, etc.) |
|---|---|---|
| Yield Stability | Cyclical and variable | More stable with progressive tendencies |
| Franking Credits | Typically fully franked | Typically fully franked |
| Growth Potential | Commodity-cycle dependent | Earnings-linked with credit cycle exposure |
| Capital Volatility | Higher | Lower |
| Income Predictability | Lower over short-to-medium term | Higher over short-to-medium term |
| Sensitivity to Global Macro | Very high (iron ore, copper pricing) | Moderate (domestic credit conditions) |
Rio Tinto is best characterised as a cyclical income contributor rather than a defensive income anchor. It can generate exceptional yields during commodity supercycles but requires investors to accept meaningful variability in annual income.
The Commodity Price Nexus: How Earnings Translate Into Dividends
Rio Tinto's Revenue Drivers and Their Dividend Implications
Forecasting the Rio Tinto dividend yield over a forward horizon requires understanding the company's commodity exposure hierarchy. The revenue base is not monolithic, and the relative weighting of each commodity to total earnings shapes how different macro scenarios translate into dividend outcomes.
- Iron ore remains the dominant earnings driver, with Pilbara operations in Western Australia producing among the highest-quality hematite ore in the world at low cash costs. Australia's iron ore advantage in global supply is a key structural support for Rio's earnings base.
- Copper is growing in strategic importance, with global electrification and energy transition infrastructure creating durable long-run demand
- Aluminium and alumina provide a meaningful secondary earnings stream through the Pacific Aluminium and Yarwun operations
- Lithium is an emerging growth segment, with the Rincon project in Argentina and the Jadar project in Serbia (subject to regulatory and community approval processes) representing future optionality
The iron ore quality dimension deserves specific attention. Rio Tinto's Pilbara blend typically assays at around 62% iron content, and the company produces both standard and higher-grade products. However, Chinese steel mills have increasingly differentiated between ore grades, with high-silica, lower-grade products trading at significant discounts. Furthermore, the iron ore demand outlook from China remains a pivotal variable for Rio's ability to sustain premium product positioning and earnings stability.
Three Forward Scenarios for the Rio Tinto Dividend Yield
| Scenario | Commodity Price Assumption | Estimated Forward Yield | Assessment |
|---|---|---|---|
| Bull Case | Iron ore above US$120/t, copper elevated | 5%–6%+ | Possible but requires strong Chinese stimulus |
| Base Case | Iron ore US$90–$110/t, stable copper | 3.5%–4.5% | Most probable in near term |
| Bear Case | Iron ore below US$85/t, demand softening | 2%–3% | Possible if Chinese property sector deteriorates further |
These scenarios are speculative in nature and are provided for illustrative purposes only. Commodity prices are inherently difficult to forecast, and investors should not rely on any single scenario as a basis for investment decisions. Past dividend payments are not indicative of future distributions.
The Entry Price Problem: A Framework for Dividend Investors
How Share Price Appreciation Compresses Yield on New Investment
One of the most practically important but underappreciated concepts in mining income investing is the distinction between yield on cost and current yield. An investor who purchased Rio Tinto shares 12 months ago at a price approximately 65% lower than current levels would be earning a substantially higher yield on their original investment than an investor entering today at the prevailing share price.
This is not merely an academic point. It speaks to the fundamental challenge of buying cyclical dividend payers late in a commodity upswing, when share prices have already repriced to reflect elevated earnings expectations. At current price levels, the implied forward yield assumes a continuation of strong commodity conditions. Any moderation in iron ore or copper prices could simultaneously compress earnings and trigger a re-rating of the share price lower, creating a double blow to income investors who entered at elevated prices.
Five Critical Questions Before Investing in Rio Tinto for Yield
- Where is iron ore in its cycle? Rio's earnings are disproportionately leveraged to iron ore pricing, and the current iron ore price environment relative to long-run incentive pricing is a crucial starting point for any forward yield assessment.
- What is the likely forward payout ratio? Trailing yields derived from historically elevated dividend payments may significantly overstate what investors can realistically expect going forward.
- What is the after-tax yield accounting for franking? For SMSF investors and others with low marginal tax rates, the gross franking-adjusted yield provides a more accurate income picture than the headline cash yield.
- What is the currency risk profile? The USD denomination of Rio's dividends creates a structural translation risk for AUD-based investors that varies materially with exchange rate movements.
- Is optimism already embedded in the share price? A share price that has rallied 65% in 12 months may already be discounting a sustained commodity upswing, leaving limited margin of safety for income investors if conditions soften.
The next major ASX story will hit our subscribers first
Frequently Asked Questions: Rio Tinto Dividend Yield
What is Rio Tinto's current dividend yield?
The Rio Tinto dividend yield varies depending on which exchange the shares are held through. The ASX-listed shares reflect a trailing yield of approximately 3.2%, the LSE-listed shares yield approximately 4.3%, and the NYSE-listed ADR yields approximately 3.85% to 3.89%. The variation is primarily driven by share price differentials between listings and currency effects, rather than differences in the underlying dividends paid.
Does Rio Tinto pay fully franked dividends?
Rio Tinto has a well-established practice of attaching full franking credits to dividends paid on its ASX-listed shares. This materially enhances after-tax returns for eligible Australian resident investors, particularly SMSFs in pension phase, where franking credit refunds can add approximately 1.0% to 1.5% to the effective yield above the stated cash rate.
How often does Rio Tinto pay dividends?
Dividends are paid twice per year on a semi-annual basis. The interim dividend is typically settled in September, while the final dividend is typically paid in April of the following calendar year.
What was Rio Tinto's most recent dividend?
The most recently declared dividends were the 2025 Final Dividend of US$2.54 per share (paid April 2026) and the 2025 Interim Dividend of US$1.48 per share (paid September 2025), for a combined trailing total of US$4.02 per share.
Can Rio Tinto's dividend be cut?
Yes, and it has been reduced in previous commodity downturns. The 2015 to 2016 iron ore price collapse resulted in materially lower dividend payments, demonstrating that Rio's income is explicitly tied to commodity market conditions rather than representing a guaranteed or progressive income stream. The formal payout policy of 40% to 60% of underlying earnings means that any sustained earnings decline will flow directly into lower dividend payments.
Is Rio Tinto suitable for a passive income portfolio?
Rio Tinto can play a role within a diversified income portfolio, but its cyclical nature means it functions best as a supplementary income position rather than a core defensive holding. Applying a sound asset allocation framework helps investors determine the appropriate weighting, informed by tax position relative to franking credit utilisation, existing exposure to commodity-linked assets, investment time horizon, and tolerance for variability in annual income receipts. In addition, portfolio diversification strategies that combine cyclical miners with more defensive income sources can help smooth out the variability inherent in commodity-linked dividend streams.
This article contains general information only and does not constitute personal financial advice. Investors should consider their individual financial circumstances and consult a licensed financial adviser before making investment decisions. Past dividend payments are not indicative of future distributions. Commodity prices and foreign exchange rates can move materially and unpredictably, affecting both earnings and dividend outcomes for mining companies.
Want to Capitalise on the Next Major ASX Mineral Discovery Before the Market Catches On?
Discovery Alert's proprietary Discovery IQ model delivers real-time alerts on significant ASX mineral discoveries, transforming complex mineral data into clear, actionable insights for investors at every experience level — explore the historic returns generated by major discoveries to understand the opportunity, and begin your 14-day free trial at Discovery Alert to position yourself ahead of the broader market.