June 17, 2026
Why Measuring Mining Returns Through a Single Lens Misses the Full Picture
Most investors instinctively reach for a single number when evaluating whether a stock has performed well: the share price return. For commodity-linked equities, this habit creates a dangerously incomplete picture. Mining majors generate returns across at least three distinct channels simultaneously, and collapsing that complexity into a single percentage strips away much of the information that actually matters.
Understanding how the Rio Tinto shares investment return over five years played out requires examining capital appreciation, dividend income, and inflation-adjusted purchasing power as separate but interconnected layers. Only when all three are assembled together does the full picture emerge, and for long-term shareholders, that picture turns out to be considerably more compelling than headline share price movements alone would suggest.
When big ASX news breaks, our subscribers know first
The Commodity Foundations Underneath the Share Price
Iron Ore: A Floor That Kept Defying Pessimists
For much of the past decade, a chorus of analysts has consistently forecast that iron ore prices would weaken materially as Chinese steel demand plateaued and new supply entered the market. That forecast has been repeatedly wrong. The iron ore demand outlook continues to surprise even seasoned commodity analysts.
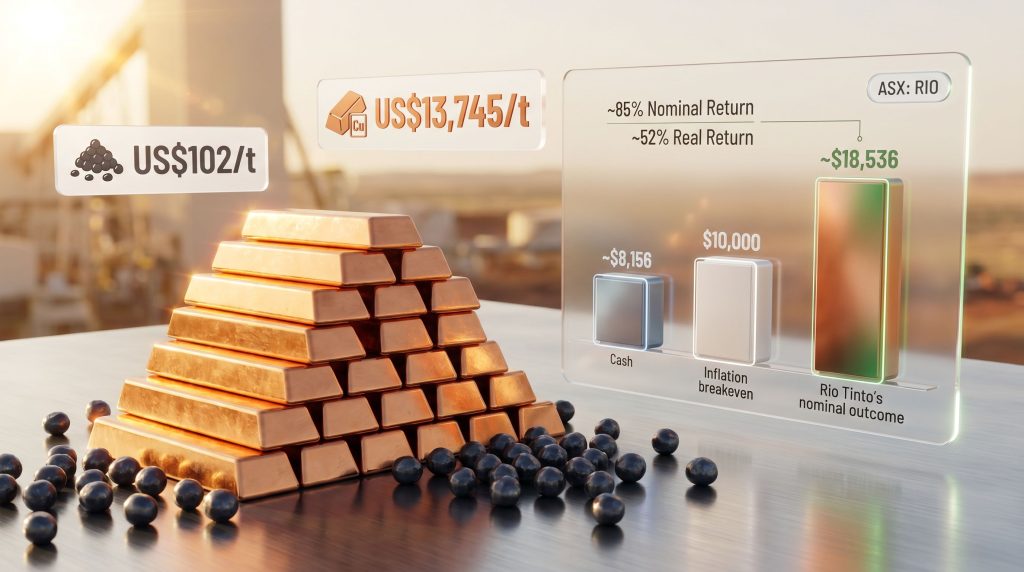
Iron ore prices broadly sustained levels at or above US$100 per tonne across the five-year window under review, recently trading at approximately US$102 per tonne. This price resilience has been the single most important factor underpinning Rio Tinto's earnings stability and its capacity to pay substantial dividends across multiple cycles.
What makes this durability particularly instructive is what it reveals about commodity forecasting as a discipline. Consensus bearish calls in commodity markets are frequently undermined by the same structural forces that created prior bull markets: underinvestment in new supply during periods of price weakness, longer-than-expected project lead times, and demand trajectories that surprise to the upside in emerging economies.
Iron ore's persistence above US$100 per tonne is as much a story about supply discipline and infrastructure investment timelines as it is about Chinese demand. New high-quality iron ore deposits capable of competing with Pilbara-grade material take years to develop, which creates natural price floors that analytical models often underestimate.
Copper: Structural Demand Driving a Multi-Year Re-Rating
While iron ore provided the earnings floor, copper has increasingly become the ceiling driver. According to Bloomberg data, copper prices rose approximately 46% over five years, reaching around US$13,745 per tonne. This is not a cyclical bounce; it reflects a genuine structural shift in the global demand profile for the metal, and the ongoing copper supply crunch is reinforcing this trajectory.
Copper's role in electrification infrastructure is difficult to overstate. A single electric vehicle contains roughly two to four times the copper of a conventional internal combustion engine vehicle. Utility-scale solar and wind installations require large quantities of copper wiring. Grid modernisation programmes across the United States, Europe, and parts of Asia are creating demand pipelines that extend well beyond typical commodity cycle timeframes.
Rio Tinto's copper portfolio, including assets such as Kennecott in the United States and the Oyu Tolgoi operation in Mongolia, has grown materially in strategic importance as these demand trends have accelerated. The Oyu Tolgoi expansion into underground extraction is expected to increase production volumes significantly over the coming decade, making it one of the largest known copper deposits globally.
What is less commonly appreciated is the grade challenge facing the copper industry broadly. Average copper ore grades at operating mines globally have been declining for decades, meaning miners must process more rock per tonne of copper produced. This structural cost pressure, paradoxically, acts as a long-term price support mechanism, since higher-cost marginal supply sets a higher floor beneath which prices struggle to stay for extended periods.
Breaking Down the Actual Numbers: A $10,000 Investment in Rio Tinto
The Capital Appreciation Component
In mid-June 2021, Rio Tinto shares on the ASX were trading at approximately $123.45 per share. A $10,000 entry at that price would have secured approximately 81 shares.
By mid-June 2026, those same shares were trading at approximately $188.69 each, valuing that 81-share position at roughly $15,284. The capital gain alone therefore amounted to approximately $5,284, or a 52.8% price return on the original investment. Investors can review Rio Tinto's share price history directly on the company's official investor relations page for precise historical figures.
Dividend Income: The Component Most Investors Undervalue
Capital gain figures frequently dominate financial media coverage of mining stocks, but for long-term holders of Rio Tinto, dividend income has been a comparably important source of wealth creation. Furthermore, how commodity prices and miners interact directly shapes the scale and sustainability of those dividend payments over time.
Over the five-year period from mid-2021 to mid-2026, shareholders received approximately 10 fully franked dividend payments, with cumulative payments totalling approximately $40.14 per share. For an 81-share holding, this translates to approximately $3,251 in dividend income. That figure assumes dividends were spent as received rather than reinvested.
The Franking Credit Advantage: A Uniquely Australian Consideration
Fully franked dividends are more valuable than their face value suggests for many Australian investors. The attached franking credits represent company tax already paid at the corporate rate, which shareholders can use to offset their personal tax liability. For superannuation funds in pension phase paying zero tax, franking credits can generate direct cash refunds from the Australian Taxation Office, effectively increasing the yield received above the headline dividend figure.
This mechanism is unique to Australia's dividend imputation system and represents a structural advantage for domestic investors holding high-yielding, fully franked ASX shares inside tax-advantaged structures. It is a dimension of return that international comparisons of Rio Tinto's NYSE-listed ADRs or London-listed shares simply do not capture.
Combined Nominal Return Summary
| Return Component | Approximate Value |
|---|---|
| Initial Investment | $10,000 |
| Capital Gain (Share Price) | +$5,284 |
| Dividend Income (10 payments) | +$3,251 |
| Total Nominal Portfolio Value | ~$18,536 |
| Total Nominal Return | ~85% |
What That 85% Nominal Return Actually Means in Purchasing Power Terms
Why Inflation-Adjusted Returns Tell a Different Story
Nominal returns measure raw dollar movements. Real returns measure what those dollar movements actually buy. The distinction became particularly significant across the 2021 to 2026 period, during which Australian inflation accelerated sharply following pandemic-era monetary and fiscal stimulus, supply chain disruptions, and elevated energy costs.
Various economic estimates place cumulative Australian inflation across this five-year window at approximately 22.3% to 22.9%. Applying a midpoint estimate of roughly 22.6%, the real purchasing power of $10,000 held in cash across the same period would have declined to approximately $8,156. An investor who simply avoided markets entirely would have lost nearly $1,844 in real economic terms without making a single transaction.
Rio Tinto's Real Return Calculation
Applying the same 22.6% inflation deflator to the nominal portfolio value of $18,536 produces a real (inflation-adjusted) portfolio value of approximately $15,119. This represents a real gain of roughly $5,119 over the original $10,000 investment, or approximately 52% in real terms across the five-year period.
That is a meaningful outcome. It means Rio Tinto shareholders did not merely preserve purchasing power against one of Australia's most sustained inflationary episodes in decades; they grew it substantially. Consequently, the Rio Tinto shares investment return over five years stands as a compelling case study in real wealth preservation through equity exposure.
Real Returns Compared Against Key Reference Points
| Benchmark | Approximate 5-Year Outcome (Real Terms) |
|---|---|
| Cash under the mattress | ~$8,156 (real loss of ~$1,844) |
| Inflation breakeven | $10,000 (zero real gain) |
| ASX 200 Index (approximate range) | Variable; typically 30-50% nominal across comparable periods |
| Rio Tinto (ASX: RIO) | ~$15,119 (real gain of approximately 52%) |
Note: ASX 200 returns vary depending on the specific measurement period and whether dividends are included. Comparisons are indicative and should be verified against current index data before drawing investment conclusions.
The Multi-Listing Complexity: Why Return Figures Vary Across Platforms
Same Company, Different Numbers
Rio Tinto is a dual-listed company with shares trading on the ASX in Australian dollars, on the London Stock Exchange in British pounds, and as American Depositary Receipts on the NYSE in US dollars. This creates a situation where the same underlying business produces materially different reported return figures depending on which listing is measured, in which currency, and across which precise timeframe.
Five-year return estimates for the NYSE-listed RIO ADR have ranged from approximately 22.5% to 37.3% depending on the data provider and the specific measurement window, according to sources including Yahoo Finance and Seeking Alpha. These figures differ significantly from the ASX-based analysis above, primarily because of currency translation effects. For a broader perspective, Morningstar's independent analysis of Rio Tinto on the ASX provides useful context for long-term return comparisons.
The AUD/USD Translation Layer
Rio Tinto's revenues are overwhelmingly denominated in US dollars, since iron ore and copper are globally priced in USD. When those earnings are translated into Australian dollars for reporting and dividend payment purposes, movements in the AUD/USD exchange rate introduce an additional variable.
A strengthening Australian dollar compresses the AUD value of USD-denominated revenues, reducing reported earnings and potentially constraining dividend capacity even when underlying commodity prices are rising. Conversely, a weakening AUD amplifies the reported AUD value of the same revenue stream.
This currency overlay is invisible to investors looking only at commodity price charts and creates divergences between underlying business performance and reported financial outcomes. Australian investors using ASX-priced RIO shares measured in AUD are effectively operating with this currency translation baked into their return figures already, making the ASX listing the most relevant reference point for domestic portfolio analysis.
Key Risk Factors That Could Alter Future Return Trajectories
The Variables Investors Must Monitor Continuously
The five-year return profile described above reflects a specific and favourable set of commodity market conditions. Investors should not treat past performance as a template for future outcomes. Several risk factors carry the potential to materially alter Rio Tinto's return profile going forward:
- Iron ore price sensitivity: A sustained decline below approximately US$80 to US$90 per tonne would materially compress margins from the Pilbara operations, which remain the company's primary earnings engine
- China demand concentration: Approximately 50% to 60% of Rio Tinto's revenues are linked directly or indirectly to Chinese industrial activity, creating significant geographic demand concentration risk
- Ore grade and mine life considerations: As higher-grade reserves are progressively depleted at operating mines, future production from some assets may require processing lower-grade ore, increasing unit costs over time
- Capital allocation risk: Large acquisitions, project cost overruns, or unexpected impairment charges can erode shareholder value even in periods of strong commodity prices. Rio Tinto's history includes both successful capital allocation and high-profile write-downs
- Currency dynamics: AUD/USD and GBP/USD movements affect the translation of USD-denominated revenues into reported earnings across both primary listing currencies
- ESG and regulatory exposure: Environmental compliance obligations, Indigenous land rights considerations in Australia, and decarbonisation commitments represent growing operational and reputational variables that can affect project timelines and costs
- Dividend variability: Rio Tinto's payout policy is linked to underlying earnings rather than a fixed commitment, meaning dividend income fluctuates across commodity cycles
The next major ASX story will hit our subscribers first
Investment Strategy Considerations for Resource Major Exposure
Dollar-Cost Averaging in Cyclical Commodity Equities
One of the most persistent behavioural errors in mining investment is the tendency to concentrate capital at cyclical peaks, when positive news flow and strong recent returns create optimism that attracts capital precisely when valuation risk is highest. Equally damaging is the tendency to sell at cyclical lows, when bearish sentiment is most intense and forward-looking opportunity is often greatest.
Spreading investment across multiple entry points over time through a structured dollar-cost averaging approach reduces the impact of entry timing on long-term returns. For volatile commodity-linked equities like Rio Tinto, this approach smooths effective entry prices across different phases of the commodity cycle. Investors building positions through regular superannuation contributions or periodic investment programmes benefit from this mechanism naturally.
Dividend Reinvestment as a Compounding Accelerator
The analysis above assumed dividends were spent as received. In practice, the dividend reinvestment benefits for long-term holders are considerable, as those who systematically reinvested the 10 dividend payments would have purchased incrementally more shares at varying prices across the five-year period. This further increases total share count and amplifies the compounding effect. Over sufficiently long holding periods, reinvested dividends in high-yielding miners can contribute more to total wealth accumulation than capital appreciation alone.
Peer Context: How Does Rio Tinto Compare?
| Company | Primary Commodity Exposure | Approximate Return Profile Context |
|---|---|---|
| Rio Tinto (ASX: RIO) | Iron ore, copper, aluminium | ~85% nominal over 5 years including dividends |
| BHP Group (ASX: BHP) | Iron ore, copper, coal | Broadly comparable; varies by measurement period |
| South32 (ASX: S32) | Aluminium, manganese, zinc | Different commodity cycle exposure profile |
| Mineral Resources (ASX: MIN) | Lithium, iron ore | Higher volatility; meaningfully different return trajectory |
Peer comparisons are indicative only. Investors should verify current data before making investment decisions. Past returns do not guarantee future outcomes.
Frequently Asked Questions
How much would $10,000 invested in Rio Tinto shares five years ago be worth today?
Based on ASX pricing, a $10,000 investment made in mid-June 2021 at approximately $123.45 per share would have purchased around 81 shares. At a mid-June 2026 price of approximately $188.69, those shares would be worth roughly $15,284. Including approximately $3,251 in cumulative fully franked dividend income across 10 payment cycles, the total nominal portfolio value reaches approximately $18,536, representing a nominal return of around 85%.
What is Rio Tinto's inflation-adjusted return over five years?
After applying a cumulative Australian inflation estimate of approximately 22.6% across the 2021 to 2026 period, the real purchasing power value of that $18,536 nominal portfolio is approximately $15,119. This represents a real return of roughly 52% on the original $10,000 investment, demonstrating that the Rio Tinto shares investment return over five years has meaningfully outpaced inflation.
Why do Rio Tinto return figures differ across different platforms and data providers?
Rio Tinto trades across the ASX in AUD, the London Stock Exchange in GBP, and the NYSE as USD-denominated ADRs. Return figures vary materially depending on which listing is measured, the base currency applied, and the specific dates used. Australian investors should focus on ASX-listed RIO performance measured in AUD for the most domestically relevant comparison.
Is Rio Tinto's dividend sustainable going forward?
Rio Tinto's dividend policy is tied to underlying earnings rather than a fixed payout commitment. This means dividend levels fluctuate with commodity price cycles. Investors should model dividend scenarios across a range of iron ore and copper price assumptions rather than projecting recent payout levels forward as a baseline.
Is past performance in Rio Tinto shares a reliable indicator of future returns?
No. The five-year return profile described above reflects specific commodity market conditions, particularly iron ore price resilience and copper's structural appreciation, that may not persist. Future returns depend on evolving commodity cycles, Chinese demand dynamics, capital allocation quality, currency movements, and broader macroeconomic conditions. Past performance is not indicative of future results.
This article contains general information only and does not constitute personalised financial advice. Investors should consider their own financial circumstances and seek professional advice before making investment decisions. Past performance is not indicative of future returns.
Want To Catch the Next Major ASX Mineral Discovery Before the Market Does?
While blue-chip miners like Rio Tinto offer exposure to established commodity cycles, Discovery Alert's proprietary Discovery IQ model delivers real-time alerts the moment significant new mineral discoveries are announced on the ASX — explore historic discoveries that generated extraordinary returns and begin your 14-day free trial to position yourself ahead of the broader market.