
June 5, 2026
The global copper market stands at a pivotal juncture where rising copper inventories and China's smelter surge create apparent contradictions with underlying structural demand growth. While exchange warehouses accumulate metal and Chinese refining capacity reaches unprecedented levels, fundamental supply constraints and electrification trends continue reshaping long-term market dynamics. Understanding these competing forces becomes essential for navigating current market conditions and positioning for future opportunities.
Current market dynamics reveal a fascinating contradiction where record‑high copper prices earlier this year have given way to inventory accumulation periods. This apparent paradox emerges from the fundamental disconnect between refining capacity expansion and concentrate availability, creating conditions where temporary oversupply in refined products coexists with chronic shortages in raw materials.
What Does Rising Copper Inventory Signal for Global Metal Markets?
Exchange-traded copper inventories have experienced dramatic accumulation throughout early 2026, reversing the tight supply conditions that characterised the previous year. The magnitude of this inventory buildup represents one of the most significant short-term rebalancing events in recent copper market history, with rising copper inventories and China's smelter surge fundamentally altering market dynamics.
Exchange-Level Inventory Analysis Reveals Market Rebalancing
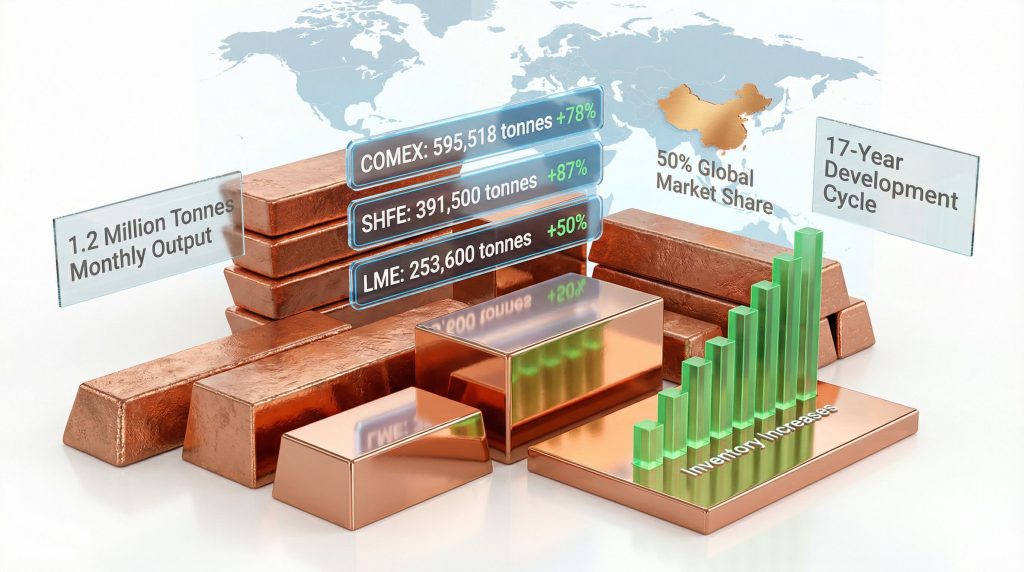
Physical copper stocks across major global exchanges have surged beyond 1.24 million tonnes combined, marking a substantial departure from the supply tightness that drove prices above $14,500 per tonne earlier this year. The London Metal Exchange reports inventory increases exceeding 250,000 tonnes, while Shanghai Futures Exchange stocks have grown by approximately 390,000 tonnes year-to-date.
| Exchange | Current Stock (tonnes) | YTD Change | Monthly Variation |
|---|---|---|---|
| COMEX | 595,518 | +78% | +49,809 |
| SHFE | 391,500 | +87% | +119,025 |
| LME | 253,600 | +50% | +28,950 |
These inventory movements reflect several converging factors rather than simple demand destruction. Seasonal consumption patterns typically weaken during first quarter periods, particularly in China where construction activity slows due to weather constraints and extended holiday periods following Lunar New Year celebrations.
Furthermore, the timing and scale of inventory accumulation suggest cyclical rebalancing rather than structural oversupply. Historical precedent from 2020-2021 demonstrates how copper inventories can spike temporarily during economic transitions before normalising as underlying demand fundamentals reassert themselves.
Geographic Distribution of Copper Stock Accumulation
Inventory distribution patterns across exchanges provide critical insights into regional supply-demand dynamics. Shanghai Futures Exchange has captured the largest absolute increase in copper stocks, reflecting expanded domestic Chinese production outpacing local consumption rates. This concentration indicates that Chinese smelting expansion has temporarily created regional oversupply conditions.
European and North American inventory accumulation follows different patterns, with stocks rising more gradually as refined copper flows redistribute globally. The differential accumulation rates suggest that Chinese production increases are flowing into international markets, creating temporary abundance where scarcity previously existed.
However, storage economics play an increasingly important role in inventory decisions. Lower forward premiums reduce the profitability of physical copper storage, encouraging inventory releases and discouraging additional accumulation. This dynamic creates natural inventory ceilings that prevent unlimited stock buildups.
Price Discovery Mechanisms During Inventory Build-Up Cycles
Rising copper inventories have compressed futures curve structures, shifting markets from backwardation toward contango conditions. This transition affects price discovery by reducing the scarcity premium that characterised tight market conditions throughout 2025.
Convenience yield erosion represents a critical mechanism in this process. When physical copper becomes readily available, the premium for immediate delivery diminishes, flattening price curves and reducing incentives for speculative storage activities.
Consequently, forward price relationships now reflect storage costs and financing charges rather than supply scarcity premiums. This normalisation process typically precedes either renewed tightness or extended consolidation periods, depending on underlying fundamental developments.
When big ASX news breaks, our subscribers know first
How China's Smelting Capacity Expansion Reshapes Global Copper Dynamics
China's copper refining sector has fundamentally transformed global supply chain dynamics over the past two decades, creating structural imbalances that continue reverberating throughout international markets. The scale and pace of this expansion represents one of the most significant industrial capacity buildouts in modern commodity history, directly contributing to rising copper inventories and China's smelter surge.
Production Volume Analysis: Monthly Output Approaching 1.2 Million Tonnes
Chinese refined copper production has reached unprecedented levels, with monthly output approaching according to industry reports 1.2 million tonnes during peak production periods. This expansion trajectory positions China as the dominant global copper refining centre, accounting for approximately 50% of worldwide refined copper production.
| Period | Annual Capacity (Mt) | Global Market Share | Capacity Utilisation |
|---|---|---|---|
| 2005 | 1.8 | 15% | 85% |
| 2015 | 6.2 | 35% | 78% |
| 2026 | 9.6 | 50% | 72% |
The progression reveals declining capacity utilisation rates despite absolute production increases. This paradox reflects the reality that concentrate supply has failed to keep pace with refining capacity expansion, forcing many Chinese smelters to operate below optimal levels or compete aggressively for available feedstock.
Moreover, Chinese smelting capacity additions since 2005 represent more than 90% of global refining capacity growth, concentrating copper processing capabilities within a single country to an unprecedented degree. This geographic concentration creates both efficiencies and vulnerabilities within global copper supply chains.
Treatment Charge Collapse and Its Economic Implications
Treatment and refining charges have collapsed to historic lows, with benchmark annual contracts between major miners and Chinese smelters falling to approximately zero dollars per tonne. This extraordinary compression reflects the structural oversupply of refining capacity relative to available copper concentrates.
Traditional smelter economics relied on treatment charges providing 40-60% of total revenues, with the remainder coming from by-product credits and operational efficiencies. Current market conditions have eliminated this primary revenue stream, forcing smelters to depend entirely on ancillary income sources.
In addition, by-product revenue optimisation has become essential for smelter profitability. Gold and silver recovery from anode slimes, sulfuric acid production, and other metallurgical by-products now represent the primary profit centres for many Chinese copper smelters.
The treatment charge environment creates perverse incentives where smelters may accept concentrate at zero processing fees simply to maintain operational throughput and absorb fixed overhead costs. This dynamic sustains excess capacity that would otherwise be forced offline under normal market conditions.
Structural Overcapacity in Chinese Refining Infrastructure
Chinese copper smelting infrastructure now significantly exceeds global concentrate supply capabilities, creating a permanent structural imbalance that affects international copper markets. This overcapacity represents billions of dollars in stranded capital investments that cannot generate adequate returns under current market conditions.
The geographic concentration of refining capacity within China creates supply chain vulnerabilities and competitive distortions. Environmental regulations, energy constraints, or geopolitical developments could potentially disrupt global copper supply despite adequate mining capacity existing elsewhere.
Furthermore, state-owned enterprise involvement in Chinese smelting maintains capacity online that might otherwise close under purely commercial considerations. Government support mechanisms and strategic objectives influence capacity utilisation decisions beyond pure economic optimisation.
Why Are Macro Headwinds Pressuring Copper Despite Electrification Demand?
Macroeconomic conditions exert significant influence on copper pricing despite underlying structural demand growth from electrification trends. These shorter-term pressures can overwhelm fundamental supply-demand dynamics for extended periods, creating investment opportunities and risks that require careful navigation, particularly when combined with rising copper inventories and China's smelter surge.
US Dollar Strength Impact on Commodity Pricing
The US Dollar Index has appreciated measurably during early 2026, creating headwinds for dollar-denominated commodities including copper. Currency strength reduces purchasing power for international buyers, effectively increasing copper costs in local currency terms across major consuming regions.
Dollar strength particularly affects emerging market demand centres where local currency depreciation amplifies copper price increases. China, India, and Southeast Asian markets experience reduced affordability when the dollar appreciates, dampening demand signals despite underlying consumption growth.
However, mining cost structures provide partial offsets to dollar strength, as many operating expenses in emerging markets are denominated in local currencies. Equipment purchases, energy imports, and debt servicing typically remain dollar-linked, limiting these natural hedging effects.
Foreign exchange elasticity of copper demand typically ranges from -0.3 to -0.5 for emerging markets, meaning 10% dollar appreciation reduces demand by approximately 3-5%. This relationship explains why currency movements can significantly impact copper pricing independent of fundamental supply-demand balances.
Energy Cost Inflation Effects on Industrial Metal Consumption
Rising energy prices directly affect both copper production costs and end-user demand patterns. Industrial electricity prices have increased 15-25% year-to-date across major consuming regions, compressing margins for energy-intensive copper processing and manufacturing activities.
Smelting operations face particular pressure from energy cost inflation, as copper refining requires substantial electricity inputs. Energy typically represents 20-30% of primary smelting cash costs, making electricity price increases immediately material to smelter profitability.
In addition, end-user industries experience reduced competitiveness when energy costs rise, potentially delaying capital expenditure projects and reducing copper intensity in new installations. Wire manufacturers, construction equipment producers, and appliance manufacturers all face margin pressure that can translate into reduced copper demand.
Energy cost pass-through mechanisms operate with significant time lags, meaning current energy price increases will affect copper demand patterns over subsequent quarters rather than immediately. This creates complex forecasting challenges for market participants.
Chinese Import Demand Patterns and Seasonal Variations
China's copper import patterns follow predictable seasonal cycles that significantly influence global market dynamics. First quarter imports typically decline 15-20% compared to fourth quarter levels due to holiday periods, weather constraints, and construction seasonality.
Manufacturing activity in China shows pronounced seasonal patterns, with production schedules typically reducing during winter months and recovering throughout spring and summer periods. These cycles affect copper consumption even when underlying economic growth remains steady.
Furthermore, inventory management strategies among Chinese manufacturers amplify seasonal demand variations. Companies often reduce raw material purchases during slower periods to optimise working capital, creating additional pressure on copper import volumes beyond pure consumption changes.
Government policy timing affects Chinese copper demand through infrastructure spending patterns and regulatory implementation schedules. Economic stimulus measures, environmental compliance deadlines, and construction project approvals often cluster around specific calendar periods, creating additional demand volatility.
What Economic Forces Drive Long-Term Copper Supply-Demand Imbalances?
Long-term copper market dynamics operate independently from short-term inventory fluctuations and cyclical demand patterns. These structural forces shape investment requirements and supply adequacy over decades rather than quarters, creating persistent tensions between available supply and emerging consumption needs, despite current rising copper inventories and China's smelter surge.
Electrification Infrastructure Requirements by Sector
Electric vehicle adoption creates copper demand growth that significantly exceeds historical consumption patterns. Battery electric vehicles require 2-3 times more copper than internal combustion engines, with additional requirements for charging infrastructure and grid capacity upgrades.
- Automotive sector transformation: 80-100 kg copper per electric vehicle versus 25-30 kg for conventional vehicles
- Charging infrastructure expansion: DC fast charging stations require 150-200 kg copper per installation
- Grid modernisation requirements: Smart grid technologies increase copper intensity by 30-40% compared to traditional systems
- Energy storage integration: Battery storage systems require substantial copper wiring and power conditioning equipment
Renewable energy systems demonstrate similar copper intensity increases compared to fossil fuel alternatives. Wind turbines contain 3-4 tonnes of copper each, while solar installations require approximately 4-5 tonnes of copper per megawatt of capacity.
Moreover, power transmission infrastructure faces unprecedented expansion requirements as renewable energy sources often locate far from consumption centres. High-voltage transmission lines require 8-12 tonnes of copper per kilometre, creating massive copper requirements for grid expansion projects.
Data Centre Power Infrastructure Investment Projections
Artificial intelligence and cloud computing infrastructure create entirely new categories of copper demand that did not exist in historical consumption models. Data centre construction and power infrastructure requirements are accelerating beyond previous forecasting assumptions.
"The copper market's current inventory buildup represents a cyclical rebalancing rather than structural demand destruction, as electrification trends and infrastructure requirements continue driving long-term consumption growth despite near-term price corrections."
Data centre power requirements have increased exponentially with AI processing demands. Modern AI-optimised facilities require 20-40 megawatts per facility compared to 5-10 megawatts for traditional data centres, dramatically increasing copper-intensive power infrastructure requirements.
In addition, cooling system requirements in high-density computing environments often utilise copper-intensive heat exchange systems. Advanced liquid cooling technologies require substantial copper tubing and heat exchanger components beyond traditional air cooling approaches.
Uninterruptible power supply systems and backup generation facilities at data centres require extensive copper wiring and power distribution equipment. These redundant systems effectively double copper requirements compared to typical industrial facilities.
Electric Vehicle Adoption Rates and Copper Intensity Analysis
Electric vehicle adoption trajectories vary significantly across global markets, but all major automotive markets show accelerating electrification trends. European markets target 100% electric vehicle sales by 2035, while China and the United States have established aggressive electrification incentives.
Battery chemistry evolution affects copper requirements per vehicle. Lithium iron phosphate batteries require less copper than nickel-based chemistries, but overall vehicle electrification still represents massive copper demand increases regardless of specific battery technologies.
Furthermore, commercial vehicle electrification creates particularly significant copper demand. Electric buses require 300-400 kg of copper each, while heavy-duty electric trucks can require 500-800 kg depending on battery size and power requirements.
Fleet replacement cycles ensure that electric vehicle copper demand growth extends over decades rather than years. Commercial vehicle fleets typically operate 10-15 years, meaning electrification benefits accumulate gradually as conventional vehicles retire.
How Do Mine Development Timelines Create Structural Supply Constraints?
Copper supply responsiveness to price signals operates on fundamentally different timeframes than demand growth, creating persistent structural imbalances. Mine development represents one of the longest industrial processes, requiring coordination across multiple decades and involving geological, technical, and regulatory complexities that resist acceleration.
17-Year Development Cycle Breakdown from Discovery to Production
New copper mines require approximately 17 years from initial discovery to commercial production, representing one of the longest development cycles in industrial commodity production. This timeline creates inevitable supply shortages when demand growth accelerates faster than historical trends, particularly relevant given current global copper supply forecast challenges.
Discovery and early exploration typically consume 3-5 years as companies define mineralisation extent and conduct preliminary economic assessments. Resource drilling programmes can require 50,000-100,000 metres of drilling to establish resource confidence levels suitable for feasibility studies.
Feasibility study completion requires 2-3 years for definitive feasibility studies that establish final project economics, engineering designs, and environmental impact assessments. These studies often cost $20-50 million for major copper projects.
Permitting and regulatory approval processes extend 3-5 years in most jurisdictions, with environmental assessments, community consultations, and government approvals creating significant timeline uncertainty. Some jurisdictions require 7-10 years for complete permitting processes.
Construction and commissioning phases require 3-4 years for major copper mines, with additional time needed for ramp-up to full production capacity. Complex metallurgical processes and infrastructure development cannot be meaningfully accelerated without compromising operational reliability.
Declining Ore Grade Trends and Capital Intensity Implications
Global copper ore grades have declined approximately 40% since 1991, requiring increasingly capital-intensive mining and processing methods to maintain production levels. Lower grades necessitate moving larger quantities of rock and waste material to produce equivalent copper output.
Processing requirements increase exponentially as ore grades decline. Concentrator facilities must handle larger tonnages of ore to produce similar quantities of copper concentrate, requiring larger equipment, higher energy consumption, and more extensive infrastructure.
In addition, water requirements increase significantly with lower ore grades, as flotation and other beneficiation processes require more water per pound of copper recovered. Water scarcity in many mining regions compounds these challenges and increases project development costs.
Waste management becomes increasingly challenging as ore grades decline. Lower-grade ores generate larger quantities of tailings and waste rock per unit of copper produced, requiring more extensive environmental management systems and larger containment facilities.
Discovery Rate Analysis: New Deposit Identification Challenges
Copper discovery rates have declined significantly over recent decades, with fewer than 5% of deposits identified in the past 35 years discovered within the last decade. This trend suggests that easily identifiable copper resources have been largely exhausted in accessible locations.
Exploration depths continue increasing as surface and near-surface deposits become depleted. Deeper exploration requires more sophisticated and expensive techniques, with drilling costs increasing exponentially with depth in many geological environments.
Furthermore, remote location challenges affect many newer copper discoveries, as more accessible deposits have been previously developed. Remote projects require extensive infrastructure development including roads, power supplies, and processing facilities that add billions of dollars to development costs.
Geopolitical considerations increasingly constrain exploration activities in some copper-rich regions. Political instability, regulatory uncertainty, and resource nationalism limit exploration access in countries with substantial geological potential but challenging operating environments.
Which Jurisdictional Factors Determine Project Viability in Today's Market?
Mining jurisdiction selection has become increasingly critical for copper project development success, as regulatory frameworks, infrastructure availability, and political stability significantly influence both development timelines and capital requirements. Established mining regions offer substantial advantages that often outweigh higher labour costs or tax rates, particularly relevant for copper‑uranium investments.
Infrastructure Access and Capital Efficiency Metrics
Established mining jurisdictions provide infrastructure advantages that dramatically reduce project capital requirements. Chile's Atacama Desert hosts extensive power transmission networks, water pipelines, and transportation systems that serve multiple mining operations, allowing new projects to connect to existing infrastructure rather than developing greenfield systems.
Power supply availability represents a critical factor in copper project economics. Regions with established electrical grids and competitive power pricing provide immediate advantages over locations requiring dedicated power generation facilities. Industrial electricity rates vary from $0.08-0.12 per kWh in established mining regions compared to $0.15-0.25 per kWh in remote locations requiring dedicated generation.
Transportation infrastructure dramatically affects operating cost structures. Projects located within 100 kilometres of existing ports or rail connections typically demonstrate 15-25% lower cash costs than those requiring dedicated transportation infrastructure development.
However, skilled labour availability in established mining regions reduces both construction and operational risks. Regions with existing mining operations maintain pools of experienced miners, engineers, and contractors familiar with local conditions and regulations.
Regulatory Framework Comparison Across Mining Jurisdictions
Permitting timeline predictability varies dramatically across mining jurisdictions, with established mining regions typically offering more streamlined processes. Chile, Peru, and certain Canadian provinces provide relatively predictable permitting timelines of 2-4 years compared to 7-10 years in some frontier jurisdictions.
Environmental regulatory frameworks in established mining regions often provide clearer guidelines and precedent decisions that reduce permitting uncertainty. Regulatory agencies in these regions have experience with mining projects and established procedures for environmental assessment and approval.
Moreover, taxation and royalty structures affect project economics but often matter less than regulatory certainty and infrastructure access. Stable fiscal regimes with predictable tax treatment allow accurate economic modelling even when absolute tax rates are higher than in less stable jurisdictions.
Legal system reliability provides crucial protection for mining investments that require decades to generate returns. Common law jurisdictions with established mining law precedents generally offer superior investment protection compared to civil law systems with limited mining law development.
Labour Market Availability in Established Copper Regions
Skilled mining labour availability creates significant competitive advantages in established copper producing regions. Chile's northern regions maintain experienced workforces capable of operating complex mining equipment and processing facilities without extensive retraining programmes.
Labour productivity metrics consistently favour established mining regions where workers have experience with modern mining methods and safety protocols. Productivity differences can amount to 20-30% higher output per worker in experienced mining regions compared to areas without established mining cultures.
Furthermore, training and safety infrastructure exists in established mining regions, reducing project development and operational costs. Mining schools, safety training facilities, and equipment service providers concentrate in major mining regions, providing essential support services.
Union relationships and labour relations frameworks tend to be more mature and predictable in established mining regions. Long-standing labour agreements and established negotiation processes reduce operational disruption risks compared to regions without mining labour relations experience.
The next major ASX story will hit our subscribers first
How Do Project Economics Drive Investment Allocation in Copper Development?
Copper project investment decisions increasingly focus on capital efficiency and return metrics rather than absolute resource size or grade. Market conditions favour projects that can demonstrate robust economics, manageable capital requirements, and clear pathways to production within reasonable timeframes.
NPV and IRR Benchmarking for Development-Stage Projects
Internal rate of return benchmarks for copper projects typically exceed 25% in current market conditions, reflecting both the attractive long-term copper outlook and the capital intensity required for mine development. Projects demonstrating IRRs above 35% often attract premium valuations and easier financing access.
Net present value calculations increasingly emphasise sensitivity analysis across multiple copper price scenarios. Projects maintaining positive NPVs at $10,000 per tonne copper prices generally demonstrate sufficient robustness for development financing consideration.
In addition, capital payback periods have become critical investment criteria, with preferred projects demonstrating payback periods under 4-5 years from production commencement. Shorter payback periods reduce exposure to commodity price volatility and political risks over extended time horizons.
All-in sustaining cost positioning affects project competitiveness throughout commodity cycles. Projects demonstrating AISC in the bottom quartile of the cost curve (typically under $6,000 per tonne) maintain profitability even during price downturns and generate superior cash flows during price upturns.
Heap-Leach Processing Advantages in Current Market Conditions
Heap leach processing offers significant advantages in current copper market conditions, particularly given the treatment charge collapse affecting concentrate-dependent projects. Oxide copper deposits suitable for heap leaching can bypass concentrate markets entirely, producing copper cathodes directly.
Capital intensity for heap leach operations typically runs 40-60% lower than conventional concentrator and smelting operations. This capital efficiency reduces financing requirements and accelerates investment returns, making projects more attractive to development capital.
Furthermore, operating cost structures for heap leach operations often demonstrate superior margins in current market conditions. Direct cash costs typically range $4,000-6,000 per tonne compared to $5,500-8,000 per tonne for concentrate production when including treatment charges.
Processing flexibility advantages emerge during market disruptions. Heap leach operations can adjust production rates relatively easily compared to complex concentrator operations, allowing better response to copper price volatility and market conditions.
Environmental footprint considerations often favour heap leach operations, which typically require smaller processing facilities and generate less complex waste streams than conventional copper concentrators and flotation circuits.
Environmental Approval Timelines and Permitting Risk Assessment
Environmental permitting represents the highest risk factor in copper project development, with approval timelines varying from 18 months to over 10 years depending on jurisdiction and project complexity. Projects in established mining regions with precedent environmental approvals typically achieve faster permitting.
Water resource availability and permitting increasingly affects project viability in arid copper-producing regions. Projects demonstrating sustainable water supply solutions or innovative water conservation technologies achieve faster environmental approvals and reduced operational risk.
Moreover, community engagement effectiveness significantly influences environmental permitting success rates. Projects demonstrating meaningful community benefit sharing and local employment creation typically receive superior community support during environmental review processes.
Cumulative environmental impact assessments become increasingly complex in regions with multiple existing mining operations. Projects in heavily mined areas may face additional scrutiny regarding incremental environmental impacts despite individual project compliance.
What Role Does Exploration Play in Addressing Future Supply Deficits?
Copper exploration activities directly address long-term supply adequacy by identifying and delineating new resources that can potentially become future mines. Current exploration spending levels appear inadequate relative to projected supply deficits, creating investment opportunities in companies advancing high-potential exploration programmes, particularly those focused on gold‑copper exploration insights.
District-Scale Discovery Potential in Established Mining Belts
Major copper discoveries increasingly occur within established mining districts where geological understanding, infrastructure access, and regulatory familiarity provide exploration advantages. Chile's Antofagasta region, Peru's central highlands, and Arizona's copper districts continue yielding significant discoveries adjacent to existing operations.
Geological continuity in established copper belts suggests that major deposits often occur in clusters or along structural trends that extend beyond currently producing mines. Systematic exploration along these trends offers potential for discovering additional resources with shared infrastructure and processing capabilities.
Furthermore, infrastructure leverage opportunities exist when exploration companies identify resources near existing mining operations. Shared processing facilities, power supplies, and transportation systems can dramatically improve project economics for satellite deposits or district-scale discoveries.
Brownfield exploration advantages include reduced exploration costs, established geological databases, and proven metallurgical characteristics. Companies exploring within established mining districts can leverage decades of previous geological work and operational experience.
Polymetallic Systems and By-Product Revenue Optimisation
Copper deposits increasingly contain significant quantities of gold, silver, molybdenum, and other metals that provide important by-product revenue. These polymetallic systems often demonstrate superior project economics compared to copper-only deposits, particularly during periods of elevated precious metal prices.
Revenue diversification through by-product metals reduces copper price sensitivity and provides natural hedging against commodity price volatility. Projects generating 20-30% of revenues from by-products maintain profitability across wider copper price ranges than copper-dependent operations.
However, processing complexity often increases with polymetallic deposits, but technological advances in metallurgy and mineral processing increasingly allow economic recovery of multiple metals from single operations. Advanced flotation circuits and hydrometallurgical processing enable comprehensive metal recovery.
Resource estimation challenges in polymetallic systems require sophisticated geological modelling and metallurgical testing to optimise recovery processes. Companies demonstrating expertise in complex metallurgy often achieve superior resource recovery and project economics.
Resource Growth Trajectories in VMS Deposit Types
Volcanogenic massive sulfide deposits represent important exploration targets for polymetallic copper-gold-silver resources. These deposit types often demonstrate significant resource expansion potential through systematic exploration and advanced geological modelling techniques.
VMS deposits typically occur in clusters within volcanic sequences, suggesting that individual discoveries may represent portions of larger mineral systems. Systematic exploration programmes can identify multiple deposits within single districts or geological formations.
In addition, grade characteristics in VMS deposits often exceed those of porphyry copper systems, providing attractive project economics despite typically smaller tonnages. Higher-grade deposits require less mining and processing infrastructure to generate equivalent metal production.
Metallurgical characteristics of VMS deposits typically favour conventional processing methods with established technology and predictable recovery rates. This metallurgical simplicity reduces technical risk and allows accurate economic modelling during feasibility studies.
How Should Investors Navigate Copper Market Volatility and Financing Cycles?
Copper market investment requires understanding both short-term volatility patterns and longer-term structural trends that operate on different timeframes. Successful navigation typically involves portfolio diversification across development stages, geographic regions, and company types while maintaining focus on fundamental supply-demand dynamics, particularly considering current copper market pressures from trade tensions.
Junior Mining Equity Valuation Metrics During Price Cycles
Junior mining company valuations demonstrate extreme sensitivity to underlying copper prices, often exhibiting leverage ratios of 3-5 times copper price movements. This leverage creates both opportunity and risk that requires careful timing and risk management.
Enterprise value per pound of contained copper provides a key valuation metric for comparing development-stage projects. Typical valuations range from $0.15-0.40 per pound of contained copper depending on project economics, development stage, and market conditions.
Furthermore, price-to-net asset value ratios fluctuate dramatically during commodity cycles, with junior miners trading at 0.3-0.8 times NAV during pessimistic periods and 1.5-3.0 times NAV during optimistic periods. These variations create substantial arbitrage opportunities for disciplined investors.
Resource grade and tonnage metrics significantly influence valuation multiples, with higher-grade deposits typically commanding premium valuations. Projects containing more than 1% copper equivalent often trade at 20-40% higher multiples than lower-grade alternatives.
Capital Raising Patterns and Dilution Risk Management
Junior mining companies typically raise capital in multiple rounds throughout development cycles, creating ongoing dilution risks for existing shareholders. Understanding financing patterns helps investors time investments and minimise dilution exposure.
Development-stage companies often require $100-500 million in project financing before reaching production, typically raised through combinations of equity, debt, and strategic partnerships. Early-stage investors face substantial dilution if they don't participate in subsequent financing rounds.
However, market timing significantly affects financing terms, with companies raising capital during favourable market conditions obtaining better terms and less dilution. Copper price cycles create windows of favourable financing that companies must navigate carefully.
Strategic partnership opportunities often provide alternative financing sources that reduce dilution compared to pure equity raises. Joint ventures, offtake agreements, and streaming deals can provide development capital while maintaining shareholder value.
Portfolio Diversification Across Development Stages
Balanced copper investment portfolios typically include exposure across exploration, development, and production stages to optimise risk-return profiles. Different development stages respond differently to market conditions and commodity price cycles.
-
Exploration-stage companies offer maximum leverage to copper price increases but carry highest execution risk. These investments require careful due diligence regarding management experience, geological potential, and financial sustainability.
-
Development-stage companies provide moderate leverage with reduced geological risk but significant financing and construction risks. Projects with completed feasibility studies and environmental approvals typically offer optimal risk-return profiles.
-
Production-stage companies offer immediate copper price exposure with operational cash flows but limited growth potential. These investments provide portfolio stability and dividend potential during volatile market conditions.
-
Royalty and streaming companies offer copper exposure with reduced operational risk and diversified asset bases. These companies provide defensive characteristics while maintaining commodity price leverage.
What Investment Thesis Supports Copper's Strategic Metal Status?
Copper's designation as a strategic metal reflects its essential role in global energy transition and infrastructure development. This strategic importance creates investment opportunities based on structural supply-demand imbalances that transcend normal commodity cycles and justify premium valuations for copper-exposed investments, particularly relevant for understanding US‑China copper trade tensions.
Energy Transition Metal Demand Forecasting Models
Energy transition scenarios consistently project copper demand growth exceeding historical consumption patterns. International Energy Agency forecasts suggest copper demand could increase 70-100% by 2040 under aggressive electrification scenarios, representing unprecedented growth rates for major industrial metals.
Electric vehicle adoption represents the most significant single demand driver, with global EV sales potentially reaching 50-60 million units annually by 2030. Each vehicle requiring 2-3 times more copper than conventional alternatives creates massive incremental demand beyond existing consumption patterns.
Moreover, renewable energy infrastructure requirements compound electric vehicle demand growth. Wind and solar installations require 3-5 times more copper per megawatt than conventional power generation, while grid modernisation for renewable integration creates additional copper intensity.
Energy storage deployment amplifies copper requirements across electrical systems. Battery storage facilities require extensive copper wiring and power conditioning equipment, while grid-scale storage systems create entirely new categories of copper demand.
Supply Deficit Projections Through 2035
Multiple forecasting models project significant copper supply deficits emerging over the next decade despite current temporary inventory surpluses. These structural deficits reflect the fundamental mismatch between rapid demand growth and constrained supply response capabilities.
Wood Mackenzie projects cumulative supply deficits approaching 15-20 million tonnes by 2035 under base case scenarios, with more aggressive electrification assumptions producing even larger gaps. These deficits would require massive mining capacity additions beyond currently planned projects.
Furthermore, mine depletion rates accelerate supply constraints as existing operations face declining grades and reserve exhaustion. Approximately 40% of current copper production comes from mines over 40 years old, suggesting substantial replacement requirements over the next two decades.
New mine development faces increasing challenges from environmental permitting, community relations, and capital intensity requirements. These obstacles extend development timelines and increase project costs, reducing supply responsiveness to price signals.
Recycling contributions cannot fill projected supply gaps despite technological advances in copper recovery. Secondary copper production typically represents 15-20% of total supply and cannot scale sufficiently to address projected primary supply shortfalls.
Strategic Positioning for Infrastructure Buildout Requirements
Infrastructure investment requirements over the next two decades create unprecedented copper demand that extends far beyond historical consumption patterns. Government infrastructure programmes worldwide increasingly focus on electrification and renewable energy projects that are highly copper-intensive.
Grid modernisation initiatives require massive copper investments as electrical systems upgrade to handle renewable energy integration and electric vehicle charging loads. Smart grid technologies increase copper intensity by 30-40% compared to conventional electrical infrastructure.
In addition, 5G telecommunications infrastructure deployment creates additional copper demand through expanded fiber optic networks and cellular infrastructure. Each 5G installation requires substantially more copper than previous generation wireless technologies.
Industrial automation and artificial intelligence applications increase copper intensity across manufacturing and processing facilities. Smart factories and automated production systems require extensive electrical infrastructure and power conditioning equipment.
Investment Disclaimer: This analysis contains forward-looking projections and speculative elements regarding future copper market conditions, supply-demand balances, and mining project developments. Commodity investments carry substantial risks including price volatility, operational failures, regulatory changes, and macroeconomic factors that can significantly impact returns. Past performance does not guarantee future results. Investors should conduct thorough due diligence and consider professional advice before making investment decisions.
Could Copper Investment Opportunities Be Hidden in Plain Sight During This Market Rebalancing?
Despite current inventory accumulation and temporary market softness, Discovery Alert's proprietary Discovery IQ model continues identifying significant copper discoveries across Australian markets, recognising that structural supply constraints and electrification trends remain fundamentally intact. These cyclical rebalancing periods often present optimal entry points for investors seeking exposure to copper's strategic importance in the global energy transition, making Discovery Alert's instant mineral discovery alerts particularly valuable for capturing market-leading opportunities as conditions normalise.