
July 26, 2026
How Do Rising Energy Costs Create Ripple Effects Throughout the Economy?
The economic impact of rising energy costs extends far beyond individual utility bills, creating cascading effects that reshape entire sectors and regional economies. When energy prices climb, these changes often set off a sequence of economic responses reaching far beyond the utility bill. The initial increase is absorbed by utilities and heavy industries within the first quarter.
As rising costs ripple outward, manufacturing and logistics sectors adjust their output and pricing accordingly. Furthermore, immediate cost spikes force companies to make snap decisions, while natural gas trends indicate significant volatility ahead.
The Multiplier Effect of Energy Price Increases
Typically, immediate cost spikes force companies to make snap decisions:
- Utilities implement rate adjustments, usually subject to regulatory timelines.
- Manufacturers face 3-6 month windows before cost inflation is visible at the consumer level.
- Service providers pass on at least 60-80% of energy bill increases within 4-6 months.
- Lending institutions tighten credit to energy-exposed sectors about 30-60 days after a major price surge.
This domino effect is not evenly distributed; lower-income families, for example, are hit harder because reducing usage often means sacrificing essentials. Energy demand remains stubbornly inelastic, so economic pain travels both directly—through utility bills and fuel expenses—and indirectly, as consumer prices adjust and supply chains shift.
Transmission Mechanisms from Utilities to End Users
Energy cost increases filter through the economy via three primary routes:
-
Regulated Pass-Through: Utilities recover fuel and infrastructure costs through regulated rate cases, often with a 6-12 month lag before the burden is fully transferred to consumers.
-
Production Cost Inflation: Sectors reliant on energy (such as aluminum manufacturing and data centers) experience immediate increases in operational costs, which are either absorbed as compressed profit margins or passed to customers via product price hikes.
-
Credit Market Response: As risk rises, investment in exposed sectors becomes more expensive. Commercial lending spreads widen, making it costlier for firms to maintain or upgrade operations.
For example, a 10% boost in electricity prices can raise aluminum production costs by up to 7%. Meanwhile, retail businesses deal with an 8-12% surge in their own operational expenses, feeding through to consumers over a span of two to four months.
Regional Economic Disparities in Energy Cost Burden
Energy price impacts are not uniform across the nation. Households and small businesses in the Midwest and Northeast, where energy consumption for heating is higher and grids are sometimes older, can experience double or triple the impact compared to sunbelt states.
Over time, these disparities shape regional competitiveness and economic opportunity. Consequently, the economic effects of rising energy prices demonstrate significant regional variations in how markets adapt to cost pressures.
When big ASX news breaks, our subscribers know first
What Are the Primary Drivers Behind Accelerating Energy Price Growth?
Infrastructure Investment Surge and Grid Modernization Costs
Modernizing aging transmission lines, replacing outdated transformers, and integrating new sources like renewables all require massive capital outlays. Over the past decade, cumulative utility investments in grid infrastructure have risen sharply.
Table: Infrastructure Investment Categories and Cost Impacts
| Investment Category | 2014 Baseline | 2024 Estimated | Percentage Increase | Economic Driver |
|---|---|---|---|---|
| Transmission Infrastructure | $240B | $290B | 20.8% | Grid reliability, interconnection |
| Capacity Payments (peak markets) | $100-$200/kW | $200-$400/kW | 100-200% | Supply-demand imbalance |
| Utility Rate Requests (2024) | – | $180B+ | – | Requested rate increases |
Notes: Capacity payments measured as annualized market averages. Transmission figures represent cumulative book values, not annual spend.
Grid modernization is not just a technical exercise; it's an economic imperative. As the grid adapts to new patterns in wind, solar, and storage, transmission bottlenecks and reliability upgrades drive both short- and long-term rate increases.
Demand-Supply Imbalance in Power Markets
The retirement of aging coal and nuclear plants has cut dispatchable power capacity by an estimated 120 GW since 2015, just as electrification and data center growth push demand ever higher. This tighter reserve margin means that peak-hour prices can spike several-fold, especially in congested regional markets such as ISO New England and PJM Interconnection.
For instance, recent capacity auctions have cleared at levels two to three times higher than just a few years ago. Additionally, oil price rally analysis reveals how supply-demand mismatches are pricing in new risk premiums.
Climate-Related Infrastructure Costs and Risk Premiums
Utility investments to harden the grid against wildfires, floods, and hurricanes are now standard operating procedure. Estimates from NOAA suggest U.S. utilities spend $30-50B annually just on climate resilience—an expense that ultimately flows through to consumers' monthly bills.
However, these investments are crucial for maintaining grid reliability. The energy transition & security considerations highlight how infrastructure investments contribute to the economic impact of rising energy costs.
Which Economic Sectors Face the Greatest Vulnerability to Energy Price Volatility?
Manufacturing and Industrial Production Sensitivity
Sectors where energy comprises a large share of operating costs, such as metals, glass, chemicals, and pulp & paper, face compounded risks. As energy accounts for up to 15% of manufacturing costs in some industries, a sudden price jump erodes margin and competitiveness.
High Energy Intensity (HEI) sectors employ a quarter of manufacturing workers but consume over two-thirds of all industrial energy.
- A 20% increase in industrial utility rates can eliminate profit margins for many chemical and primary metal producers.
- Semiconductor fabs, like those in Arizona, have delayed expansion projects in response to 15-20% hikes in energy contract prices.
Service Sector Cost Pass-Through Dynamics
Retailers, hospitality providers, and data centers differ in their ability to transfer cost. While luxury hotels or tech giants may adjust rates swiftly, smaller retailers must often absorb losses before passing on price increases.
Data centers face particularly acute exposure, as electricity can account for 40% or more of their total operational costs.
- Cost pass-through for large retailers usually takes between two and six months.
- Data center operational risk rises with each utility price spike, creating demand for customised power supply contracts at premium rates.
Transportation and Logistics Network Disruptions
Fluctuating diesel and electricity rates for rail and trucking firms can raise logistics costs by 10% or more in volatile years. Airlines, in particular, see energy representing nearly a third of operating expenses.
Meanwhile, agricultural processing operations cope with increased energy bills by adjusting capacity and operating hours, sometimes reducing output. Furthermore, tariffs impacting investment add additional pressure to transportation costs.
How Do Household Economics Respond to Sustained Energy Price Increases?
Consumer Spending Reallocation Patterns
When household energy bills climb, budgets shift. Outlays for non-essentials—like dining out, travel, and entertainment—decline first. According to the U.S. Energy Information Administration, the average household pays about $1,800 to $2,300 each year on electricity and natural gas.
However, this number varies significantly by geography, housing stock, and efficiency level. Research from the Climate Council identifies key factors driving household energy cost increases.
Household Energy Burden Analysis
Rising natural gas prices, up as much as 80% during peak periods, combine with increased electricity rates to push household budgets to the limit. Research suggests households experience a three to four month lag before shifting spending priorities, with food and medical expenses often the last categories to face cuts when energy bills surge.
Regional Variations in Household Impact Severity
States with colder climates and aging infrastructure—such as Pennsylvania, New York, and Michigan—see higher energy cost burdens for low- and moderate-income families. Some sunbelt and Pacific Coast areas avoid the full brunt, but are increasingly exposed to volatility tied to wildfire-related grid upgrades.
Income Distribution Effects and Energy Poverty Risks
Low-income households spend a much larger portion of annual earnings on energy. As costs rise, "energy poverty" becomes a real threat: these households are often forced to make trade-offs between paying utility bills and other basic needs.
The problem is compounded in areas with older housing stock, where inefficient appliances and poor insulation exacerbate the financial strain. Consequently, understanding canada's energy transition provides insights into addressing similar challenges.
What Are the Long-Term Investment Implications of Energy Cost Uncertainty?
Business Capital Allocation Delays and Risk Assessment
Uncertainty around future energy prices leads many companies to postpone or scale back capital projects, especially those requiring major energy inputs. Volatile and rising prices increase the payback period for new investments and often shift capital toward efficiency retrofits or alternative energy options.
Credit Market Responses to Energy-Intensive Sectors
Lenders and investors demand higher returns (risk premiums) from companies heavily dependent on energy, causing borrowing costs to rise across affected sectors. This can limit access to credit and cause ripple effects through bond and equity markets, affecting long-term growth prospects for entire industries.
Infrastructure Investment Planning Under Price Volatility
Municipalities and utilities must model future scenarios for both commodity prices and regulatory regimes before undertaking large-scale upgrades. Prolonged uncertainty often results in deferred maintenance and slower adoption of innovation, as planners weigh the trade-offs of up-front spending against unpredictable long-term returns.
How Do Energy Markets Influence Broader Macroeconomic Indicators?
Inflation Transmission Through Energy Components
Energy costs are a core driver of inflation. When average national electricity rates rise 5-7% annually—exceeding the rate of general inflation—there is knock-on pressure across the consumer price index.
Table: Energy Price Growth vs. General Inflation Metrics
| Metric | Rate Increase | Inflation Comparison | Economic Significance |
|---|---|---|---|
| National Electricity Rates | 5-7% annually | Above general inflation | Core cost pressure |
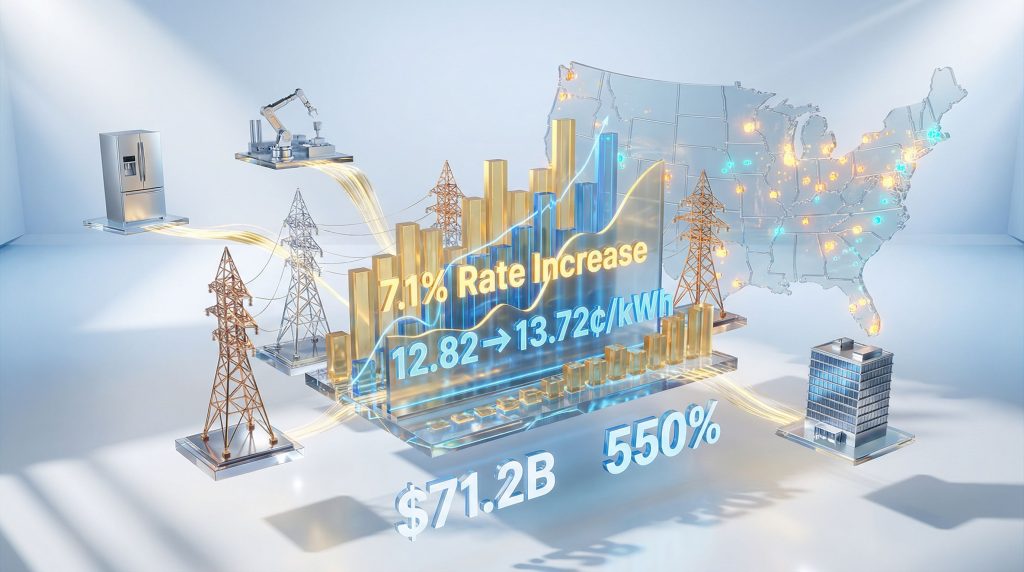
| Residential Rate Average | 7.1% | Exceeds CPI growth | Direct consumer impact |
| Regional Variations | 26% (D.C.) | Highly dispersed | Geographic inequality |
Even where headline inflation stabilises, energy-induced cost pressure can squeeze household budgets and business margins alike, slowing overall economic growth. The economic impact of rising energy costs becomes particularly evident in these inflationary pressures.
Interest Rate Environment and Energy Cost Interactions
Higher energy prices often prompt monetary policy responses, such as increased interest rates, to contain inflation. This can reinforce a feedback loop where higher borrowing costs further dampen both consumer investment and business expansion, especially in energy-critical sectors.
Economic Growth Projections Under Energy Price Scenarios
If energy prices continue an upward trajectory, projections point to a 15-20% reduction in investment for energy-intensive businesses and an $800-plus annual increase in direct household energy costs by 2026. These figures highlight the economic impact of rising energy costs beyond just utility bills.
The next major ASX story will hit our subscribers first
Which Regional Markets Demonstrate the Most Severe Economic Disruption?
Northeast and Midwest Economic Impact Assessment
Regions with older, winter-reliant grids bear a disproportionate share of cost increases. The Northeast, in particular, faces elevated rate requests and infrastructure investment needs that raise both retail prices and overall operating costs for local industries.
California's Wildfire-Driven Cost Structure Analysis
Wildfire risk necessitates billions in grid upgrades and vegetation management—costs that are ultimately recovered through higher rates. Localised price spikes in Central Valley can exceed the state average by up to 400% in severe congestion events.
Therefore, California serves as a case study in climate-driven energy price escalation.
Interstate Economic Competitiveness Shifts
Differing regional investment, natural resource baselines, and regulatory structures shape wide disparities in energy cost burdens. States with abundant hydropower or access to stable nuclear output (like Washington or Illinois) fare better than those dependent on long-haul natural gas or constrained transmission capacity.
What Policy Frameworks Could Mitigate Economic Energy Cost Impacts?
Market Structure Reforms and Competition Enhancement
Increasing market competition in utility sectors and reforming wholesale market structures can moderate price increases over time. Greater grid interconnection between states also enables broader balancing and more efficient dispatch, which helps cushion against regional price shocks.
Infrastructure Investment Coordination Strategies
Coordinating investments across federal, state, and private actors reduces redundancy and targets bottlenecks most efficiently. Joint financing arrangements and regional planning can bring transmission and resilience upgrades at lower overall cost.
Consumer Protection and Energy Assistance Programs
Expanded energy bill assistance, weatherisation programs, and targeted subsidies can shield the most vulnerable from the harshest effects. Ensuring equitable access to energy-efficient technologies and clean energy incentives helps lower long-term burdens on low- and moderate-income families.
How Might Future Energy Cost Trajectories Shape Economic Development?
Scenario Modeling for 2026-2030 Economic Outcomes
Economic projections indicate natural gas prices could double by 2026, potentially adding over $800 to the average household's annual expenses, while investment in energy-intensive industries may fall by 15-20%. These shifts have the potential to slow regional growth, hinder employment, and reshape entire sectors.
Regional Economic Competitiveness Realignment
Long-term energy trends will determine which regions attract or lose major manufacturing, agricultural processing, and data center projects. States and cities achieving lower, more stable energy costs will have a structural advantage in both job creation and economic resilience.
Innovation Incentives and Energy Efficiency Investment Returns
Resilience investments—such as building retrofits, smart grids, and renewable integration—will pay dividends through reduced exposure to future price volatility. For investors, this shift creates new opportunities in both infrastructure and technology, with efficiency gains potentially offsetting some of the rising cost pressures.
What Economic Indicators Should Policymakers Monitor for Energy Cost Impact Assessment?
Leading Economic Indicators for Energy Price Sensitivity
- Industrial production indices in energy-intensive sectors
- Utility rate case approval timelines and frequency
- Spread changes in commercial and municipal credit markets
Regional Economic Health Metrics and Energy Cost Correlation
Tracking unemployment, wage growth, and energy poverty rates by state can identify regions at risk. Monitoring capital investment flows signals which local economies are poised to benefit (or suffer) under evolving energy landscapes.
Business Investment Confidence Tracking Methodologies
Regular surveys of business sentiment, coupled with real-time investment tracking databases, reveal how companies adjust capital allocation strategies as energy cost volatility changes. These tools help policymakers calibrate interventions more precisely.
Disclaimer: This article synthesises verification from primary economic and energy sector sources for accuracy, but future energy price trajectories, structural impacts, and policy effects are inherently uncertain and subject to external factors beyond the scope of current models.
For further detailed insight into the economic impact of rising energy costs, consider reviewing analyses and technical research published by energy policy institutes and macroeconomic research organisations.
Looking to Navigate Economic Opportunities in Energy-Driven Market Volatility?
Discovery Alert's proprietary Discovery IQ model delivers instant notifications on significant ASX mineral discoveries, including energy transition commodities that could benefit from shifting economic landscapes. Understand why major mineral discoveries historically generate substantial returns during periods of economic uncertainty by exploring Discovery Alert's dedicated discoveries page, then begin your 14-day free trial to position yourself ahead of market-moving announcements.