
June 6, 2026
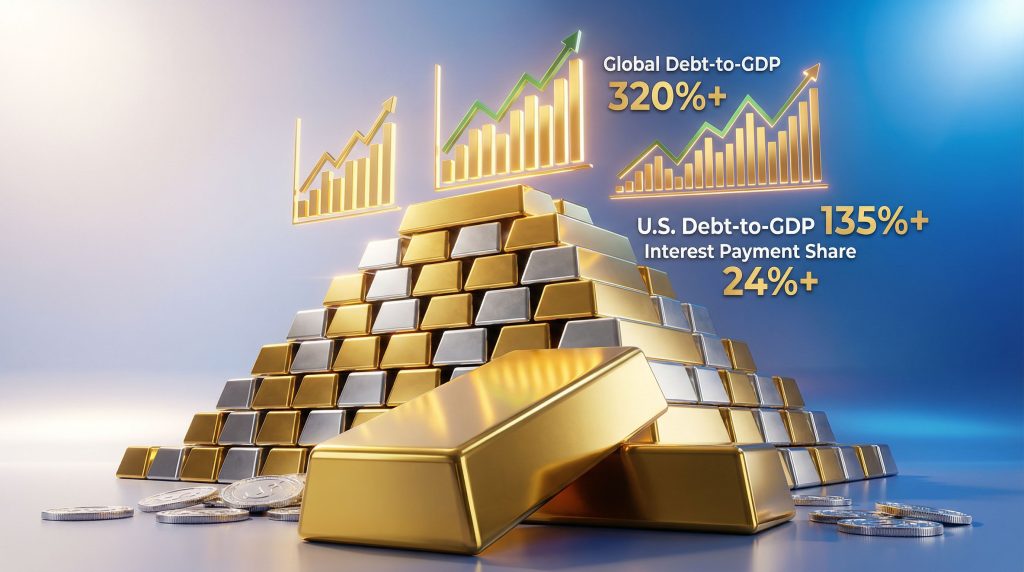
Rising government debt has reached unprecedented levels globally, with total worldwide debt now exceeding 320% of GDP compared to approximately 165% at the turn of the century. This structural transformation represents far more than a temporary policy response; it signals a fundamental shift in how monetary systems operate and where capital preservation strategies must evolve, particularly regarding gold prices record highs and precious metals allocation.
The mathematical reality of debt service costs consuming ever-larger shares of government revenue creates a narrow corridor of viable policy responses. Furthermore, when interest payments approach or exceed 24% of federal budgets, as projected for major economies by 2025-2026, traditional fiscal discipline becomes politically and economically impractical.
What Makes Rising Government Debt a Catalyst for Precious Metals Investment?
The relationship between sovereign fiscal health and precious metals performance operates through multiple interconnected economic mechanisms that extend far beyond simple inflation hedging. Unlike traditional asset classes tied to government creditworthiness, gold and silver represent finite resources constrained by geological availability rather than policy decisions.
The Confidence Erosion Framework
When debt-to-GDP ratios exceed historical sustainability thresholds, investor confidence in government fiscal discipline begins deteriorating systematically. This erosion manifests through several measurable channels:
• Currency debasement expectations driven by monetary expansion requirements
• Real yield suppression as governments maintain artificially low interest rates
• International reserve diversification by foreign central banks and institutional investors
• Inflation risk premiums embedded in long-term asset pricing
The U.S. national debt currently stands at approximately $36 trillion, representing a debt-to-GDP ratio exceeding 135%. This level surpasses the 90-100% threshold that economic literature identifies as historically associated with reduced growth and increased fiscal strain.
Currency Debasement Mechanics
Rising government debt gold silver dynamics force monetary authorities into a narrow corridor of policy responses, with monetary expansion historically being the preferred path of least political resistance. This dynamic creates several technical pathways to currency debasement:
Table: Federal Interest Payment Evolution
| Fiscal Year | Interest Payments | % of Federal Revenue | % of GDP |
|---|---|---|---|
| 2010 | $196 billion | 7.1% | 1.2% |
| 2020 | $345 billion | 8.6% | 1.6% |
| 2024 | $659 billion | 13.0% | 2.5% |
| 2026 (est.) | $750+ billion | 15.5% | 2.8% |
Annual gold production approximates 3,000 metric tons globally, while silver production reaches approximately 26,000-27,000 metric tons annually. These supply curves cannot be altered through policy decisions, creating structural asymmetry with fiat currency expansion that can increase monetary aggregates by double-digit percentages annually during crisis periods.
When big ASX news breaks, our subscribers know first
Why Current Global Debt Levels Signal a Structural Shift for Precious Metals
The confluence of 320%+ global debt-to-GDP and declining real yields creates conditions historically associated with precious metals bull markets. However, this threshold differs from earlier warning signs because current debt elevation reflects structural rather than cyclical factors, contributing to the ongoing gold market surge.
The Financial Repression Environment
When debt service costs exceed sustainable levels, governments implement financial repression strategies that systematically favour hard assets over traditional fixed-income investments. Financial repression operates through:
- Interest rate suppression below inflation rates through central bank policy
- Regulatory pressure on institutional investors to hold government bonds
- Capital controls limiting alternative investment access
- Inflation tolerance allowing price increases to erode real debt values
Historical precedents from the post-World War II era (1945-1965) demonstrate how governments maintained nominal rates 3-5% below inflation annually. Consequently, they effectively liquidated debt in real terms while penalising savers holding fixed-income assets.
Central Bank Gold Accumulation Patterns
Official sector purchases have accelerated dramatically, with central banks purchasing approximately 1,037 metric tons of gold in 2023. This marks the highest annual purchases since 1967, according to official sector data. Major accumulation trends include:
• People's Bank of China: ~612 metric tons (2020-2024)
• Central Bank of India: ~269 metric tons (2020-2024)
• Central Bank of Russia: ~194 metric tons (2020-2024)
• Multiple emerging market central banks: Diversifying reserves away from traditional currencies
This institutional recognition signals rising concern about fiscal sustainability across major economies and represents diversification away from traditional fiat currency reserves.
How Do Real Yields Drive Precious Metals Allocation Decisions?
Gold's lack of yield becomes irrelevant when government bonds deliver negative real returns after inflation adjustment. The mathematical relationship between real yields and precious metals performance demonstrates consistent inverse correlation across multiple economic cycles.
The Negative Real Yield Phenomenon
Real yield calculations reveal the economic logic behind precious metals allocation:
Real Yield Impact Framework:
- Positive Real Yields (2-4%): Traditional bonds competitive with gold storage costs
- Near-Zero Real Yields (0-1%): Gold maintains purchasing power advantage
- Negative Real Yields (-1% to -3%): Gold significantly outperforms bonds
- Deeply Negative Real Yields (-3%+): Precious metals enter bull market territory
Table: Real Yield Environment Analysis (2020-2026)
| Period | Nominal 10Y Yield | CPI Inflation | Real Yield | Gold Performance |
|---|---|---|---|---|
| 2020 Q4 | 0.90% | 1.4% | -0.50% | +25.1% |
| 2021 Q4 | 1.51% | 6.8% | -5.29% | +0.2% |
| 2022 Q4 | 3.87% | 6.5% | -2.63% | -11.0% |
| 2024 Q4 | ~4.2% | ~3.5% | +0.7% | +27.0% |
Federal Reserve Policy Constraints
The Federal Reserve faces mathematical constraints on interest rate policy given current debt levels. If rates were normalised to historical averages (5-7%), annual interest payments would approach $2 trillion, representing approximately 40% of total federal revenue.
This constraint creates a form of financial repression where monetary policy must accommodate fiscal needs. Furthermore, it systematically favours real assets over fixed-income investments rather than optimising for price stability.
What Historical Precedents Reveal About Debt-Driven Precious Metals Performance?
Major precious metals bull markets have consistently coincided with periods of fiscal expansion, monetary accommodation, and declining real interest rates. This provides empirical evidence for the debt-precious metals relationship and supports current gold price forecast projections.
The 1970s Fiscal Expansion Case Study
Following the abandonment of gold convertibility in 1971, accelerating government spending and monetary expansion drove gold from $35 to over $800 per ounce within a decade. Key factors included:
• Bretton Woods collapse removing convertibility constraints
• Vietnam War expenditures creating persistent fiscal deficits
• Great Society programmes expanding long-term spending commitments
• Oil price shocks accelerating inflation expectations
The 2020-2025 Stimulus Era Analysis
Unprecedented fiscal and monetary intervention during the pandemic period produced measurable precious metals outperformance:
Performance Data:
• Gold gains: 25.1% in 2020, followed by continued strength through 2025
• Silver surge: 47.9% in 2020, demonstrating amplified sensitivity to monetary expansion
• Federal debt expansion: Over $4 trillion increase in 2020 alone
• M2 money supply growth: Exceeded 25% annually during peak expansion
Why Silver Amplifies Gold's Debt-Driven Performance Characteristics
Silver benefits from both monetary hedge demand during fiscal stress and industrial consumption growth driven by government infrastructure spending. This creates a dual-demand dynamic that often amplifies gold's performance during debt-driven cycles, particularly during a silver market squeeze.
Supply-Demand Imbalance Mechanics
Industrial applications consume approximately 60% of annual silver production, creating structural deficits when investment demand accelerates simultaneously. Key industrial sectors include:
• Solar panel manufacturing (expanding with green energy mandates)
• Electronics production (driven by technological advancement)
• Electric vehicle components (accelerating with transportation electrification)
• Grid infrastructure (essential for renewable energy integration)
Table: Silver's Volatility Advantage During Debt Crises
| Period | Gold Performance | Silver Performance | Silver Premium |
|---|---|---|---|
| 2008-2011 | +168% | +442% | +163% |
| 2019-2020 | +25% | +48% | +92% |
| 2020-2025 | +64% | +146% | +128% |
Government Spending Multiplier Effects
Large-scale government infrastructure spending creates secondary silver demand through:
- Direct procurement for federal projects requiring industrial silver
- Regulatory mandates driving private sector silver consumption
- Subsidy programmes accelerating adoption of silver-intensive technologies
- Defence expenditures utilising silver in military applications
This creates a unique dynamic where rising government debt gold silver relationships simultaneously drive both monetary hedge demand and fundamental industrial consumption.
How Should Investors Position for Continued Debt Expansion?
The structural forces driving government debt expansion suggest positioning strategies should account for persistent rather than cyclical fiscal pressures. Moreover, demographic trends, infrastructure needs, and geopolitical tensions indicate the current trajectory will continue regardless of political changes, particularly given concerns about US inflation and debt.
Portfolio Allocation Frameworks by Risk Profile
Conservative Allocation (5-10% Total Portfolio):
• 70% gold allocation for stability and liquidity
• 30% silver allocation for modest growth enhancement
• Focus on physical ownership through coins and bars
Moderate Allocation (10-15% Total Portfolio):
• 60% gold for foundational precious metals exposure
• 40% silver for enhanced volatility and industrial exposure
• Mix of physical ownership and allocated storage options
Aggressive Allocation (15-20% Total Portfolio):
• 50% gold for balance and liquidity maintenance
• 50% silver for maximum leverage to monetary expansion
• Consider higher-premium collectible coins for additional appreciation potential
Implementation Strategies
Physical ownership through coins, bars, and allocated storage provides direct exposure without counterparty risk inherent in paper alternatives. Key considerations include:
• Storage security for physical holdings
• Liquidity access during market stress periods
• Tax implications varying by jurisdiction and holding period
• Insurance coverage for stored precious metals
The next major ASX story will hit our subscribers first
What Risks Could Disrupt the Debt-Precious Metals Relationship?
While the fundamental debt-precious metals relationship appears structurally sound, several scenarios could temporarily disrupt expected performance patterns. However, market volatility research suggests these disruptions typically prove temporary.
Deflationary Scenario Considerations
Severe economic contraction could temporarily strengthen currency demand despite high debt levels. Historical precedent suggests this effect proves temporary, as governments respond to deflation through aggressive monetary expansion.
The Great Depression provides instructive precedent: initial deflationary pressure gave way to currency devaluation (the 1933 gold revaluation from $20.67 to $35 per ounce) as fiscal policy adapted to economic reality.
Policy Response Variables
Unexpected fiscal discipline or technological productivity gains could theoretically alter debt trajectories. However, current political incentives and demographic realities suggest continued expansion remains the most probable path:
• Ageing populations requiring increased healthcare and pension spending
• Infrastructure decay necessitating massive capital investment
• Geopolitical tensions driving defence expenditure increases
• Climate adaptation costs requiring government coordination and funding
Technology Disruption Possibilities
Breakthrough productivity gains from artificial intelligence or other technologies could theoretically enable economic growth rates sufficient to stabilise debt-to-GDP ratios. However, such scenarios remain speculative and would likely require sustained productivity growth exceeding historical precedents.
Strategic Positioning for the Next Phase of Debt Expansion
Understanding the mathematical constraints facing highly indebted governments enables informed allocation decisions that position portfolios for potential currency debasement. In addition, this approach maintains exposure to traditional growth assets during periods of economic expansion.
The key insight involves recognising that rising government debt gold silver dynamics create structural rather than cyclical pressures favouring assets that maintain purchasing power independent of government fiscal discipline. This environment historically favours precious metals allocation as insurance against monetary system instability.
Market Psychology Considerations:
• Institutional recognition through central bank accumulation
• Retail investor education about fiscal sustainability concerns
• Generational wealth transfer to demographics with different monetary system experience
• Geopolitical fragmentation reducing confidence in reserve currency stability
The convergence of these factors suggests precious metals allocation represents prudent portfolio diversification rather than speculative positioning. Gold and silver offer complementary risk-return profiles suited to different investor objectives and risk tolerances.
Disclaimer: This analysis is for educational purposes only and does not constitute investment advice. Precious metals investing involves risks, and past performance does not guarantee future results. Consult qualified financial professionals before making investment decisions.
Want to Capitalise on the Next Major Mineral Discovery?
Discovery Alert's proprietary Discovery IQ model delivers instant notifications on significant ASX mineral discoveries, empowering investors to identify actionable opportunities ahead of the broader market during periods of precious metals momentum. Begin your 14-day free trial today and position yourself to capture the next breakthrough that could transform your investment portfolio.