
June 12, 2026
The Hidden Architecture Behind Resource Growth: Why Grade Momentum Matters More Than Ounces
In underground gold mining, the relationship between resource confidence and mine economics is rarely linear. Investors tracking headline ounce counts often overlook the more consequential variable: whether those ounces carry enough geological confidence to appear in a mine schedule, and whether the grades underpinning them justify the capital required to extract them. When both dimensions improve simultaneously, the strategic implications extend well beyond a single exploration update.
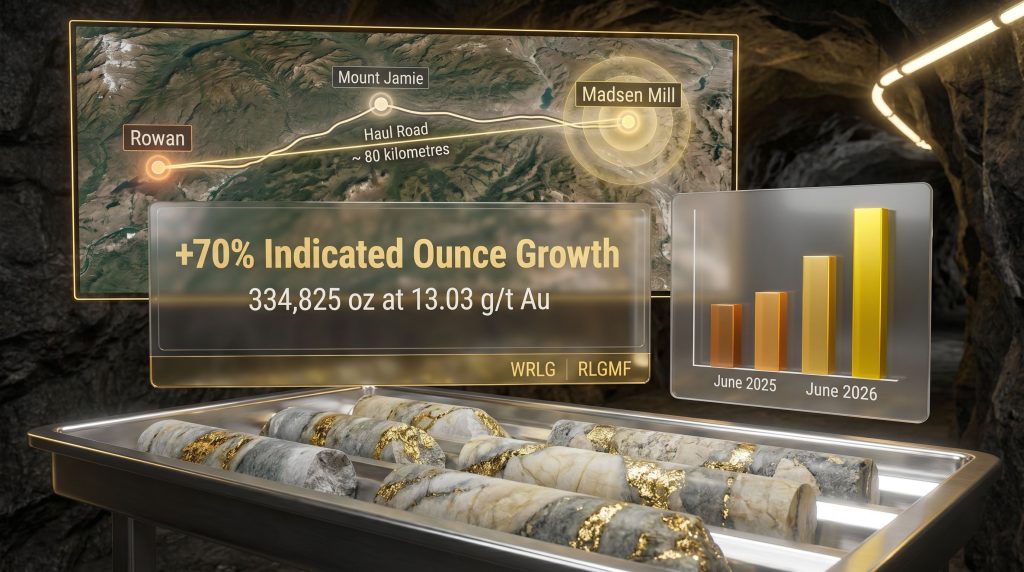
The West Red Lake Gold Mines Rowan resource update released in June 2026 is precisely that kind of dual-improvement event. The 70% growth in indicated ounces to 334,825 ounces grading 13.03 g/t Au is the number that will attract attention. However, the more technically revealing development is the 75% improvement in inferred grade to 15.31 g/t Au, which now sits measurably above the prior indicated average. That grade inversion tells a specific geological story and carries implications for every phase of development that follows.
When big ASX news breaks, our subscribers know first
Understanding the Resource Classification Framework Before Analysing the Numbers
Before examining the Rowan figures in detail, it is worth establishing why the indicated versus inferred distinction carries such practical weight in project economics. Furthermore, understanding interpreting drill results correctly is essential before drawing any conclusions from the data.
Under the CIM Definition Standards referenced by Canada's NI 43-101 reporting framework, mineral resources are stratified by geological confidence:
- Measured resources carry the highest confidence, typically supported by closely spaced drill holes or channel sampling with well-understood geological continuity
- Indicated resources are supported by sufficient drilling density and geological understanding to allow reasonable assumptions about grade and tonnage continuity, making them eligible for inclusion in pre-feasibility and feasibility-level mine plans
- Inferred resources represent lower-confidence estimates where geological continuity is interpreted but not adequately sampled, and they are explicitly excluded from economic mine schedules under NI 43-101 conventions
"Why this matters for investors: A mining company can hold millions of inferred ounces and still be unable to schedule a single tonne of production against them. Only indicated and measured ounces feed into the mine plans that underpin pre-feasibility studies, feasibility studies, and ultimately, project financing decisions."
This classification architecture is why the West Red Lake Gold Mines Rowan resource update carries strategic weight that transcends the headline percentage growth. The company did not simply add ounces; it added schedulable ounces at a higher grade than the prior resource base.
Rowan Resource Comparison: What the Numbers Actually Show
The following table presents the before-and-after picture across both resource categories, using the June 2025 and June 2026 estimates:
| Resource Category | June 2025 Estimate | June 2026 Estimate | Change |
|---|---|---|---|
| Indicated Ounces | 196,747 oz | 334,825 oz | +70% |
| Indicated Grade | 12.78 g/t Au | 13.03 g/t Au | +2% |
| Indicated Tonnes | Not stated | 754,514 t | – |
| Inferred Ounces | 118,155 oz | 179,013 oz | +52% |
| Inferred Grade | 8.73 g/t Au | 15.31 g/t Au | +75% |
| Inferred Tonnes | Not stated | 360,323 t | – |
Three observations stand out from this data set.
First, the indicated grade improved marginally alongside the ounce growth, confirming that the new drilling did not simply add lower-grade peripheral material to inflate tonnage. The resource system expanded while maintaining quality.
Second, and more technically significant, the inferred grade of 15.31 g/t Au now exceeds the prior indicated average of 12.78 g/t Au by approximately 20%. This is an unusual configuration. In most staged deposit programs, inferred material at the fringes of a system tends to grade below the better-drilled indicated core. When the inverse is true, it suggests the highest-grade portions of the mineralised system remain incompletely defined, and that continued drilling is targeting the right geological structures.
Third, the tonnage relationship between inferred ounces and inferred grade is instructive. At 15.31 g/t, the 360,323 inferred tonnes contain 179,013 ounces. At the prior 8.73 g/t, an equivalent ounce count would have required roughly 640,000 tonnes. Fewer tonnes delivering the same gold means lower mining and processing costs per ounce during any future infill conversion program.
What a 75% Inferred Grade Increase Signals Geologically
The grade premium in the inferred category is not simply a statistical artifact. In structurally controlled Archean lode-gold systems, which characterise the Red Lake district, high-grade shoots tend to be spatially confined to specific structural intersections or fold hinges. When infill drilling intersects these shoots, drill results interpretation can show grade responses that are disproportionately high relative to the broader mineralised envelope.
The implication is that the June 2026 inferred resource has captured newly identified high-grade shoots that earlier drilling had not yet tested. Converting these into indicated status through targeted infill programs would not only add ounces to the schedulable inventory but would do so at grades that could lift the average diluted mine grade above what the prior Rowan Preliminary Economic Assessment modelled.
The Drill Program Economics: C$17.60 Per Ounce in Context
The resource growth was delivered by a focused program with clearly defined parameters:
- 37 drill holes completed
- 6,300 metres of total drilling
- C$3.5 million total program expenditure
- ~C$17.60 per ounce implied discovery and conversion cost
To understand why this cost metric is significant, it helps to benchmark it against broader industry norms for exploration spending:
| Exploration Context | Typical Discovery/Conversion Cost Range |
|---|---|
| Greenfield discovery (new jurisdiction) | C$100 – C$250+/oz |
| Brownfield expansion (known mining district) | C$30 – C$80/oz |
| Infill and conversion (structurally defined deposit) | C$10 – C$40/oz |
| Rowan June 2026 program result | ~C$17.60/oz |
The Rowan result sits at the lower end of the infill and conversion range, which reflects the structural advantage of drilling in a historically active, well-understood gold district where the geological framework already constrains target selection. The Red Lake district in Ontario has been producing gold since the 1930s, and the accumulated geological knowledge base reduces the targeting uncertainty that drives up costs in genuinely greenfield settings.
From a financial perspective, the program consumed approximately 7.3% of the company's C$48 million cash balance (as at December 31, 2025) to deliver a 138,078-ounce increase in indicated resources. That capital efficiency ratio is meaningful context for evaluating how the company is allocating its treasury ahead of the joint pre-feasibility study.
The Madsen Mill Hub: Why Toll-Milling Changes the Capital Equation
The strategic architecture underpinning the West Red Lake Gold Mines Rowan resource update cannot be evaluated in isolation from the processing infrastructure that gives it commercial meaning.
The Madsen Mill is a 100% owned, fully permitted processing facility rated at 800 tonnes per day operational capacity, with a 1,100 tonne per day nameplate ceiling. Rowan ore would be trucked approximately 80 road kilometres to this hub, making Rowan a satellite feed source rather than a standalone development project.
The capital expenditure implications of this model are substantial. Furthermore, the feasibility study process will be significantly streamlined given the existing infrastructure already in place.
What the toll-mill structure removes from the Rowan development capital requirement:
- Greenfield mill construction costs (typically 40-60% of standalone project capital in comparable underground developments)
- Tailings storage facility design and construction
- Processing infrastructure permitting timelines
- Plant commissioning and ramp-up risk
What remains in the Rowan capital requirement:
- Underground mine development including decline, ventilation, and services infrastructure
- Mobile mining equipment procurement
- Haul road maintenance and ore transport fleet
- Surface infrastructure at the mine portal
"Key structural insight: The Madsen Mill's permitted status eliminates one of the most time-consuming and capital-intensive phases of any new gold project. New processing facility permitting in Ontario can take several years and represents a major source of development schedule uncertainty for standalone projects. By routing Rowan ore through an existing, permitted facility, this execution risk is essentially removed from the development pathway."
The prior Rowan Preliminary Economic Assessment modelled production at approximately 35,200 ounces per year over a five-year mine life, using an average diluted grade of 8 g/t Au. Given that the updated indicated resource grades 13.03 g/t Au at undiluted levels, the joint Madsen-Rowan pre-feasibility study has materially better input data to work with. The gap between the undiluted resource grade and the diluted mining grade used in the PEA reflects the practical realities of narrow-vein underground mining, where waste dilution from hanging wall and footwall material is unavoidable, but a higher starting grade provides more buffer against dilution impacts on recovered ounces.
Mount Jamie: Reading the Geological Parallels Correctly
The maiden resource at Mount Jamie warrants careful interpretation. Located approximately 2 kilometres west of Rowan, the deposit delivered:
| Category | Ounces | Grade |
|---|---|---|
| Indicated | 49,000 oz | 14 g/t Au |
| Inferred | 35,000 oz | 12 g/t Au |
These are modest absolute numbers at this stage, but the analytical context surrounding the maiden resource is what gives it longer-term relevance. The Mount Jamie resource was constructed primarily from historical drilling data with identified gaps in analytical coverage, a starting condition that closely mirrors the data configuration at Rowan before targeted infill programs produced the material upgrades now reflected in the June 2026 MRE.
West Red Lake Gold Mines' VP of Exploration, Will Robinson, has noted that the geology at Mount Jamie shares strong similarities with Rowan's structural setting, and that the data gaps present at Mount Jamie today parallel the conditions that preceded Rowan's grade and tonnage improvements. This parallel is not a guarantee of equivalent outcomes, but it does provide a geologically grounded basis for viewing Mount Jamie as a candidate for comparable resource progression with targeted infill investment.
Robinson also outlined the operational logic of developing both deposits simultaneously, describing what he characterised as obvious synergies in a scenario where Rowan and Mount Jamie operate as concurrent satellite ore sources feeding the Madsen Mill. Running two satellites simultaneously would improve mill utilisation rates, reduce per-tonne fixed processing costs, and reduce single-asset operational dependency, all of which improve the overall economics of the hub-and-spoke model.
"Important caveat: Mount Jamie has not been incorporated into any economic study. No follow-up drill program timeline has been confirmed. The deposit remains at an early resource definition stage, and any production scenario involving Mount Jamie is speculative at this point."
The next major ASX story will hit our subscribers first
The Joint PFS: What Changes With a 70% Larger Indicated Resource Base
The joint Madsen-Rowan pre-feasibility study, targeted for release in Q3 2026, will be the first economic study to model both assets within a single integrated production framework. The expanded Rowan indicated resource base fundamentally changes what the study's mine planners can work with:
| Study Parameter | Prior Rowan PEA | Joint Madsen-Rowan PFS |
|---|---|---|
| Indicated resource base | 196,747 oz | 334,825 oz |
| Gold price assumption | US$1,800/oz | Updated to current market conditions |
| Assets modelled | Rowan only | Madsen + Rowan combined |
| Inferred grade | 8.73 g/t Au | 15.31 g/t Au |
| Mount Jamie | Not applicable | Not included (early stage) |
A larger schedulable inventory gives PFS engineers greater flexibility across three critical dimensions:
- Mine life extension – more indicated tonnes allow the mine plan to model a longer production schedule before hitting resource boundaries
- Annual production rate optimisation – with more scheduled inventory, the study can model higher throughput scenarios and test their sensitivity to mill utilisation, haulage costs, and capital payback periods
- Development sequencing flexibility – a deeper resource base allows engineers to prioritise higher-grade zones early in the mine schedule, improving early cash flow and reducing payback periods
The updated gold price assumption replacing the prior US$1,800/oz base case is also a material change. In addition, the current gold price outlook will have an outsized effect on net present value calculations and internal rate of return thresholds, and the direction of that update will significantly influence the economics the study presents.
Risk Factors Investors Should Weigh Carefully
The West Red Lake Gold Mines Rowan resource update presents a compelling technical picture, but several risk factors require balanced consideration.
Resource-level risks:
- The 179,013 inferred ounces at 15.31 g/t cannot be incorporated into the PFS mine plan until converted through additional infill drilling
- Grade continuity assumptions embedded in the resource model will be stress-tested during PFS mine design, and local grade variability in narrow-vein systems can produce surprises in both directions
- The dilution gap between undiluted resource grades and practical mining grades in narrow-vein underground operations can be significant, and the PFS will need to apply realistic dilution assumptions
Operational and execution risks:
- The 80 km haul distance between Rowan and the Madsen Mill creates ongoing operating cost exposure to diesel prices, weather conditions, and road infrastructure
- Mill scheduling between Madsen ore and Rowan satellite feed will require careful coordination to avoid throughput conflicts
- Mount Jamie's contribution to the hub strategy remains speculative without a confirmed drill program
Financial context:
- The C$48 million cash balance as at December 31, 2025 provides meaningful runway for PFS completion and continued exploration activity
- Future development capital requirements beyond the PFS phase have not yet been publicly quantified in the context of the updated resource base
"Disclaimer: This article contains forward-looking statements and financial projections based on data available at the time of writing. Mineral resource estimates are subject to revision. Prospective investors should conduct their own due diligence and seek independent financial advice before making investment decisions."
Frequently Asked Questions
What is the current Rowan indicated resource following the West Red Lake Gold Mines Rowan resource update?
The indicated resource stands at 334,825 ounces at 13.03 g/t Au, contained within 754,514 tonnes, as per the June 2026 MRE revision.
What is the inferred resource at Rowan?
The inferred resource totals 179,013 ounces at 15.31 g/t Au, contained within 360,323 tonnes, representing a 52% ounce increase and a 75% grade improvement relative to the June 2025 estimate.
How much did the Rowan drill program cost per ounce?
The 37-hole, 6,300-metre program cost C$3.5 million, delivering an approximate discovery and conversion cost of C$17.60 per ounce of resource addition.
When is the joint Madsen-Rowan pre-feasibility study expected?
The study is targeted for Q3 2026 and will be the first to model combined production economics for both Madsen and Rowan under the hub-and-spoke framework.
What is Mount Jamie and does it factor into the PFS?
Mount Jamie is an early-stage gold deposit approximately 2 km west of Rowan with a maiden resource of 49,000 indicated ounces at 14 g/t and 35,000 inferred ounces at 12 g/t. It has not been incorporated into any economic study and no follow-up drill timeline has been announced. However, the cut-off grade economics at both grades suggest meaningful potential should infill drilling confirm continuity.
Summary: Three Analytical Conclusions From the Rowan Update
| Metric | Value | Strategic Significance |
|---|---|---|
| Indicated resource growth | +70% to 334,825 oz at 13.03 g/t | Expands PFS-schedulable mine plan inventory |
| Inferred grade improvement | +75% to 15.31 g/t | Above prior indicated average; signals high-grade conversion targets |
| Drill program cost | C$3.5M / ~C$17.60 per oz | Capital-efficient resource addition from C$48M cash base |
| Mount Jamie maiden resource | 49,000 oz indicated / 35,000 oz inferred | Early-stage second satellite candidate |
| PFS target | Q3 2026 | Next major value-defining catalyst for the hub strategy |
Three conclusions emerge from a consolidated reading of this data:
-
The PFS now operates from a structurally stronger foundation. The 70% expansion in indicated ounces provides mine planners with greater scheduling flexibility, which translates directly into the range of production profile options the study can credibly model.
-
The inferred grade premium over the prior indicated average creates a technically credible conversion case. The quality of ounces available for future infill drilling is higher than the resource count alone suggests, and that quality differential strengthens the economic argument for continued drill investment before or after the PFS. For additional context on these development milestones, the latest company news provides ongoing updates directly from West Red Lake Gold Mines.
-
The hub-and-spoke model is gaining structural depth. With Mount Jamie now carrying a maiden resource at grades consistent with Rowan's pre-infill starting point, the long-term utilisation argument for the Madsen Mill extends beyond a single satellite source, even if that second source remains at an early stage of definition.
Readers seeking further context on West Red Lake Gold Mines' development strategy and ongoing exploration programs can access related coverage at Crux Investor.
Want To Catch The Next Major ASX Mineral Discovery Before The Market Does?
Discovery Alert's proprietary Discovery IQ model scans ASX announcements in real time, instantly converting complex geological data into actionable investment insights across more than 30 commodities — the same kind of structural analysis that separates schedulable, high-grade ounces from speculative resource counts. Explore how historic discoveries have delivered exceptional returns on Discovery Alert's dedicated discoveries page, then begin your 14-day free trial to position yourself ahead of the next significant find.