
June 15, 2026
When Earnings Yield Tells You Nothing: The Hidden Liability Trapping Small-Cap Coal Investors
There is a category of investment trap that catches experienced market participants far more often than it should. It begins with a number that looks almost impossibly attractive: an earnings yield approaching 100%, cash flows running well above reported profit, and a market capitalisation that appears to price the business at a fraction of its annual revenue. The instinct is to buy before anyone else notices. The discipline required is to read every footnote first.
In South African coal, this trap has a specific and recurring shape. It involves not just the operational complexity of supplying a financially stressed national utility, but a regulatory obligation that accumulates silently on the balance sheet for decades before it becomes a cash crisis. That obligation is the environmental rehabilitation provision, and for investors analysing Salungano Group, the Salungano rehabilitation provision is the single most important number in the financial statements.
When big ASX news breaks, our subscribers know first
Understanding the Environmental Rehabilitation Provision: The Legal Obligation That Never Sleeps
What the Law Actually Requires
South Africa's Mineral and Petroleum Resources Development Act (MPRDA), reinforced by the National Environmental Management Act (NEMA), creates a non-negotiable financial obligation for every mining right holder. The obligation is straightforward in principle: whoever disturbs land for mineral extraction must restore it to an acceptable condition when mining ceases. In practice, the financial scale of that restoration is enormous and the accounting treatment is frequently misunderstood.
The environmental rehabilitation provision (ERP) on a mining company's balance sheet represents the estimated present value of all future restoration costs, discounted back to today using a risk-appropriate discount rate. This is not a voluntary reserve. It cannot be deferred, waived, or negotiated away. Furthermore, under South Africa's 2015 and 2019 Financial Provisioning Regulations, Queensland's rehabilitation reforms offer a useful regulatory comparison, as mining right holders must:
- Maintain financial provision equal to the full estimated rehabilitation cost at all times
- Review and formally update that provision every year
- Hold acceptable financial instruments, including rehabilitation trust funds, bank guarantees, or insurance policies, to back the obligation
- Submit to regulatory oversight by the Department of Mineral and Petroleum Resources (DMPR), which retains the right to demand increased provisioning at any time
What makes the ERP particularly challenging from an investor's perspective is that it grows automatically, even in the absence of any new mining disturbance. Two mechanisms drive this continuous growth. The first is discount rate unwinding, sometimes called interest accretion, where the passage of time causes the present value of future obligations to increase through a mechanism essentially identical to compound interest running in reverse. The second is periodic re-estimation, where updated rehabilitation plans, evolving site conditions, regulatory amendments, and construction cost inflation trigger upward revisions to the underlying liability.
Key technical point: Rehabilitation cost indices in South Africa have historically escalated faster than general consumer price inflation, because the costs are dominated by earthworks, water treatment, and vegetation re-establishment, all of which track construction and commodity input prices more closely than household expenditure baskets.
Why This Line Item Is Systematically Underweighted by Analysts
In small-cap mining analysis, the ERP routinely receives less attention than it deserves. Several factors contribute to this. The provision appears on the balance sheet as a non-current liability, separated from operational metrics by convention. It does not consume cash in the current period.
Its growth is disclosed in the notes rather than highlighted in headline results. And because the obligation becomes a cash event only at mine closure, which can feel theoretically distant, it tends to be mentally discounted by investors focused on near-term earnings. This is a conceptual error with meaningful financial consequences, particularly when considering mine reclamation obligations and the long-term liabilities they create.
Salungano's Rehabilitation Provision: Scale, Trajectory, and the Funding Gap
Six Years of Accelerating Growth
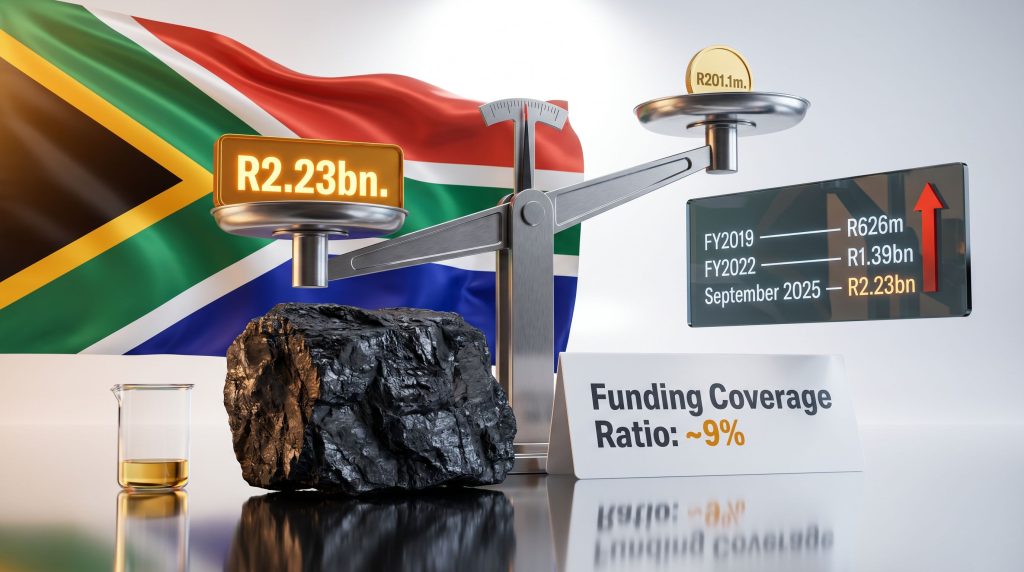
The Salungano rehabilitation provision has grown at a pace that should command serious attention from anyone evaluating the company's equity value. The trajectory is not subtle.
| Financial Year | Rehabilitation Provision | Notable Event |
|---|---|---|
| FY2019 | R626m | Baseline period |
| FY2022 | R1.39bn | Flagged as key audit matter by KPMG |
| September 2025 (H1) | R2.23bn | Grew R116.7m in a single half-year |
The fact that the provision expanded by R116.7 million across a single six-month reporting period, with no new mining disturbance recorded, illustrates precisely how powerful the discount unwinding and re-estimation mechanisms are. When KPMG designated the ERP as a key audit matter in FY2022, this was a professional signal that the estimation methodology, the underlying assumptions, and the sheer scale of the liability warranted heightened scrutiny. That designation was well-founded: the provision has grown by a further R840 million since that audit cycle.
The Funding Gap That Defines the Risk
Against a total ERP of R2.23 billion, the ring-fenced rehabilitation trust fund held approximately R201.1 million at the most recent reporting date. That represents a funding coverage ratio of roughly 9%.
| Metric | Salungano | Industry Expectation |
|---|---|---|
| Rehabilitation Fund Balance | R201.1m | Ideally 50-100% of provision |
| Annual Contribution Rate | ~R30m | Proportional to mine life |
| Funding Coverage Ratio | ~9% | Regulatory minimum varies |
| Years to Full Funding at Current Rate | ~75 years | Aligned to mine closure timeline |
The arithmetic here is straightforward and sobering. At an annual contribution rate of approximately R30 million, closing the current gap of roughly R2.03 billion would require approximately 75 years of uninterrupted contributions, assuming no further growth in the provision itself. Given that the provision is growing by more than R116 million in a single half-year, the gap is not closing. It is widening.
The ring-fenced trust structure provides important legal protection in one direction: the funds are quarantined from general creditors and cannot be redirected toward operational expenses or debt repayment. However, this protection operates asymmetrically. Regulatory authorities retain the right to draw on the trust in the event of operator default on closure obligations, and any shortfall between the trust balance and actual closure costs would represent a liability that cannot simply be dissolved through corporate restructuring.
The Balance Sheet Reality Behind the Attractive Earnings Numbers
A Business That Generates Real Cash With Structural Equity Problems
To understand why Salungano looks superficially attractive, it is necessary to acknowledge that the operational performance is genuinely positive in isolation. Revenue for the six months to September 2025 came in at just over R3 billion. Operating profit reached R328 million. Cash from operations was approximately R354 million and profit after tax approached R158 million.
With a market capitalisation around R319 million, annualising those earnings produces a yield that few listed businesses anywhere on the JSE can match. The issue is not the income statement. The issue is what lies beneath it. Indeed, commodity prices and miner performance must always be evaluated alongside structural balance sheet risks of this nature.
Adjusting for What Standard Multiples Miss
A rigorous framework for assessing equity value in a business carrying a large unfunded rehabilitation provision requires working through several layers of adjustment:
- Start with reported total equity: R172.7 million
- Identify unfunded rehabilitation exposure: R2.23bn provision minus R201.1m trust equals approximately R2.03 billion unfunded
- Assess the deferred tax asset: R475.7 million, the second-largest asset on the balance sheet after mining properties, requires R1.7 billion in future taxable income to be realised; against a current retained earnings deficit of R457.6 million, this is a substantial recoverability question
- Examine inventory provisioning: R237.4 million provisioned as obsolete or slow-moving, up from R3.1 million a year earlier, representing a 76-fold increase that requires explanation
- Assess residual equity value for ordinary shareholders after these adjustments
Analytical caution: When unfunded environmental liabilities exceed total equity by a factor of nearly 13 times, standard earnings yield or price-to-earnings metrics become structurally unreliable as standalone valuation tools. They measure operating performance accurately but say nothing about the terminal value question.
The retained earnings deficit of R457.6 million tells its own story. In FY2022, the audited accounts showed positive retained earnings of R194.2 million. The shift to a deficit of R457.6 million implies that approximately R651.8 million in equity value was destroyed across the intervening three years, a period that also included a JSE suspension from August 2023 to mid-May 2025, an en masse resignation of the audit committee, voluntary business rescue for the major mining subsidiary, and a 26-month continuous debt default on R1.1 billion in borrowings before the facilities were eventually cleared.
Revenue Concentration and the Eskom Dependency Problem
One Customer, One Risk
Approximately 95% of Salungano's revenue in the most recent half-year derived from a single counterparty: Eskom. The breakdown included approximately R2 billion in direct coal sales supplemented by R715 million in transport under Eskom service contracts. There are no meaningful export revenues and no secondary customer of comparable scale.
This concentration creates a direct transmission channel between Eskom's financial health and Salungano's ability to fund its rehabilitation obligations. The scenario consequences are worth examining explicitly.
| Scenario | Revenue Impact | Rehabilitation Funding Consequence |
|---|---|---|
| Eskom contract renewal (base case) | R3bn+ annualised | R30m annual contributions maintained |
| Partial volume reduction (-30%) | ~R900m revenue loss | Contribution capacity severely constrained |
| Contract non-renewal or early termination | Near-total revenue loss | Trust contributions cease; state intervention risk escalates |
| Accelerated mine closure trigger | Immediate | Full R2.23bn obligation becomes payable |
Eskom's own financial trajectory introduces a second layer of risk. South Africa's national utility has carried substantial debt loads and required repeated government support, and its procurement decisions are subject to political, regulatory, and financial pressures that an individual coal supplier cannot control. A miner generating R354 million in operating cash flow per half-year appears well-positioned until that single revenue source faces disruption. At that point, the rehabilitation funding gap does not pause.
Governance Indicators That Compound the Financial Risk
The Absence of Independent Financial Assurance
Several governance characteristics of Salungano's recent reporting history are worth noting separately from the purely financial analysis. Indeed, management red flags of this nature often compound underlying financial risks in ways that are difficult to quantify:
- The most recent interim results were published without an independent review or audit engagement
- The FY2025 annual accounts were published approximately nine months late
- The audit committee resigned en masse in August 2023, the same event that triggered the JSE suspension
- The major mining subsidiary entered voluntary business rescue during the suspension period
- A related-party loan of R57.2 million exists with RBFT, the major BEE shareholder, at prime plus 2%, an arrangement that warrants monitoring
The combination of unreviewed financial statements and delayed annual accounts creates a specific analytical problem: the numerical precision of the balance sheet figures cannot be independently verified by investors reading those statements. The rehabilitation provision of R2.23 billion, the deferred tax asset of R475.7 million, and the inventory provisioning of R237.4 million are all derived from estimation methodologies that an independent auditor would normally scrutinise. Without that scrutiny on record, the uncertainty around those figures is higher than it would otherwise be.
The next major ASX story will hit our subscribers first
A Framework for Evaluating Rehabilitation Risk in Junior Coal Miners
Seven Steps Before Applying Any Earnings Multiple
For investors evaluating small-cap coal miners with material ERPs, a structured approach prevents the valuation errors that attractive headline numbers can produce. Consequently, permitting and closure risk must be considered at every stage of the following process:
- Identify the gross ERP from the notes to the financial statements, not the face of the balance sheet
- Subtract the balance held in ring-fenced rehabilitation trust funds to arrive at the net unfunded exposure
- Calculate the unfunded exposure as a multiple of total equity to establish leverage ratio
- Compare the annual contribution rate against the mine's remaining operational life to determine whether the gap can realistically close
- Stress-test the deferred tax asset against conservative future earnings projections, not optimistic management guidance
- Assess inventory provisions for evidence of structural asset quality deterioration versus one-off write-downs
- Adjust equity value for these factors before applying any earnings multiple to the income statement
Red Flags in Rehabilitation Accounting
The following characteristics, several of which are present in the Salungano case, signal elevated rehabilitation liability risk. Furthermore, context such as the broader South African mining decline makes these risks particularly relevant for the region:
- Funding coverage ratio below 20% of total provision
- Annual contribution rate insufficient to close the gap within the mine's operational life
- Provision growing faster than contributions even without new disturbance
- Deferred tax assets requiring implausibly large future taxable income to utilise
- Delayed or unreviewed financial statements that limit independent verification of provision estimates
- A single-customer revenue structure that ties rehabilitation funding capacity to one counterparty's solvency
Moreover, PwC's guidance on closure and rehabilitation provisioning provides a useful international framework for understanding how these obligations should be properly accounted for and communicated to investors.
Key Metrics at a Glance
| Financial Indicator | Value | Significance |
|---|---|---|
| Environmental Rehabilitation Provision | R2.23bn | 12.9x total equity |
| Ring-Fenced Trust Fund Balance | R201.1m | 9% of total obligation |
| Annual Contribution Rate | ~R30m | 75-year gap closure timeline |
| Total Equity | R172.7m | 4.7% of total assets |
| Retained Earnings Deficit | R457.6m | R651.8m destroyed since FY2022 |
| Deferred Tax Asset | R475.7m | Requires R1.7bn future taxable income |
| Inventory Provision Increase | 76x year-on-year | From R3.1m to R237.4m |
| Revenue Concentration | ~95% from Eskom | Structural counterparty risk |
The Salungano rehabilitation provision, at R2.23 billion and growing, does not render the business uninvestable in an absolute sense. Operating cash flows are real, the bank debt has been cleared, and the underlying coal supply contract continues to generate revenue. What it does render unreliable is any valuation framework that stops at the income statement without working through the full balance sheet consequences of an obligation this large, this underfunded, and this legally immovable.
The broader lesson for South African coal sector investors is the same one that surfaces across resource markets globally: the cheapest-looking stock on a single metric is rarely cheap once the footnotes are read in full.
Disclaimer: This article is intended for informational purposes only and does not constitute financial advice. Investors should conduct their own due diligence and consult a licensed financial adviser before making investment decisions. All financial data referenced is drawn from publicly available company disclosures and industry sources. Forward-looking statements and scenario analyses involve assumptions that may not reflect actual outcomes.
Want To Identify ASX Mineral Discoveries Before the Broader Market Does?
Discovery Alert's proprietary Discovery IQ model delivers real-time alerts on significant ASX mineral discoveries, cutting through complex data to surface actionable opportunities the moment they're announced — explore the historic returns major discoveries have generated to understand what's at stake, then begin your 14-day free trial at Discovery Alert to position yourself ahead of the market.