July 11, 2026
From Periodic Inspections to Persistent Intelligence: How Remote Sensing Is Redefining Mine Monitoring
Every generation of mining technology arrives with a promise: do more, spend less, and reduce risk. Ground-penetrating radar, autonomous haulage, real-time ore sorting — each iteration has pushed the boundaries of what operators can know about their assets and environment. Yet for decades, one of the most critical monitoring challenges in the industry — understanding what is happening across vast, remote, and operationally complex mine footprints on a continuous basis — remained stubbornly difficult to solve through conventional means.
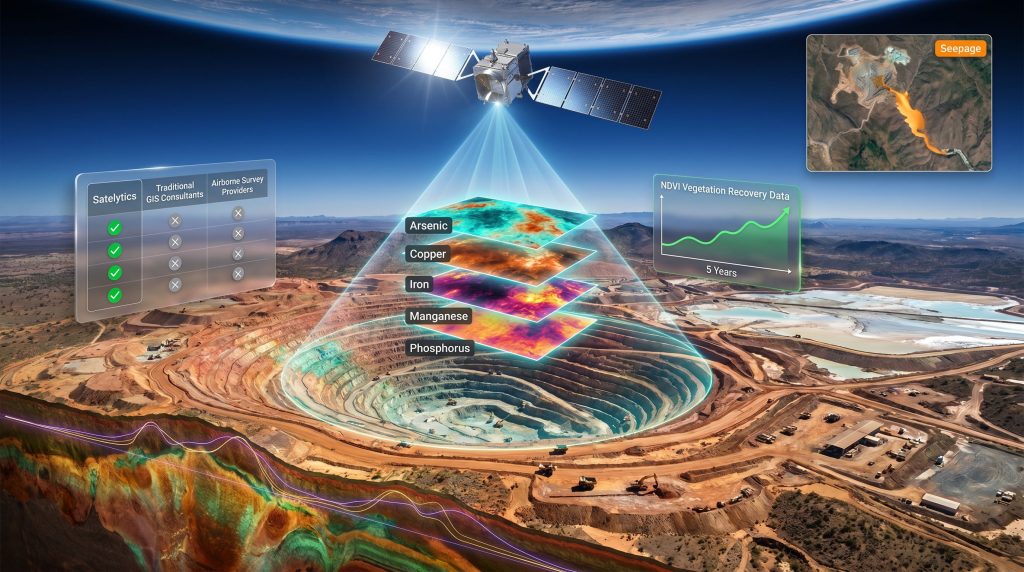
The answer, it turns out, may lie roughly 500 kilometres above the Earth's surface. The rapid maturation of commercial satellite constellations, combined with advances in machine learning and cloud-based spectral analysis, has created an entirely new category of mine intelligence. Satelytics satellite data for mining represents one of the most compelling expressions of this convergence, applying cloud-native geospatial analytics to raw multispectral and hyperspectral imagery to generate actionable environmental and geological intelligence across the full mining lifecycle.
Understanding what this technology actually does, and where its genuine value lies, requires moving well beyond the marketing language that often surrounds remote sensing platforms. This article examines the technical foundations, practical applications, and strategic implications of satellite-based analytics across exploration, operations, and post-closure mine management.
When big ASX news breaks, our subscribers know first
Why Ground-Based Monitoring Reached Its Limits
Traditional environmental and operational monitoring in mining has always faced a fundamental constraint: it is episodic by nature. Site inspections, field geochemistry programs, airborne surveys, and manual instrumentation all deliver snapshots rather than continuous streams of intelligence. In between those snapshots, conditions can change in ways that are financially and environmentally significant.
Consider the practical limitations of conventional monitoring approaches:
- Physical site inspections are constrained by access, weather, cost, and human safety, particularly in remote or topographically challenging terrain.
- Airborne geophysical surveys deliver excellent resolution but are expensive to mobilise and typically conducted on campaign cycles measured in years, not weeks.
- Ground-based sensor networks provide continuous data but only at fixed instrumented points, leaving large spatial gaps across mine footprints that can extend over tens of square kilometres.
- Laboratory-based geochemical sampling requires physical collection, transport, and analytical processing, introducing time delays that can be critical in contamination or instability scenarios.
The commercial satellite sector has fundamentally disrupted this paradigm. Modern Earth observation constellations, operated by companies including Planet Labs, Maxar, and Airbus Defence and Space, now provide revisit frequencies over specific geographic coordinates that range from daily to multi-day intervals. When combined with cloud-based analytical platforms capable of processing raw spectral data into interpreted outputs within hours of image acquisition, the result is a monitoring capability with no historical precedent in the industry.
Understanding the Spectral Science Behind Satelytics Satellite Data
To appreciate what platforms like Satelytics actually detect, it helps to understand the physics underlying remote sensing. Every material on Earth's surface — whether rock, water, vegetation, or a chemical precipitate — reflects incoming solar radiation across different portions of the electromagnetic spectrum in a characteristically unique pattern. This pattern is known as a spectral signature.
Human vision perceives only a narrow band of this spectrum, roughly 400 to 700 nanometres in wavelength. Multispectral and hyperspectral sensors extend this range dramatically, capturing reflected energy from ultraviolet through visible, near-infrared, and shortwave infrared wavelengths. The distinction between multispectral and hyperspectral imaging matters considerably in mining applications:
| Imaging Type | Spectral Bands | Typical Resolution | Primary Mining Application |
|---|---|---|---|
| Multispectral | 4 to 12 discrete bands | 3 to 30 metres | Vegetation stress, broad mineralogy, water quality |
| Hyperspectral | 100 to 400+ continuous bands | 5 to 30 metres | Detailed mineral mapping, alteration zone identification |
| RGB (standard optical) | 3 bands | Sub-metre | Visual change detection, infrastructure mapping |
| Thermal infrared | Variable | 30 to 100 metres | Seepage detection, subsurface heat anomalies |
Platforms processing hyperspectral imagery can match surface reflectance patterns against libraries of known spectral signatures for specific minerals and chemical compounds. This enables the identification of iron hydroxide precipitates characteristic of acid mine drainage, clay alteration minerals associated with hydrothermal mineralisation, and nitrogen or phosphorus enrichment in water bodies near processing facilities — all from orbit, and without a single boot touching the ground.
A critical and often underappreciated feature of sophisticated geospatial analytics platforms is data persistence. Rather than discarding imagery once processed, retained historical datasets enable operators to build time-series comparisons that reveal trends invisible in any single acquisition. This compounding intelligence model means that the analytical value of continuous satellite monitoring increases with time — a property with significant implications for both operational decision-making and long-term regulatory compliance.
Detectable Elements and Surface Expressions
Among the elemental and compound signatures that satellite analytics platforms have demonstrated capability to detect at surface include:
- Arsenic and manganese: Common indicators of acid mine drainage and tailings leachate migration into drainage systems.
- Copper and iron: Both produce distinctive oxidation and hydroxide surface expressions detectable through infrared wavelengths.
- Molybdenum and barium: Present in porphyry and epithermal systems, their surface geochemical expressions can indicate prospective structural zones.
- Phosphorus and nitrogen: Key indicators of process water discharge, fertiliser contamination, or biological activity changes in water bodies adjacent to mine operations.
It is important to be precise about the boundary of satellite-based detection capability. Spectral analytics identifies surface expressions and anomalies. It does not directly measure subsurface grade, thickness, or continuity of mineralisation. The distinction between detecting a spectral anomaly and confirming an economic mineral deposit remains absolute. Field validation, drilling, and laboratory assay are irreplaceable steps in converting remote sensing observations into actionable geological conclusions.
Satellite-derived spectral analytics can dramatically compress the search space for exploration targets and environmental risks alike, but the technology functions as a sophisticated screening and prioritisation tool rather than a replacement for ground-based verification.
Phase One: Accelerating Mineral Exploration Through Orbital Intelligence
The economics of early-stage mineral exploration have long been characterised by a brutal ratio: large areas must be assessed to identify small zones worthy of drill testing. Traditional exploration workflows move through progressively more expensive and spatially focused methods — from regional geophysical surveys and geochemical sampling programs through to detailed prospect mapping before a single metre of drilling is justified.
Satellite spectral analytics inserts a powerful and relatively low-cost screening capability into this workflow, enabling exploration teams to rank and prioritise target areas across continental-scale tenement packages before mobilising field crews. Furthermore, tools such as 3D geological modelling can complement satellite-derived data by adding subsurface structural context that informs target selection.
Practical Exploration Applications
The specific surface features identifiable through satellite spectral analysis that carry exploration significance include:
- Hydrothermal alteration zones: Clay minerals including kaolinite, illite, and alunite form distinctive spectral assemblages that are strong indicators of fluid pathways in epithermal and porphyry environments.
- Iron oxide caps: Gossans in exploration and ferricrete zones formed by supergene oxidation of sulphide mineralisation produce intense iron oxide signatures detectable across broad areas.
- Structural geology features: Lineaments, fault traces, and lithological contacts visible in processed satellite imagery provide spatial context for understanding mineralisation controls.
- Vegetation geobotanical anomalies: Some plant communities exhibit stress signatures, detectable through near-infrared and red-edge spectral bands, in response to elevated heavy metal concentrations in soils above mineralised zones.
Exploration Method Comparison
| Exploration Method | Coverage Scale | Time to First Insight | Relative Cost | Ground Validation Required |
|---|---|---|---|---|
| Ground geological mapping | Site-scale (km²) | Weeks to months | High | Yes |
| Airborne magnetics/EM | Regional (hundreds km²) | Weeks | Very high | Yes |
| Airborne hyperspectral survey | Regional | Days to weeks | High | Yes |
| Satellite spectral analytics | Continental | Days | Low to moderate | Yes |
| UAV hyperspectral survey | Site-specific | Days | Moderate | Yes |
Cloud cover, dense vegetation canopy, and thick transported cover materials remain genuine constraints on satellite spectral performance. In heavily vegetated tropical terrains or regions with persistent cloud cover, the utility of optical satellite analytics is reduced and alternative geophysical methods may deliver superior screening capability. Honest acknowledgement of these limitations is essential to using the technology effectively rather than uncritically.
Phase Two: Operational Risk Management Across Active Mine Sites
Where satellite monitoring arguably delivers its most immediate and financially material value is across active operations. The combination of broad spatial coverage, high revisit frequency, and objective measurement creates a monitoring capability with profound implications for three of the most consequential risk categories in mine operations: tailings facility integrity, acid mine drainage, and land disturbance compliance.
Tailings Storage Facility Surveillance
The global tailings dam safety record over the past decade has reshaped regulatory expectations and community tolerance for inadequate monitoring across the industry. Catastrophic failures at major operations in Brazil and elsewhere have demonstrated that the consequences of undetected instability extend to loss of life, environmental destruction affecting entire river systems, and multi-billion dollar liability.
Satellite analytics addresses several dimensions of tailings facility risk monitoring:
- Surface displacement mapping using radar interferometry (InSAR) techniques can detect millimetre-scale wall movement between satellite passes, providing early warning of deformation patterns preceding structural compromise.
- Seepage zone identification through infrared spectral analysis detects moisture anomalies and iron hydroxide precipitation patterns at the toe of tailings structures before these become visible to the naked eye.
- Volumetric change monitoring tracks the rate of tailings deposition and freeboard reduction against approved operational limits.
- Beach and embankment geometry change detection provides time-referenced records of structural modification that feed directly into safety management reporting obligations.
Warning: Satellite-based early warning systems for tailings facility integrity represent a critical risk mitigation layer and must be deployed alongside certified on-ground geotechnical instrumentation and formally documented emergency response protocols. Remote sensing supplements but does not replace ground-based safety systems.
Acid Mine Drainage Detection and Water Quality Monitoring
Acid mine drainage represents one of the most persistent and expensive long-term liabilities in mining. Generated when sulphide minerals in waste rock and tailings are exposed to water and oxygen, AMD produces highly acidic, metal-laden leachate capable of contaminating waterways across catchments extending well beyond mine boundaries. Early spatial detection is critical to limiting the geographic extent of contamination and the associated remediation cost burden.
The spectral signatures of AMD are highly distinctive from orbit:
- Iron hydroxide precipitation produces vivid yellow-orange surface staining visible in both visible and near-infrared wavelengths.
- pH-driven water colour anomalies in receiving water bodies create detectable spectral shifts, particularly in the visible spectrum.
- Riparian vegetation stress along affected drainage lines manifests as declining chlorophyll content detectable in red-edge and near-infrared bands.
Monitoring nitrogen and phosphorus concentrations in water systems adjacent to processing operations also falls within satellite spectral capability. This supports compliance with discharge limits and enables early detection of nutrient enrichment events that would otherwise require expensive field sampling programs to identify. In addition, the processing challenges in mining that affect water chemistry can be tracked more effectively when satellite monitoring is integrated alongside conventional methods.
Vegetation and Land Disturbance Compliance
Approved operational footprints define the legal boundary of mining disturbance. Monitoring compliance with these boundaries has historically relied on periodic aerial surveys or field checks, creating surveillance gaps that could allow unauthorised clearing to go undetected for extended periods.
Near-real-time satellite change detection removes this gap. Comparison of current imagery against approved disturbance maps enables automated flagging of vegetation clearing events occurring outside permitted boundaries, providing both an operational compliance safeguard and an auditable record for regulatory purposes.
Phase Three: Post-Closure Stewardship and Rehabilitation Verification
Mine closure represents a transition from operational risk management to long-term environmental stewardship. The financial liabilities associated with inadequate closure execution — including forfeited rehabilitation bonds, regulatory enforcement action, and residual contamination remediation costs — can persist for decades. Satellite analytics provides an objective, spatially referenced evidence base for tracking closure performance against regulatory milestones.
Consequently, mine reclamation innovation is increasingly incorporating satellite-derived datasets as a core component of post-closure verification frameworks.
Rehabilitation Tracking Using Spectral Vegetation Indices
Spectral vegetation indices derived from satellite imagery provide quantitative measures of revegetation progress that are directly comparable across time and space. The Normalised Difference Vegetation Index (NDVI), Enhanced Vegetation Index (EVI), and Soil-Adjusted Vegetation Index (SAVI) all utilise near-infrared and red band reflectance ratios to characterise plant canopy density, vigour, and coverage fraction.
Applied to mine rehabilitation monitoring, these indices enable:
- Annual or seasonal tracking of revegetation coverage fraction across rehabilitation cells.
- Comparison of rehabilitated zones against undisturbed reference areas using pre-disturbance baseline imagery.
- Early identification of revegetation failure zones requiring intervention before regulatory performance criteria deadlines.
- Generation of objectively verifiable evidence supporting progressive rehabilitation bond release submissions.
Post-Closure Scenario: Satellite Analytics in Practice
Scenario: A large open-cut copper operation in a semi-arid region enters care and maintenance. Satellite analytics are deployed to track progressive revegetation of the waste rock dump using NDVI time-series over a five-year closure horizon, monitor AMD plume migration from the tailings storage facility into an adjacent drainage catchment, and detect any renewed slope movement on the pit wall through surface displacement mapping. Eighteen months post-closure, the operator identifies a previously undetected AMD seepage pathway through seasonal spectral change analysis, enabling targeted intervention before a regulatory compliance breach materialises. The early detection and remediation response avoids enforcement action and associated liability costs that field-based monitoring programs, operating at lower spatial frequency, would have been unlikely to identify at the same stage.
The next major ASX story will hit our subscribers first
ESG Disclosure, Regulatory Compliance, and Investor Risk Pricing
The strategic value of continuous satellite monitoring extends well beyond operational efficiency. As institutional investor scrutiny of mining company ESG performance has intensified, the quality and verifiability of environmental data has become a dimension of financial risk assessment rather than purely a regulatory compliance consideration. Furthermore, the concept of natural capital in mining is gaining traction as companies seek to quantify and report on ecosystem impacts in ways that satellite data can directly support.
How Satellite Data Strengthens ESG Reporting Credibility
The critical weakness in much current ESG environmental reporting from mining companies is the gap between what is claimed and what can be independently verified. Satellite monitoring addresses this gap directly by generating spatially referenced, time-stamped, and independently reproducible datasets that support:
- Land disturbance and progressive rehabilitation reporting under biodiversity impact disclosure frameworks.
- Water stewardship metrics including catchment-scale contamination mapping and receiving environment condition monitoring.
- Scope 3 land-use emissions reporting that requires objectively measurable disturbance area data.
- Retention of historical imagery datasets that create an audit-ready evidence base for both regulatory submissions and community transparency reporting.
The Investor Perspective on Monitoring Capability
An increasingly important and often underappreciated dynamic in mining project financing is the correlation between demonstrated environmental monitoring capability and access to capital. Institutional lenders and equity investors operating under ESG mandates are beginning to factor the quality of a mining company's monitoring infrastructure into their risk assessment frameworks.
Operations that can demonstrate continuous, data-driven environmental performance tracking present a materially different risk profile than operations relying solely on periodic inspection regimes. This difference has begun to influence:
- The pricing of project finance debt, with demonstrably better-monitored operations accessing more competitive lending terms.
- The willingness of ESG-screened equity funds to include mining stocks in their portfolios.
- The outcome of social licence negotiations with host communities and Indigenous land holders, where verifiable monitoring data supports trust-building rather than assertion-based engagement.
Satelytics vs. Conventional Geospatial Approaches: A Capability Comparison
Understanding where cloud-native satellite analytics platforms sit within the broader landscape of mine monitoring options helps operators make rational technology investment decisions. According to mine site monitoring lifecycle analysis, the shift towards satellite-based systems is becoming increasingly embedded across all phases of a mine's operational life.
| Capability | Cloud-Based Satellite Analytics | Traditional GIS Consultants | Airborne Survey Providers | In-House Remote Sensing Teams |
|---|---|---|---|---|
| Monitoring continuity | High (satellite cadence) | Low (project-based) | Low (campaign-based) | Variable |
| Spectral data types | Multi and hyperspectral | Variable | Variable | Variable |
| Cloud-native delivery | Yes | No | No | Partial |
| Historical data retention | Yes (systematic) | Project-dependent | Project-dependent | Yes |
| Automated alert system | Yes | No | No | Custom build required |
| UAV and aircraft data integration | Yes | Partial | Yes | Yes |
| ESG-ready reporting outputs | Yes | Partial | No | Partial |
| Multi-site scalability | High | Low | Low | Moderate |
The operational advantage of continuous monitoring over periodic campaign-based surveys compounds significantly over time. A monitoring gap of three to six months between airborne surveys represents an extended window in which AMD seepage, tailings embankment deformation, or disturbance compliance breaches can develop without detection. Cloud-native satellite platforms with automated change detection and alert notification systems can compress this window to days.
Frequently Asked Questions About Satellite Analytics for Mining
What types of mining operations benefit most from satellite analytics?
Operations with large spatial footprints, remote locations, complex environmental obligations, or proximity to sensitive receiving environments derive the greatest value. This includes open-cut metalliferous mines with large tailings facilities, coal operations with extensive rehabilitation liabilities, and processing-intensive operations generating significant water management obligations.
How accurate is satellite-based mineral detection compared to field geochemistry?
Satellite spectral analytics identifies surface anomalies and alteration assemblages with high spatial coverage but fundamentally lower geochemical precision than laboratory-based assay methods. The two approaches are complementary in design: remote sensing narrows the search area, and field geochemistry quantifies what has been found.
Can satellite data monitor underground mines?
Primary applications remain at surface. Subsurface processes are detected indirectly through surface expressions including ground subsidence mapping, dewatering discharge chemistry monitoring, and drainage network contamination signatures.
How frequently is satellite imagery updated over a mine site?
Revisit frequency depends on the satellite constellation employed and the geographic location of the site. Current commercial constellations can achieve daily to multi-day coverage over high-priority sites, with some operators accessing near-daily imagery through multi-constellation tasking agreements.
Is satellite monitoring data acceptable as regulatory compliance evidence?
In a growing number of jurisdictions, spatially referenced and time-stamped satellite datasets are being accepted as supporting evidence in environmental compliance reporting. Requirements vary considerably by regulator, and operators should confirm specific evidentiary standards with relevant regulatory authorities before relying solely on satellite data for compliance submissions.
What is the typical cost structure for satellite analytics platforms?
Licensing is typically structured on a site-based or area-based subscription model. Costs vary by monitoring area, data acquisition frequency, and analytical complexity. In most deployment scenarios, continuous satellite monitoring programs are substantially more cost-effective than equivalent airborne survey programs offering comparable spatial coverage at annual or biennial frequencies.
The Compounding Intelligence Model: Why Time in the Data Matters
One of the most strategically significant and least-discussed properties of retained satellite monitoring datasets is their compounding analytical value. Unlike periodic surveys that deliver isolated snapshots, a continuously maintained satellite monitoring archive over a mine site builds an increasingly rich contextual record with each acquisition cycle.
The practical implications of this compounding intelligence model include:
- Baseline characterisation improves with time, enabling more precise detection of deviations from established normal variability ranges.
- Trend analysis across multi-year or multi-decadal datasets reveals slow-developing environmental changes that are invisible in short-observation windows.
- Regulatory and legal defensibility of the monitoring record increases as the temporal depth of the dataset grows.
- Closure liability assessments benefit from pre-disturbance baseline data captured at the commencement of monitoring, which may date back to before significant operational disturbance occurred.
This property means that early adoption of satellite monitoring delivers compounding returns relative to later adoption. An operator who begins continuous Satelytics satellite data for mining at the commencement of operations will have a materially richer analytical baseline available at closure than one who initiates monitoring in response to a regulatory requirement five years into production.
As ESG obligations intensify, regulatory frameworks evolve, and investor scrutiny of environmental performance deepens, the transition of satellite-based monitoring from competitive advantage to operational baseline expectation appears well advanced. The fundamental question for mine operators is no longer whether space-based intelligence belongs in their monitoring toolkit, but how quickly the transition from periodic inspection to continuous observation can be completed across their asset portfolios.
Disclaimer: This article is intended for informational purposes only and does not constitute financial, investment, or regulatory advice. Readers should conduct their own due diligence before making investment or operational decisions. References to scenario projections and hypothetical case studies are illustrative in nature and do not represent specific operational outcomes. Regulatory acceptance of satellite monitoring data varies by jurisdiction and should be confirmed with the relevant regulatory authorities.
Want to Know Which ASX Mining Companies Are Making Significant Mineral Discoveries Right Now?
Discovery Alert's proprietary Discovery IQ model scans ASX announcements in real time, instantly translating complex geological and commodity data across 30+ minerals into clear, actionable investment insights — precisely the kind of edge that matters when evaluating exploration-stage companies operating at the frontier of new technology and discovery. Explore historic examples of major mineral discoveries and their market returns, then begin your 14-day free trial at Discovery Alert to position yourself ahead of the broader market.