July 8, 2026
The OSP Mechanism: More Than Just a Price Tag
Most observers of the global crude oil market focus on Brent and WTI benchmarks like Brent or WTI. But for the refiners that process the majority of the world's heavy and medium sour crude, the number that truly matters arrives once a month from Dhahran: Saudi Aramco's Official Selling Price, or OSP.
The OSP is not a spot price. It functions as a differential applied to a reference benchmark, setting the effective cost of term contract volumes loaded during the following month. For Asian buyers, that benchmark is the Oman/Dubai average, a basket reflecting the physical crude grades most comparable to Saudi exports in terms of density and sulphur content. When Aramco publishes its monthly OSP, it is simultaneously communicating a price signal, a competitive positioning statement, and a market share intention to the world's largest and fastest-growing refining complex.
This is why the August 2026 OSP announcement carries significance well beyond its headline number. When Saudi Arabia cuts crude oil prices for Asia by $11 per barrel in a single month, the message embedded in that decision is far more consequential than a routine pricing adjustment.
When big ASX news breaks, our subscribers know first
Mapping the Scale of the August 2026 Price Reduction
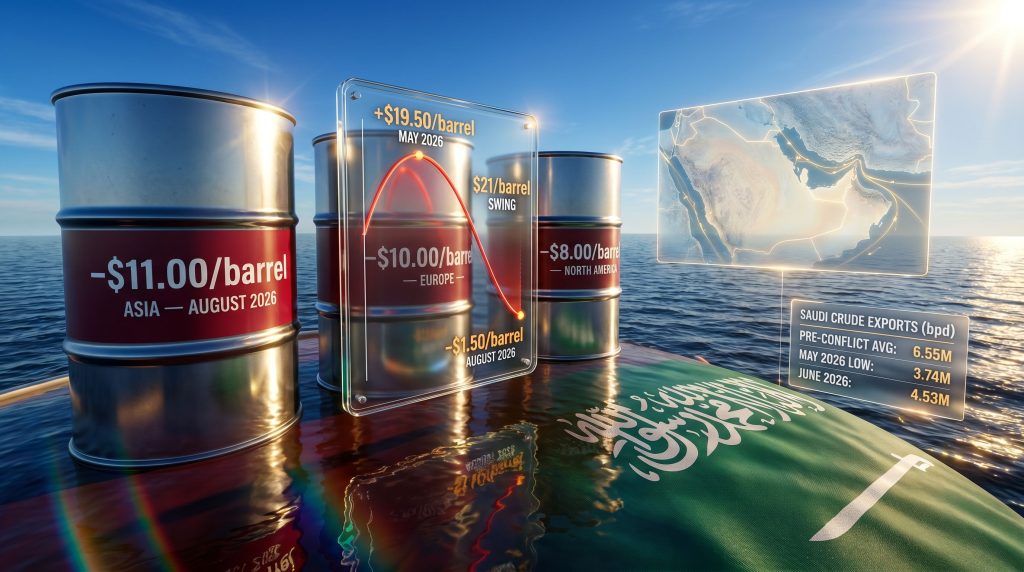
The numbers attached to the August 2026 OSP revision are, by any historical measure, extraordinary. According to Reuters records dating to 2003, Arab Light crude for August-loading cargoes was set at a discount of $1.50 per barrel below the Oman/Dubai average, representing the steepest single-month reduction in at least 26 years of recorded pricing data, as reported by Bloomberg.
The table below captures the full scope of the adjustment across all destination regions and places the August figure within its recent historical context.
| Region | OSP Adjustment (August 2026) |
|---|---|
| Asia | -$11.00/barrel |
| Europe | -$10.00/barrel |
| North America | -$8.00/barrel |
| Arab Light vs. Oman/Dubai (August) | -$1.50/barrel (discount) |
| Arab Light OSP (May 2026 peak) | +$19.50/barrel (premium) |
| Previous OSP (July 2026) | +$9.50/barrel (premium) |
Asia received the deepest cut of any destination region, reflecting the fact that approximately 80% of Saudi crude exports flow to Asian buyers. The August OSP also brought the absolute price level to its lowest point since June 2020, when pandemic-driven demand destruction had pushed crude markets to multi-decade lows.
Analyst consensus ahead of the announcement had anticipated a reduction closer to $8 per barrel. The actual figure exceeded those expectations by a considerable margin, signalling that Aramco's intent was not merely competitive adjustment but aggressive volume recovery.
The $21-per-barrel swing from May's record premium of +$19.50 to August's discount of -$1.50 represents one of the most compressed pricing cycles in the modern history of the crude oil market. Understanding what drove that arc is essential to interpreting what comes next.
What Structural Forces Are Driving Saudi Arabia to Aggressively Discount Its Crude?
The Hormuz Disruption and Its Aftermath
The origin of the current pricing cycle traces back to the effective closure of the Strait of Hormuz following the U.S. and Israeli military strikes on Iran on 28 February 2026. The Strait, through which approximately 20% of the world's seaborne crude transits daily, was rendered inaccessible for normal commercial navigation during the height of the conflict period.
Saudi Aramco responded by redirecting export flows through the Yanbu terminal on the Red Sea, keeping volumes moving but at dramatically increased logistical complexity and cost. Asian refiners willing to purchase during this period absorbed those costs in the form of record OSP premiums. The May 2026 Arab Light OSP reaching +$19.50 per barrel above the Oman/Dubai average was not a miscalculation; it was the market-clearing price for supply during a genuine disruption.
The subsequent ceasefire agreement between the U.S. and Iran and the reopening of the Strait of Hormuz reversed the supply-shock narrative with remarkable speed. Market psychology shifted from scarcity to oversupply anticipation within weeks, even though physical supply conditions were still normalising. This compression of the narrative cycle is a characteristic feature of geopolitically-driven commodity dislocations.
Saudi Arabia's Export Volume Collapse and Recovery Arc
The human-readable consequence of the conflict period is visible in Saudi Arabia's export data, compiled by commodity flow tracking firm Kpler.
| Period | Export Volume (bpd) |
|---|---|
| Pre-conflict 3-month average | 6.55 million |
| May 2026 (record low) | 3.74 million |
| June 2026 | 4.53 million |
| Deficit vs. pre-conflict baseline | ~2.02 million bpd |
May 2026's export trough of 3.74 million barrels per day was the lowest level in Kpler's records extending to 2013. June's partial recovery to 4.53 million bpd was meaningful, but the shortfall against pre-conflict norms of roughly 6.55 million bpd remained approximately 2 million barrels per day. At prevailing crude prices, that volume gap represents billions of dollars of monthly revenue foregone.
Rebuilding those volumes requires more than supply availability. Furthermore, it requires price competitiveness sufficient to displace the alternative suppliers that Asian refiners turned to during the disruption period.
How Has China's Crude Import Behaviour Responded to Saudi Price Volatility?
China's Demand Elasticity in Action
China's response to the May 2026 OSP spike followed a well-established playbook. When crude prices rise sharply, Chinese state-controlled refiners reduce term allocations, draw down strategic reserves, and source alternative grades. The China trade impacts of broader geopolitical tensions have similarly conditioned this demand-elasticity behaviour over recent years.
| Period | Import Volume from Saudi Arabia (bpd) |
|---|---|
| Pre-conflict 3-month average | 1.48 million |
| June 2026 (12-year low) | 626,300 |
| July 2026 (estimated) | 705,000 |
| Deficit vs. pre-conflict baseline | ~775,000 bpd |
China's imports from Saudi Arabia fell to a 12-year low of 626,300 barrels per day in June 2026, according to Kpler data. The broader picture was equally striking: total Chinese seaborne crude arrivals in June reached approximately 5.91 million barrels per day, the lowest level in Kpler records since January 2016.
By July 2026, early estimates pointed to a modest recovery in Chinese purchases from Saudi Arabia to around 705,000 barrels per day. However, this remained less than half the pre-conflict average of 1.48 million barrels per day, illustrating the depth of the realignment that the August OSP cut must overcome.
Will the August OSP Cut Be Sufficient to Restore Chinese Buying?
This is the central question facing the crude market in the near term, and the honest answer involves several competing variables. Chinese state-controlled refiners operate on term contract structures. Restoring full allocations is not simply a matter of accepting an attractive price; it involves scheduling decisions made weeks in advance, refinery configuration constraints, and assessments of competing alternatives.
The $1.50-per-barrel discount to Oman/Dubai is a meaningful shift, but it must be evaluated against what Kuwait, Iraq, and the UAE are offering simultaneously. A less widely discussed dynamic is the role of China's strategic petroleum reserve filling behaviour during periods of low pricing. Historical precedent from 2015 and 2020 demonstrates that Chinese authorities have used price dislocations to accelerate SPR injections, creating incremental demand that goes beyond commercial refinery operations.
A deeper structural question now confronts the market: whether Chinese refiners will rebuild Saudi Arabia's allocations to pre-conflict levels, or whether the disruption period accelerated a diversification strategy that was already quietly underway before February 2026.
The Competitive Landscape: Which Middle East Producers Are Challenging Saudi Arabia for Asian Market Share?
The UAE's Aggressive Expansion Posture
Perhaps the most consequential variable in Saudi Arabia's volume recovery calculation is the positioning of the UAE. Abu Dhabi National Oil Company is targeting crude production capacity of 5 million barrels per day by 2027, up from pre-conflict export levels of approximately 3.5 million barrels per day.
Critically, the UAE formally withdrew from OPEC+ in May 2026. That decision granted ADNOC full pricing and volume flexibility outside the cartel's production discipline framework. Traders have reported UAE crude being offered at discounts substantially deeper than the $1.50-per-barrel differential announced by Aramco for August, with some estimates placing UAE grade discounts at several dollars per barrel.
This creates a direct and immediate competitive problem for Saudi Arabia's recovery ambitions. Consequently, even after the largest OSP cut in over two decades, Saudi crude may still be more expensive to Asian refiners than comparable UAE grades on a netback basis.
Iraq, Kuwait, and the Fracturing of GCC Pricing Discipline
The competitive pressure does not originate solely from the UAE. Both Iraq and Kuwait are offering Middle East grades at discounts that undercut the August OSP, according to market participants. This represents a structural shift in the intra-regional pricing discipline that once underpinned OPEC market influence and the cartel's market management credibility.
| Crude Grade | Producer | Estimated Discount vs. Oman/Dubai |
|---|---|---|
| Arab Light | Saudi Arabia | -$1.50/barrel |
| UAE grades (ADNOC) | UAE | Several dollars/barrel (trader estimates) |
| Kuwait Export Crude | Kuwait | Competitive discount (unconfirmed) |
| Basrah Light | Iraq | Competitive discount (unconfirmed) |
| African spot grades | Various | Market-dependent |
Beyond the Middle East, African exporters and Western Hemisphere producers, including U.S. shale grades and Latin American crudes, remain price-competitive benchmarks against which Asian refiners can evaluate every Saudi cargo. The global crude market has entered a phase of intensified market-share competition across multiple producing regions simultaneously, and Saudi Arabia is not the only seller with volume to place.
Scenario Modelling: Three Possible Market Trajectories Following the OSP Cut
Scenario 1: Successful Volume Recovery (Base Case)
Under this pathway, the $11-per-barrel reduction proves sufficient to attract Chinese state refiners back toward full term allocations by late Q3 2026. Saudi export volumes recover toward the 6 million barrels per day range by Q4 2026. Competing Middle East producers hold their discount levels steady rather than escalating further, and the Strait of Hormuz remains fully operational under the ceasefire framework.
Market outcome: Gradual price stabilisation; Brent crude finds a floor in the mid-$60s range as the oversupply narrative is partially offset by recovering demand from Asian buyers.
Scenario 2: Competitive Escalation (Downside Case)
Under this pathway, the UAE, Iraq, and Kuwait respond to the August OSP cut by deepening their own discounts, triggering a market-share price war across Middle East exporters. Chinese refiners exploit the competitive environment to delay volume commitments, extracting maximum concessions from multiple sellers simultaneously before locking in allocations.
Market outcome: Sustained downward pressure on global crude benchmarks; Brent tests sub-$60-per-barrel territory as the combined weight of competing discounts compresses the global price floor. Understanding crude oil price volatility becomes increasingly critical for market participants navigating this environment.
Scenario 3: Geopolitical Reversal (Tail Risk)
Under this pathway, the U.S.-Iran ceasefire breaks down before a formal and durable agreement is reached. Renewed conflict or contested Hormuz access could rapidly reverse the supply-normalisation narrative that the August OSP cut is predicated upon.
Market outcome: A sharp price spike; Saudi Arabia reverses course and reinstates OSP premiums to reflect renewed supply scarcity and rerouting costs through Yanbu.
The entire pricing architecture of the August 2026 OSP rests on a single geopolitical assumption: that the Strait of Hormuz remains fully and sustainably open. Markets are pricing as though that assumption is settled. It is not.
The next major ASX story will hit our subscribers first
What Does the OSP Reduction Signal About OPEC+ Strategy and Saudi Arabia's Fiscal Priorities?
The Market Share vs. Price Support Dilemma
Saudi Arabia's fiscal breakeven oil price is estimated at above $80 per barrel by multiple sovereign credit analysts, including assessments that factor in Vision 2030 investment requirements. The decision to aggressively discount crude to Asian buyers therefore carries direct fiscal consequences that extend beyond the oil ministry's mandate.
Prioritising volume recovery through deep OSP cuts accepts near-term revenue compression in exchange for the longer-term strategic objective of rebuilding buyer relationships and market share. This is a rational trade-off if the volume recovery materialises quickly, but becomes increasingly costly the longer the discount environment persists. The official selling prices mechanism across energy commodities reflects similar tensions between competitive positioning and revenue objectives.
OPEC+ Cohesion Under Accelerating Strain
The UAE's departure from OPEC+ in May 2026 removes a significant and growing producer from the cartel's output management framework. Remaining members now face a coordination challenge with no obvious resolution: individual incentives to discount and capture share conflict with the collective interest in price support.
The 2026 situation differs from the 2020 price war in important structural ways. In 2020, Saudi Arabia deliberately flooded the market after a breakdown in OPEC+ negotiations with Russia, making the oversupply a policy choice. In 2026, however, the volume loss was externally imposed by geopolitical disruption rather than a deliberate production increase. The demand-side response from Asian buyers is following a remarkably similar pattern: sharp import compression during the price spike, followed by strategic patience ahead of opportunistic buying as prices retreat.
How Should Asian Refiners and Energy Traders Interpret the August OSP Signal?
Refinery Margin Implications and Procurement Strategy
Asian refiners who maintained term contract allocations through May and June 2026 absorbed the full weight of the $19.50-per-barrel OSP premium, compressing processing margins to levels that made Arab Light economics extremely challenging relative to alternative grades. The August discount partially restores those economics, but the netback calculation still depends on processing configuration and the competing offers available from other origins.
For traders with flexible procurement frameworks, the current environment presents a distinct set of considerations:
- Term contract holders benefit directly from the August OSP reduction on their allocated volumes, but must assess whether full allocation restoration makes sense given competing grade availability.
- Spot market participants can exploit divergences between OSP-based term pricing and cargo-level spot offers, which may price differently depending on scheduling and loading constraints.
- Refinery schedulers need to evaluate Arab Light's August netback against UAE, Kuwaiti, Iraqi, and African alternatives on a delivered cost basis, not simply on the headline OSP differential.
- Strategic reserve operators, particularly Chinese state entities, may find the current price environment attractive for SPR injection programmes, creating incremental demand that could tighten the spot market faster than commercial refinery flows alone would suggest.
The August 2026 OSP cut is historically significant in absolute terms. In fact, as noted by the Times of India, this represents the biggest reduction in over 20 years. Its ultimate effectiveness as a volume recovery instrument, however, depends on variables that extend well beyond Saudi Arabia's pricing desk, including competitor responses, the durability of the Hormuz ceasefire, and the procurement calculus of Chinese state refiners who now have more supplier alternatives than at any previous point in their history.
Frequently Asked Questions: Saudi Arabia Cuts Crude Oil Prices for Asia
What is the OSP and why does it matter for Asian crude buyers?
The Official Selling Price is a monthly differential published by Saudi Aramco that sets the effective purchase price for term contract volumes relative to a benchmark grade. For Asian buyers, the relevant benchmark is the Oman/Dubai average. The OSP is the primary mechanism through which Aramco manages competitive positioning across its major customer regions.
How large was the August 2026 OSP cut for Asia?
The reduction for Asian buyers was $11 per barrel, setting Arab Light at a $1.50-per-barrel discount to the Oman/Dubai benchmark. This is the largest single-month OSP cut in at least 26 years of recorded data and brought the absolute OSP to its lowest level since June 2020.
Why did Saudi Arabia implement such a large OSP reduction?
The cut reflects a combination of factors: the need to recover export volumes that collapsed during the Strait of Hormuz disruption, competitive pressure from UAE grades being offered at deeper discounts following the UAE's exit from OPEC+, and the need to rebuild Chinese import allocations that fell to 12-year lows in June 2026. Consequently, when Saudi Arabia cuts crude oil prices for Asia at this scale, it signals a genuine strategic shift rather than a routine adjustment.
Does the August OSP cut guarantee a recovery in Saudi crude volumes?
Not necessarily. The effectiveness of the cut depends on whether competing producers hold their own discount levels steady, whether Chinese refiners restore full allocations or continue gradual diversification, and whether the Strait of Hormuz remains fully operational under the current ceasefire framework.
How does the 2026 pricing cycle compare to the 2020 oil market?
The two periods share superficial similarities, including oversupply narratives, benchmark discounts, and compressed Asian demand. However, 2020 involved deliberate Saudi production increases during an OPEC+ breakdown, while 2026 involves a forced export disruption followed by a recovery effort. The buyer behaviour patterns are similar; the supply-side causation is structurally different.
Disclaimer: This article is intended for informational purposes only and does not constitute financial or investment advice. Forecasts, scenario projections, and market outcome descriptions involve inherent uncertainty and should not be relied upon as predictions of actual market conditions. Readers should conduct their own research and consult qualified advisers before making investment decisions related to commodity markets or energy sector assets.
Want to Stay Ahead of Major Commodity Market Shifts?
Discovery Alert's proprietary Discovery IQ model delivers real-time alerts on significant ASX mineral discoveries, instantly translating complex data across 30-plus commodities into clear, actionable investment insights — explore historic discoveries and their exceptional returns to understand the opportunity, then begin your 14-day free trial at Discovery Alert to position yourself ahead of the broader market.