July 9, 2026
Reading Industrial Pulse: Why Monthly IPI Data Tells Only Half the Story
In any mature industrial economy, the gap between short-term momentum and long-term trajectory is rarely more revealing than during periods of structural transition. When a country is simultaneously managing a commodity-dependent legacy and aggressively engineering a diversified economic future, a single month's data release can be interpreted as either a green shoot or a statistical blip. Saudi industrial output rebounds in May 2026, and this IPI release is precisely this kind of two-sided data point, demanding a layered reading rather than a surface-level verdict.
When big ASX news breaks, our subscribers know first
Why the Industrial Production Index Is More Than a Scorecard
The Industrial Production Index, commonly referred to as the IPI, is one of the most time-sensitive economic indicators available to policymakers, investors, and analysts. Unlike GDP, which captures economic output across all sectors with a significant reporting lag, the IPI is released on a relatively tight schedule and focuses specifically on physical production volumes across manufacturing, mining, utilities, and waste management.
Saudi Arabia's IPI is compiled by the General Authority for Statistics, known as GASTAT, using the International Standard Industrial Classification framework, or ISIC. This globally harmonised system allows for meaningful cross-country comparisons while ensuring that sector definitions remain consistent over time. The ISIC methodology categorises industrial activity into distinct buckets, from crude oil extraction and chemical manufacturing through to electricity generation and water treatment, enabling analysts to isolate where growth or contraction is occurring.
The preliminary nature of GASTAT's monthly releases is itself significant. Early data allows market participants to respond quickly, but it also carries revision risk. For a Kingdom where oil-sector volatility can swing aggregate figures dramatically, the preliminary IPI often understates or overstates trends that are only fully visible after subsequent revisions. Furthermore, Saudi exploration licences and broader resource policy decisions feed directly into how these figures ultimately track over time.
The Two-Speed Story Hidden Inside the May 2026 Data
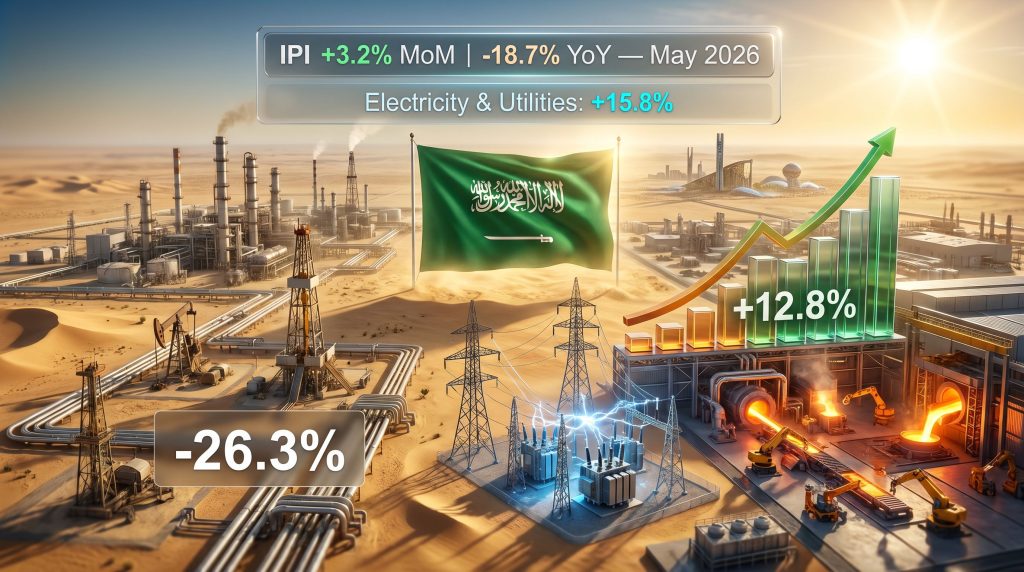
When Saudi industrial output rebounds in May on a month-on-month basis, the natural instinct is to interpret this as positive news. The 3.2% monthly gain recorded in May 2026 does indicate a broad-based directional improvement, with virtually every major industrial segment participating in the recovery from April's softer performance.
However, the annual comparison tells a substantially different story. The 18.7% year-on-year contraction in the overall IPI is not a marginal softening; it represents a deep drawdown from May 2025 levels. Understanding why these two readings can coexist requires separating the structural from the cyclical and the oil-dependent from the non-oil economy.
The monthly rebound reflects base effects, seasonal patterns, and a partial normalisation of activity following disruptions tied to the US-Iran conflict, which created significant supply chain turbulence across Middle Eastern industrial corridors during the preceding months. The annual decline, by contrast, is far more entrenched, rooted primarily in sustained OPEC+ production discipline and its cascading effects on Saudi Arabia's mining and quarrying activity.
The annual IPI figure is not a measure of economic failure. It is a measure of deliberate energy policy intersecting with external geopolitical disruption. Understanding this distinction is essential for accurate interpretation.
Sector-by-Sector Breakdown: Where the Recovery Was Strongest
The granular data released by GASTAT reveals a highly uneven recovery pattern, with certain sectors leading the monthly rebound while others continue to struggle on an annual basis.
| Industrial Sector | Monthly Change (MoM) | Annual Change (YoY) |
|---|---|---|
| Overall Industrial Production Index | +3.2% | -18.7% |
| Mining and Quarrying | +3.9% | -28.6% |
| Manufacturing | +1.6% | -6.2% |
| Electricity, Gas, Steam and Air Conditioning | +15.8% | -1.4% |
| Water Supply, Sewerage and Waste Management | +0.2% | +5.7% |
| Oil-Related Activities | +4.3% | -26.3% |
| Non-Oil Activities | +1.3% | -0.6% |
Electricity and Utilities: The Month's Clear Standout
The electricity, gas, steam, and air conditioning supply sector delivered the most striking monthly performance, surging 15.8% from April to May 2026. This kind of step-change in utility output is rarely arbitrary. It typically reflects a combination of seasonal demand acceleration, as cooling loads in Saudi Arabia intensify through May, and a recovery in industrial consumption following any disruption-related curtailments from earlier months.
From a forward-looking perspective, utility sector performance functions as a leading indicator for broader industrial activity. When power consumption climbs, it generally signals that factories, processing facilities, and infrastructure projects are ramping up operations. The May utility surge may therefore be signalling broader industrial momentum that will only become visible in subsequent monthly readings.
Mining and Quarrying: Monthly Recovery Against a Severe Annual Backdrop
Mining and quarrying posted a 3.9% monthly improvement, the second-strongest sectoral gain after utilities. Yet this needs to be read against an annual decline of 28.6%, which is among the sharpest contractions recorded across any major sector in recent Saudi industrial history. The depth of the annual decline here is almost entirely attributable to reduced crude oil extraction volumes linked to OPEC+ quota compliance, with Saudi Arabia having shouldered a disproportionate share of voluntary production cuts within the alliance framework.
This creates an important analytical distinction: the mining sector is not structurally impaired. It is operationally constrained by a coordinated international production agreement. If OPEC+ were to unwind or relax its current production discipline, the annual IPI for mining could recover rapidly, potentially within one to two reporting cycles. In addition, Saudi mining licences continue to attract international attention as the Kingdom's underlying resource base remains largely underexplored.
Manufacturing Sub-Sectors: A Tale of Divergence
Within manufacturing, the 1.6% monthly gain masks significant variation between sub-sectors. Breaking down the annual performance reveals where structural pressures are most acute:
- Coke and refined petroleum products fell 16.7% year-on-year, the largest single drag within manufacturing, reflecting the interconnection between refinery throughput and upstream crude availability
- Chemicals and chemical products contracted 4.0% annually, consistent with weaker feedstock availability and softer global petrochemical demand
- Food products manufacturing declined 3.5% year-on-year, a more domestically driven contraction potentially linked to supply chain disruptions and input cost pressures
- Basic metals manufacturing grew 12.8% annually, the only major manufacturing sub-sector to post annual growth and a notable outlier in an otherwise contracting industrial landscape
The basic metals expansion is particularly worth examining. Steel and aluminium production in Saudi Arabia feeds directly into the construction and infrastructure pipeline that Vision 2030 giga-projects generate. Domestic basic metals producers appear to be capturing a growing share of this demand, insulating them from the broader industrial contraction.
Oil vs. Non-Oil: The Strategic Divide That Matters Most
For investors and policymakers monitoring Saudi Arabia's diversification trajectory, the most consequential comparison in the May 2026 data is not between monthly and annual IPI figures. It is between the oil and non-oil industrial indices.
| Metric | Oil Activities | Non-Oil Activities |
|---|---|---|
| Monthly Change (May vs. April 2026) | +4.3% | +1.3% |
| Annual Change (May 2026 vs. May 2025) | -26.3% | -0.6% |
The 26.3% annual contraction in oil-related activities accounts for the overwhelming majority of the headline IPI decline. Strip this out, and the non-oil industrial sector contracted by only 0.6% annually, a figure that is statistically close to flat and arguably within the margin of measurement uncertainty given the preliminary nature of GASTAT's data.
This near-flat non-oil performance is, in the context of a regional conflict disrupting supply chains and a global industrial environment facing significant headwinds, a quiet but meaningful signal. It suggests that Saudi Arabia's non-oil industrial base has demonstrated a degree of resilience that the headline IPI number completely obscures. This resilience is also consistent with broader global trends around the critical minerals transition, where economies are actively repositioning their industrial bases away from singular commodity dependence.
A -0.6% annual reading in non-oil industrial output, recorded during a period of regional geopolitical disruption, may ultimately be remembered as a more significant data point than the headline -18.7% once the oil sector's OPEC+ constraints are unwound.
What Is Driving the Annual Decline? Structural vs. Cyclical Forces
Correctly categorising the causes of Saudi Arabia's annual industrial contraction is essential for forming accurate forward projections. The key drivers can be separated into two distinct categories:
Cyclical and Policy-Driven Factors:
- OPEC+ voluntary production cuts reducing crude extraction volumes and consequently suppressing mining, quarrying, and refinery activity
- Post-conflict supply chain normalisation still underway following US-Iran military engagement that disrupted regional logistics networks
- Seasonal and monthly variation effects that distort annual comparisons when disruptions occur in the base period
Structural Transition Factors:
- The deliberate reorientation of the Saudi industrial base away from hydrocarbon-intensive production toward diversified manufacturing
- Rising capital allocation toward non-oil sectors including metals, food processing, and utilities infrastructure
- A growing domestic construction pipeline driving demand for locally produced industrial inputs
The distinction matters because cyclical factors tend to self-correct as policy conditions change, while structural transitions are longer-duration processes. Saudi Arabia's current IPI profile appears to be a combination of both, with the oil sector drag being predominantly cyclical and the non-oil resilience reflecting genuine structural progress. Consequently, the Kingdom's ambitions around green iron production and low-carbon metals manufacturing add another dimension to this structural reorientation.
The next major ASX story will hit our subscribers first
Saudi Arabia's Industrial Position Within the Broader GCC Context
Saudi Arabia's industrial rebound in May does not occur in isolation. Across the Gulf Cooperation Council, industrial and project activity has remained relatively elevated despite regional uncertainty. Saudi Arabia's positioning as the dominant GCC projects market, confirmed by Kamco Invest data showing the Kingdom leading the GCC project pipeline in the second quarter of 2026, provides important context for interpreting the basic metals outperformance and the resilience of non-oil manufacturing.
Project award volumes in Saudi Arabia translate directly into industrial demand with a lag of roughly six to eighteen months, depending on project type and procurement timelines. If Q2 2026 project awards remain strong, downstream industrial sectors including basic metals, construction materials, electrical equipment, and industrial chemicals should see sustained demand through late 2026 and into 2027.
The IMF's upward revision of Saudi Arabia's 2027 growth forecast to 5.5%, issued in July 2026, reflects institutional confidence in the Kingdom's medium-term economic trajectory. This revised forecast signals that multilateral economic institutions view the current industrial weakness as a transitional phase rather than a structural deterioration. Furthermore, the Kingdom's push toward green metals leadership reinforces the long-term industrial ambition underpinning these projections.
Three Forward Scenarios for Saudi Industrial Output in H2 2026
Given the data available, three plausible trajectories exist for Saudi industrial performance through the remainder of 2026:
Scenario 1: Geopolitical Stabilisation Drives Accelerated Recovery
Regional supply chain normalisation following the US-Iran conflict removes one of the key headwinds to manufacturing throughput. Oil-related IPI gradually narrows its annual gap as production quota decisions shift, potentially allowing the headline IPI to recover toward single-digit annual declines by Q4 2026.
Scenario 2: Sustained OPEC+ Discipline Maintains Annual Weakness
Production curtailments remain in place through H2 2026, keeping mining and quarrying indices deeply negative on an annual basis. Non-oil manufacturing sustains modest positive or flat performance, driven by domestic infrastructure demand. The headline IPI remains in double-digit annual decline territory through year-end.
Scenario 3: Non-Oil Industrial Breakout Driven by Giga-Project Acceleration
Basic metals, construction materials, and industrial chemicals record accelerating growth as Vision 2030 project pipelines intensify procurement. Non-oil IPI turns positive on an annual basis by Q4 2026, providing a partial offset to ongoing oil-sector weakness and establishing a new baseline for diversified industrial growth.
Key Indicators to Watch Through Late 2026
Investors and analysts tracking Saudi industrial momentum should monitor the following signals over the coming months:
- Monthly GASTAT IPI releases for June through August 2026, which will confirm whether the May recovery has sustained momentum
- OPEC+ production quota decisions and any signals of relaxation that could rapidly reverse the mining and quarrying annual decline
- GCC project award volumes, particularly in Saudi Arabia, as a leading demand indicator for downstream manufacturing
- Utility sector output as an early-warning signal for broader industrial activity levels
- Basic metals production trajectory as a proxy for the pace of Vision 2030 construction absorption
What the May 2026 Data Ultimately Reveals
When Saudi industrial output rebounds in May with a 3.2% monthly gain, the most informed reading acknowledges both what the data confirms and what it conceals. The confirmation is that broad-based directional improvement is underway, with every major industrial segment participating in the monthly recovery. The concealment is that the 18.7% annual decline is largely a function of oil policy and geopolitical disruption rather than structural industrial weakness.
The more strategically significant takeaway is buried in the sector-level detail: basic metals growing at 12.8% annually, the utility sector surging 15.8% monthly, and the non-oil industrial base holding within 0.6% of prior-year levels despite a period of considerable regional turbulence. Taken together, these data points suggest that Saudi Arabia's industrial diversification is generating genuine traction, even if the headline IPI continues to be overwhelmed by the outsized weight of oil-related activity contraction. Tracking these trends over time via resources such as Trading Economics' Saudi industrial data provides useful longitudinal context for analysts monitoring the Kingdom's trajectory.
Readers seeking further context on Saudi Arabia's industrial and economic data can explore ongoing coverage at Arab News, which provides regular reporting on GASTAT releases and broader Saudi economic developments. This article reflects data available as of the July 2026 GASTAT preliminary release and should not be construed as financial or investment advice. Forward-looking scenarios represent analytical projections based on available information and carry inherent uncertainty.
Want to Stay Ahead of the Next Major Mineral Discovery?
Discovery Alert's proprietary Discovery IQ model delivers real-time alerts on significant ASX mineral discoveries, cutting through complex data to surface actionable opportunities the moment they are announced — explore historic discoveries and the returns they generated, then begin your 14-day free trial to position yourself ahead of the broader market.