July 11, 2026
The Geopolitics of Copper Rankings: Why Position Matters in a Decarbonising World
Global copper markets are rarely discussed in terms of national rankings, yet the hierarchy of producing nations carries consequences that extend far beyond statistical curiosity. Sovereign credit assessments, foreign direct investment decisions, and the long-term viability of national development strategies are all shaped, at least in part, by where a country sits in the global copper production table. For Peru, the question of whether it can reclaim second place in copper production has become one of the most consequential strategic challenges facing its mining sector heading into the second half of this decade.
Copper sits at the intersection of virtually every major decarbonisation technology. Each electric vehicle requires roughly 83 kilograms of copper, wind turbines demand up to 4.7 tonnes per megawatt of installed capacity, and grid-scale battery storage systems depend on copper-intensive wiring and busbars throughout their architecture. As critical minerals demand accelerates through the 2025 to 2040 period, sustained and growing copper supply becomes not just an economic objective but a geopolitical priority.
When big ASX news breaks, our subscribers know first
Where Peru Stands in 2025: The Current Global Copper Hierarchy
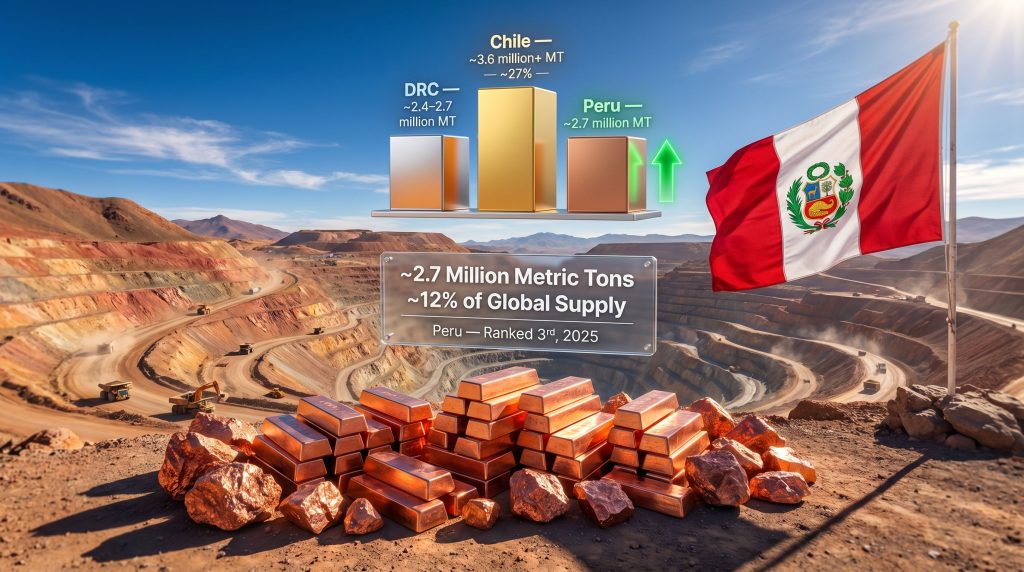
Chile retains its commanding position at the top of the global copper production table, producing an estimated 3.6 million metric tons annually and accounting for approximately 27% of global supply. The more consequential shift, however, has occurred further down the rankings.
| Rank | Country | Estimated 2025 Output | Global Share |
|---|---|---|---|
| 1 | Chile | ~3.6 million MT | ~27% |
| 2 | Democratic Republic of Congo | ~2.4–2.7 million MT | ~18–20% |
| 3 | Peru | ~2.7 million MT | ~12% |
| 4 | China | ~2.0 million MT | ~15% |
Sources: Wood Mackenzie, USGS, GlobalData (2025 estimates)
Peru's 2025 output declined by approximately 40,000 metric tons compared to 2024, a directional move that signals structural pressure rather than a one-year anomaly. More significantly, the Democratic Republic of the Congo has emerged as a genuine competitor within the same production band, with both nations operating within overlapping output ranges since roughly 2022. This proximity makes the ranking highly sensitive to year-on-year fluctuations at individual mine sites, creating a competitive dynamic that plays out almost continuously.
How the DRC Overtook Peru: Capital, Scale, and Strategic Investment
The Mechanics of the DRC's Ascent
The DRC's copper production growth has not been accidental. It reflects a deliberate, capital-intensive expansion strategy concentrated in the Katanga Province, where deposits of the Central African Copperbelt rank among the highest-grade copper ore bodies on Earth. Grades at major DRC operations frequently exceed 2% copper, compared to the average head grades at many Peruvian porphyry copper deposits, which typically range from 0.4% to 0.8%. Higher ore grades translate directly into lower unit production costs and faster payback periods on capital investment, making DRC projects attractive even under conditions of political and infrastructure risk.
Wood Mackenzie projected as early as 2022 that the DRC would surpass Peru's output by 2026 to 2027. That timeline appears to have arrived ahead of schedule, driven primarily by Chinese state-affiliated capital that has funded large-scale mine expansions with a speed and scale that Western-aligned development finance has not matched in the region. Furthermore, the broader implications of this shift in mining geopolitics are difficult to overstate for long-term supply chain planning.
The DRC's competitive advantage is not regulatory certainty or infrastructure quality. It is ore grade and the willingness of strategic capital to absorb elevated political risk in exchange for volume and resource control.
Why Peru's Output Has Stalled: A Multi-Layered Problem
Peru's production challenges cannot be reduced to a single cause. They reflect an accumulation of structural constraints that have compounded over several years:
- Social licence erosion: Community-led opposition and protest-related suspensions have intermittently halted or curtailed output at major producing operations, including disruptions that have affected some of the country's largest mines.
- Permitting friction: Environmental impact assessment processes in Peru can extend to ten years or more from submission to approval, creating a structural bottleneck that delays the conversion of geological resource into productive capacity.
- Infrastructure deficits: High-altitude mining corridors in the Andes face chronic limitations in road access, energy supply, and port connectivity, increasing operating costs and reducing the economic viability of marginal deposits.
- Declining early-stage exploration investment: Reduced allocation of junior mining capital to Peruvian greenfields limits the future project pipeline, compounding medium-term supply risks.
- Political instability: Peru has experienced significant executive turnover in recent years, creating regulatory uncertainty that elevates the risk premium demanded by international project financiers.
It is worth noting that Peru's copper reserve base remains one of the largest on the planet. The binding constraints are governance, capital access, and community relations, not geology.
Peru's Historical Precedent: A Country That Has Done This Before
Peru's ascent to second-place producer status in the 2016 to 2017 period was not the result of passive resource endowment. It was engineered through a coordinated wave of major new mine commissioning, including the ramp-up of large-scale porphyry copper operations that added hundreds of thousands of metric tons of annual capacity within a relatively compressed timeframe.
This historical precedent is critically important: Peru has demonstrated the institutional and operational capacity to structurally shift its global ranking through deliberate capital mobilisation. According to mining production data for Peru, the question for the 2025 to 2030 period is whether that achievement can be repeated under more challenging political and social conditions.
Three Scenarios for Reclaiming Peru's Second-Place Ranking
Modelling Peru's path back to second place in copper production requires differentiating between scenarios that vary by policy ambition, capital mobilisation, and DRC trajectory. Three distinct pathways emerge:
Scenario 1: Base Case, Incremental Recovery (2026 to 2028)
Existing operations stabilise following partial resolution of community conflicts. No major new mines enter production. Output recovers modestly toward 2.8 to 2.9 million metric tons. Under this scenario, second-place recapture is unlikely unless the DRC experiences significant operational disruption.
Scenario 2: Moderate Case, New Project Commissioning
Two to three mid-tier copper projects advance through permitting and reach early production by 2027 to 2028. Combined with operational recovery, Peru's output approaches 3.0 to 3.2 million metric tons. Second-place recapture becomes plausible if DRC growth plateaus or faces logistics-driven production constraints.
Scenario 3: Accelerated Case, Institutional Capital and Policy Reform
Development finance institutions deploy structured financing instruments to unlock stalled projects. Peru enacts material regulatory reform that compresses permitting timelines and establishes a standardised community engagement framework. A coordinated national copper strategy targets 3.4 million metric tons or more by 2029 to 2030, creating a credible pathway to challenge the DRC's ranking over the medium term.
The Role of Development Finance in Unlocking Peru's Pipeline
Why Multilateral Lenders Are Positioned to Act
Development finance institutions such as IDB Invest, the International Finance Corporation, and the U.S. Development Finance Corporation have increasing strategic rationale to engage with Peru's copper sector. Their mandates link directly to critical mineral supply chain security, Latin American economic development, and the financing of energy transition infrastructure — all of which converge on copper production capacity.
The financing instruments available to these institutions are particularly well-suited to Peru's specific bottlenecks:
- Long-tenor project finance that accommodates the 20 to 30 year mine life cycles that commercial banks are increasingly reluctant to underwrite alone.
- Blended finance structures that use concessional capital to de-risk the first-loss tranche, enabling private co-investors to deploy capital at acceptable risk-adjusted returns.
- Technical assistance and capacity-building grants that strengthen community engagement processes and support regulatory reform at the institutional level.
- Policy advisory support that helps governments develop stable fiscal frameworks capable of surviving political transitions.
The Leverage Effect: Multiplying Capital Through Risk Mitigation
A well-structured multilateral financing facility has the potential to multiply private sector co-investment significantly. A hypothetical US$500 million development finance commitment directed at Peruvian copper infrastructure, community engagement programmes, and project-level de-risking could credibly catalyse US$2 to 3 billion in private co-investment by reducing the political risk premium embedded in project discount rates.
For mining projects where internal rate of return thresholds typically require 15% or higher to proceed, even a two to three percentage point reduction in the perceived risk premium can shift marginal projects from unviable to investable. Consequently, those exploring copper investment strategies should monitor how development finance commitments evolve in this space.
The next major ASX story will hit our subscribers first
Peru vs. the DRC: A Structural Competitive Analysis
| Dimension | Peru | Democratic Republic of Congo |
|---|---|---|
| 2025 Estimated Output | ~2.7 million MT | ~2.4–2.7 million MT |
| Primary Investment Source | Diversified global majors | Predominantly Chinese capital |
| Ore Grade Profile | 0.4%–0.8% Cu (porphyry) | 2%+ Cu (sediment-hosted) |
| Governance Risk | Moderate-High (social conflict) | High (political instability) |
| Infrastructure Maturity | Moderate | Low-Moderate |
| ESG Compliance Capacity | Moderate-High | Variable |
| Growth Trajectory (2025–2030) | Recovery-dependent | Expansion-oriented |
This comparison reveals a nuanced competitive picture. The DRC's geological advantage in ore grade is significant and structurally enduring. However, Peru's comparative strengths in ESG compliance, rule of law, and Pacific export logistics offer a genuinely differentiated value proposition for investors who require bankable projects that meet international environmental and social performance standards.
Mining majors and development finance institutions subject to stringent ESG reporting obligations are increasingly unable to deploy capital in environments where those standards cannot be reliably demonstrated. In addition, the copper supply crunch anticipated through this decade only heightens the urgency of resolving Peru's structural constraints.
What Government Signals Mean for Investor Confidence
Peru's Mining Ministry has publicly stated its ambition to reclaim second-place copper producer status. Ministerial intent carries real signalling value, but experienced mining investors apply a credibility discount to policy statements that are not backed by legislative action or institutional reform. In a country that has cycled through multiple presidents and mining ministers within a single electoral term, the durability of any given policy commitment is inherently uncertain.
What the market needs to see to re-rate Peru's investment attractiveness includes:
- Measurable reductions in permitting timelines, with statutory timeframes enforced and publicly tracked.
- A national community engagement framework that standardises the free, prior, and informed consent process and creates predictable outcomes for project developers.
- Fiscal stability agreements that protect project economics across 20 to 30 year mine life cycles, independent of changes in government.
- Infrastructure investment commitments in key Andean mining corridors that demonstrably reduce logistics costs.
- Transparent and consistent application of environmental regulations, reducing the risk of retroactive licence modifications.
The Chile copper outlook offers an instructive governance benchmark. Regulatory predictability, long-term infrastructure planning, and consistent fiscal policy have been as important to Chile's output leadership as its geological endowment. Peru has the geology. Closing the governance gap is the work that remains.
Frequently Asked Questions: Peru's Copper Production Ranking
Is Peru currently the second-largest copper producer in the world?
As of 2025, Peru ranks third globally, having been surpassed by the Democratic Republic of the Congo. Chile remains the world's largest producer. Peru produced approximately 2.7 million metric tons in 2025, representing roughly 12% of global supply. For broader context on global copper producer rankings, independent data sources confirm this competitive positioning.
When did Peru last hold second place in copper production?
Peru climbed to second place during the 2016 to 2017 period by surpassing both the United States and China through a wave of new mine commissioning. It retained that position for several years, with the DRC's accelerating output subsequently displacing it from the ranking.
Why does ranking position matter economically for Peru?
Copper is Peru's largest export commodity. Ranking position directly influences sovereign credit assessments, FDI attractiveness, export revenue projections, and fiscal capacity. A sustained decline to third place communicates structural competitiveness concerns to international investors and development finance institutions, potentially raising the cost of sovereign borrowing and reducing the pipeline of new mining investment.
What would Peru need to produce to reclaim second place?
Peru would need to sustain output above the DRC's trajectory, likely targeting 3.0 million metric tons or more, while either growing its own production through new project commissioning or benefiting from DRC operational disruptions. Achieving this would require regulatory reform, new capital mobilisation, and the resolution of long-standing community engagement challenges.
The Strategic Verdict: Achievable, Not Inevitable
Peru possesses the geological endowment, the existing operational infrastructure, and the diversified investor relationships to make a genuine case for reclaiming second place in copper production within the current decade. The ore is in the ground. The infrastructure foundations exist. The investor interest, particularly from capital seeking ESG-compliant copper projects with Pacific export access, is real.
What is missing is the policy coherence and institutional follow-through to convert these advantages into productive capacity at scale. The 2026 to 2030 window is critical. Copper demand projections tied to the global energy transition accelerate meaningfully through this period, amplifying both the opportunity cost of inaction and the potential reward for successful delivery.
Whether Peru reclaims its ranking will ultimately be determined not by the richness of its mineral endowment, but by the quality, consistency, and credibility of the decisions made at the policy and capital deployment level above ground.
This article is intended for informational purposes only and does not constitute investment advice. Production figures and scenario projections are based on publicly available estimates and industry sources including Wood Mackenzie, USGS, and GlobalData. Forecasts involve inherent uncertainty and actual outcomes may differ materially from those described.
Want to Track the Next Major Copper Discovery Before the Broader Market Does?
Discovery Alert's proprietary Discovery IQ model scans ASX announcements in real time, instantly identifying significant mineral discoveries — including copper — and converting complex data into actionable investment insights for traders and investors at every level. Explore how major discoveries have historically delivered substantial returns on Discovery Alert's dedicated discoveries page, and begin your 14-day free trial today to position yourself ahead of the market.