June 27, 2026
The Invisible Architecture of Monetary Erosion
Every monetary system ever devised by a sovereign authority contains a structural feature that benefits the issuer at the expense of the holder. This is not a conspiracy or a policy error. It is the foundational arithmetic of currency creation itself. Long before central bank balance sheets and quantitative easing entered the financial lexicon, the same mechanism operated through clay tablets, silver coins, and paper notes. The names changed. The institutions evolved. The underlying wealth transfer did not.
Understanding seigniorage and gold inflation hedge dynamics is not merely an academic exercise. It is the starting point for any serious analysis of why purchasing power erodes across generations, why history's monetary collapses follow a recognisable pattern, and why a metal that cannot be legislated into existence has outlasted every fiat currency ever created.
When big ASX news breaks, our subscribers know first
Seigniorage: The Revenue Engine Inside Every Fiat Currency
Physical and Monetary Seigniorage: Two Mechanisms, One Outcome
Seigniorage derives from the Old French seigneur, the feudal lord who held exclusive minting rights within his domain. That lord's privilege was not merely the right to produce coins. It was the right to profit from producing them, capturing the gap between the coin's face value and the cost of its metal and manufacture. Seven centuries later, the institutional wrapper has been replaced by central bank balance sheets and congressional mandates, but the profit architecture is identical.
Modern seigniorage operates through two distinct channels:
-
Physical seigniorage refers to the profit captured at the point of currency note production. According to the Federal Reserve's 2025 Currency Budget, a $100 bill costs the U.S. Bureau of Engraving and Printing approximately 11.3 cents to produce. The government spends roughly one-tenth of a cent per dollar of face value and acquires full purchasing power in return.
-
Monetary seigniorage operates at a larger scale and is less visible. When the Federal Reserve creates new reserve balances to purchase U.S. Treasury securities, it earns interest income on those assets. After operating expenses, net earnings are remitted to the Treasury as revenue. At the Fed's post-COVID peak in early 2022, its balance sheet stood at $8.9 trillion (Federal Reserve, May 2022 Balance Sheet Report), representing the largest single episode of balance sheet-driven seigniorage in American history.
Most savers measure purchasing power through transactional terms, asking whether their dollars can buy the same goods this month as last month. The more consequential measurement is structural purchasing power: the cumulative erosion that occurs across decades as money supply growth consistently outpaces real economic output. Seigniorage operates at the structural level, invisibly and continuously.
How Seigniorage Translates Into Purchasing Power Erosion
The Transmission Mechanism: From Reserve Creation to Consumer Prices
The pathway from money creation to price level is not instantaneous, but it is systematic. Understanding the chain helps investors recognise why the effects appear gradual on a monthly basis yet become catastrophic across decades.
The sequence works as follows:
- The central bank acquires assets, typically government bonds, by creating new electronic reserve balances rather than drawing on existing funds.
- These expanded reserves support broader credit creation across the commercial banking system, multiplying the effective money supply.
- When money supply growth outpaces real GDP growth, the same quantity of goods is pursued by a larger volume of monetary claims.
- Nominal prices rise to restore equilibrium between goods and money, while wages and savings balances lag behind, collecting the implicit tax.
The 55-year empirical record since the end of the gold standard in August 1971 makes this transmission visible in the data. Furthermore, the end of the gold standard marked a decisive inflection point in the history of monetary sovereignty:
| Metric | 1971 | 2026 | Change |
|---|---|---|---|
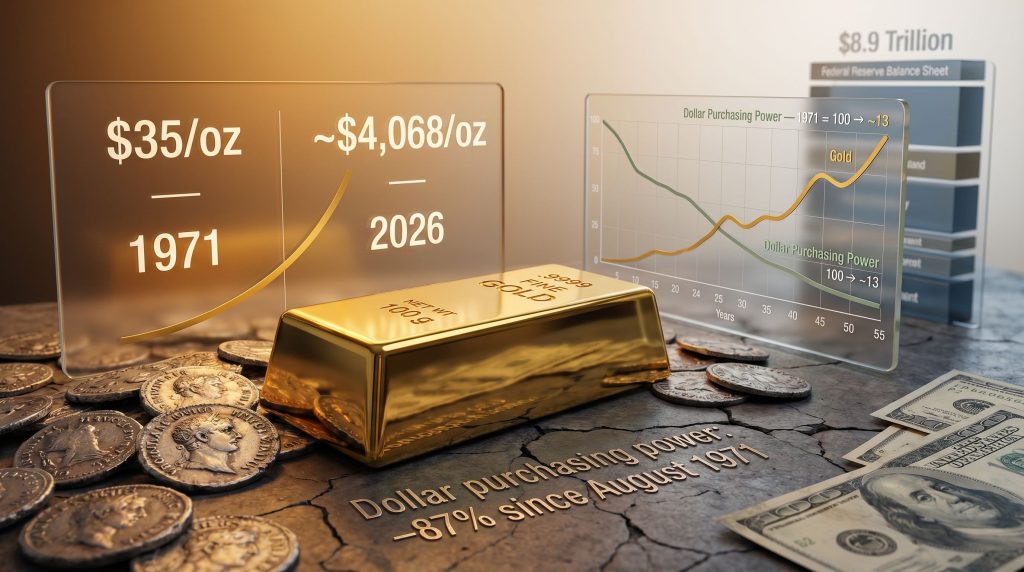
| Gold price per ounce | $35 (Bretton Woods fixed rate) | ~$4,068 | +11,523% |
| Dollar purchasing power (1971 = 100) | 100 | ~13 | -87% |
| Average annual CPI inflation (post-1971) | N/A | ~3.8% cumulative average | BLS CPI-U |
| Average annual CPI inflation (gold standard, 1880-1914) | ~0.1% | N/A | EconLib |
Since August 1971, the dollar has lost approximately 87% of its purchasing power, while gold has risen from $35 per ounce to approximately $4,068 as of June 2026 (BLS CPI-U; goldsilver.com/price-charts/). An item that cost $1.00 in 1971 requires roughly $8.00 today. Gold's purchasing power, measured in real goods, has remained broadly stable across the same period.
Why Headline CPI Understates the True Seigniorage Burden
One of the least appreciated dimensions of seigniorage analysis is that the Consumer Price Index captures only a portion of its effects. Monetary expansion does not flow uniformly into consumer goods baskets. A significant share inflates asset prices, specifically housing, equities, and financial instruments, rather than the goods and services that CPI tracks.
This distinction matters for investors evaluating seigniorage and gold inflation hedge dynamics. Research indicates that only approximately 16% of gold's price movements since 1971 are statistically attributable to changes in the CPI (academic monetary economics literature). The remaining 84% reflects real yield compression, monetary credibility dynamics, and reserve diversification behaviour across sovereign institutions. Gold is not primarily tracking reported consumer inflation. It is tracking the structural integrity of the monetary system itself.
Rome's Denarius: A Controlled Historical Experiment in Seigniorage Abuse
The Debasement Timeline as a Data Series
The Roman silver denarius offers the most thoroughly documented case study in what happens when a monetary authority extracts seigniorage beyond the system's tolerance threshold. Unlike modern monetary episodes, the physical evidence survives in numismatic records, making it possible to construct a near-complete debasement timeline:
| Period | Emperor | Approximate Silver Purity |
|---|---|---|
| 27 BC – 14 AD | Augustus | ~98% |
| 64 AD | Nero | ~93% (first deliberate reduction) |
| 193-211 AD | Septimius Severus | ~50% |
| 260s AD | Various (Crisis period) | Gold-to-silver ratio: 25:1 to 1,000:1 |
| 270s AD | Aurelian | ~2-5% |
(Source: NGC Ancients; academic numismatic records)
The pace of debasement accelerated in direct proportion to fiscal pressure. Each emperor faced the same arithmetic: military campaigns, administrative costs, and infrastructure obligations that exceeded tax revenues. The solution was always the same. Reduce the metal content. Capture the differential as revenue. Pass the diluted coin to the next transaction.
The Three-Stage Collapse Pattern That Modern Economists Recognise
What makes Rome analytically valuable is not the drama of collapse but the precision of its stages, each of which has a structural modern parallel:
-
Stage One, Silent Extraction: Early debasement goes undetected in individual transactions. Merchants accept coins at face value. The treasury captures the silver differential without triggering market reaction. This stage can persist for decades.
-
Stage Two, Market Repricing: Merchants begin discounting debased coins, raising nominal prices to compensate for reduced metal content. Soldiers demand wage increases to maintain real purchasing power. The monetary system begins to price in its own distrust.
-
Stage Three, Functional Collapse: Trade in key sectors reverts to barter. The coin loses its utility as a unit of account. Commercial networks that depended on monetary infrastructure contract or dissolve entirely.
A critical and underappreciated detail is that the gold-to-silver coin ratio shifted from 25:1 to approximately 1,000:1 during the 260s AD (The Tontine Coffee-House, citing Roman economic records). This compression reflects not merely price changes but a complete repricing of monetary trust between two metals, one of which the government could debase and one of which it could not.
The modern electronic equivalent replaces shaved silver content with incremental reserve expansion. Neither is detectable in any single transaction. Both achieve the same outcome across sufficient time horizons.
The Federal Reserve's Deferred Asset: Where Modern Seigniorage Signals Are Flashing
A Balance Sheet Under Structural Stress
Between September 2022 and late 2025, the Federal Reserve operated at a continuous loss, the result of a maturity mismatch that became impossible to ignore once interest rates rose sharply. The Fed's asset portfolio, consisting of long-duration bonds and mortgage-backed securities acquired at near-zero yields, generated fixed low returns. Its liabilities, primarily reserve balances held by commercial banks, began paying market rates.
In 2024 alone, interest payments to commercial banks on reserve balances totalled more than $186 billion (Foundation for Government Accountability, July 2025), a figure that substantially exceeded the income generated by the entire asset portfolio.
Rather than booking these losses as capital impairment, the Federal Reserve created a "deferred asset," a structurally unique accounting entry that records accumulated shortfalls as a negative liability rather than recognising them as losses requiring recapitalisation:
| Metric | Data Point | Source |
|---|---|---|
| Deferred asset peak (Q3 2025) | ~$243 billion | CRS R48390, January 2026 |
| Period of near-zero Treasury remittances | September 2022 – late 2025 | Congressional Research Service |
| Projected 2026 remittances | ~$8 billion | CBO via Peterson Foundation |
| Projected return to normal remittances | ~2030 | CBO via CRS |
| Historical normal annual remittance range | $80-$100 billion | Federal Reserve historical data |
The Fiscal Trilemma This Creates
For three consecutive years, the Fed transmitted effectively nothing to the Treasury, a revenue shortfall of roughly $80-$100 billion per year carried entirely off the official national debt ledger. This occurred simultaneously with a fiscal backdrop that offers little room for such disruptions:
-
U.S. national debt as of June 2026: approximately $39.3 trillion, accumulating at roughly $6.5 billion per day (U.S. Treasury Fiscal Data)
-
Annual federal interest costs: exceeding $1 trillion, surpassing the entire defence budget (U.S. Treasury Fiscal Data)
-
Projected CBO timeline for normal-scale remittance restoration: approximately 2030
The fiscal trilemma this creates is straightforward in structure but politically intractable in resolution. Federal obligations must be funded through some combination of additional taxation, increased borrowing, or monetary expansion. Each pathway carries distinct seigniorage or inflation implications, and none eliminates the underlying pressure.
When the Federal Reserve's remittance pipeline runs dry while federal interest costs exceed $1 trillion annually, the structural incentive to monetise a portion of that debt does not disappear. The pressure to expand the monetary base as a fiscal relief valve intensifies precisely when the traditional seigniorage revenue stream has gone quiet.
Gold as a Seigniorage and Inflation Hedge: The Honest Performance Assessment
What the Evidence Actually Shows
The case for a gold inflation hedge is frequently overstated in its short-term application and understated in its long-term structural significance. A rigorous assessment requires distinguishing between two fundamentally different risk types:
-
Cyclical inflation risk: Short-term price level increases driven by supply shocks, demand surges, or policy errors. Treasury Inflation-Protected Securities (TIPS) are mechanically designed to address this risk, adjusting principal values directly with CPI movements.
-
Structural monetary risk: The long-run erosion of purchasing power from sustained seigniorage, monetary credibility deterioration, and central bank balance sheet expansion. This is the risk gold is structurally equipped to address, and the one that TIPS cannot fully reach.
| Performance Dimension | Gold | TIPS |
|---|---|---|
| Optimal time horizon | Long-term (decades to generations) | Short-to-medium term |
| CPI correlation | Weak (~16% of price movements since 1971) | Direct (principal adjusts with CPI) |
| Primary price driver | Negative real yields; monetary trust dynamics | Consumer Price Index |
| Seigniorage exposure | None (cannot be issued or expanded) | Embedded (tied to fiat CPI measurement) |
| Income generation | None | Fixed interest payments |
| Annual supply growth | ~1-3% (mining only; geologically constrained) | Unlimited (subject to government issuance) |
| Sovereign credit risk | None | Present (government liability) |
The Gold Standard Constraint and What It Proved
Under the classical gold standard from 1880 to 1914, average annual inflation held at approximately 0.1% (EconLib, Gold Standard). This was not the result of exceptional fiscal discipline or unusually moderate governments. It was a mechanical consequence of the monetary constraint itself.
With the monetary base bounded by physical gold supply growth of roughly 1-3% annually, discretionary monetary expansion of the kind seigniorage requires was structurally impossible. The removal of that constraint in August 1971 did not immediately produce inflation. The relationship is longer-cycle.
What the 1971 inflection point removed was the only structural ceiling on how much seigniorage a government could extract over time. The 55-year record that followed reflects what happens when that ceiling no longer exists. In this context, gold as strategic investment increasingly makes sense to those studying monetary history closely.
Physical Gold's Structural Position Outside the Seigniorage System
Gold carries no seigniorage exposure by design, and understanding precisely why requires examining each component of the seigniorage mechanism:
-
Seigniorage requires a government-controlled gap between face value and production cost. Gold carries no government-assigned face value.
-
Seigniorage requires the issuing authority to control supply. Gold's annual supply growth is bounded by geological and extraction realities, not by policy decisions or legislative action.
-
Seigniorage operates through counterparty relationships, where the currency holder is a creditor of the issuing institution. Physical gold held privately has no counterparty. No institution can default on it.
Every fiat-denominated savings instrument, including bank deposits, money market funds, and government bonds, is a liability of an entity operating within the seigniorage architecture. Furthermore, gold and bond dynamics reveal that as real yields compress, gold's relative structural appeal increases considerably. Physical gold exists outside the fiat architecture entirely, which is why its purchasing power relationship across centuries is measured not in the currencies it outlasted, but in the goods it continues to command.
In addition, central bank gold demand has risen sharply in recent years, reflecting a sovereign-level recognition of these structural realities. Institutions that create fiat money are, consequently, allocating reserves to an asset that sits entirely outside the fiat system. According to research published by the World Gold Council, gold's role extends well beyond simple CPI tracking, functioning as a hedge against broader monetary system stress. Furthermore, analysis from Kinesis Money highlights that gold's scarcity and historical monetary role underpin its effectiveness as a long-term store of value.
The next major ASX story will hit our subscribers first
Frequently Asked Questions: Seigniorage and Gold as an Inflation Hedge
What Is the Difference Between Seigniorage and Inflation?
Seigniorage is the revenue mechanism, specifically the profit captured by issuing currency whose face value exceeds its cost of production. Inflation is the macroeconomic outcome, the generalised rise in price levels that occurs when money supply growth outpaces real economic output. In a growing economy, modest seigniorage can be absorbed without significant inflation. The relationship becomes destructive when seigniorage finances structural fiscal deficits rather than supporting genuine economic activity.
How Much Does the U.S. Government Earn from Seigniorage Annually?
In normal operating years, Federal Reserve earnings remittances to the Treasury, historically $80-$100 billion annually, represent the primary channel of modern seigniorage revenue. Between September 2022 and late 2025, those remittances effectively ceased as the Fed accumulated a deferred asset of approximately $243 billion (CRS R48390, January 2026). The Congressional Budget Office projects remittances of approximately $8 billion in 2026, with a return to normal-scale transfers not expected until approximately 2030.
Why Does Gold's Weak CPI Correlation Matter to Investors?
The 16% CPI correlation figure is frequently cited as evidence that gold is a poor inflation hedge. This interpretation misunderstands what gold is hedging. Gold does not track the CPI because it is not designed to hedge reported consumer price changes. It is hedging monetary system integrity, specifically the long-run risk that the institutions issuing fiat currency will extract seigniorage beyond the system's tolerance threshold. Its primary statistical correlation is with negative real yields, performing most powerfully when monetary policy is structurally unable to suppress inflation without damaging the broader economy.
Does the Roman Denarius Parallel Have Genuine Modern Relevance?
The parallel is structural rather than superficial. Rome reduced silver content by increments too small to detect in any single transaction. Modern reserve expansion occurs in monthly increments too modest to register as alarming in any single CPI release. Both mechanisms extract value from currency holders by increasing the volume of monetary claims against a real-world resource base that grows more slowly than the claims themselves. The Roman example is not historical illustration. It is a completed data series showing how the mechanism terminates when taken beyond its structural limits.
Disclaimer: This article is for informational and educational purposes only and does not constitute financial or investment advice. All data, statistics, and projections cited are sourced from publicly available records and are subject to revision. Past performance of any asset class, including gold, is not indicative of future results. Readers should consult a qualified financial adviser before making any investment decisions.
Want to Know When the Next Major ASX Mineral Discovery Hits the Market?
While understanding monetary erosion and gold's structural role as a long-term store of value is essential, Discovery Alert's proprietary Discovery IQ model delivers real-time alerts on significant ASX mineral discoveries, instantly translating complex geological data into actionable investment insights — explore the historic returns major discoveries have generated and begin your 14-day free trial to position yourself ahead of the broader market.