August 4, 2026
The Operational Architecture Behind a Near-Record Energy Profit
When global energy markets fracture under geopolitical stress, the companies that emerge with stronger balance sheets are rarely those that simply benefited from higher commodity prices. More often, they are the ones that spent years engineering operational systems capable of converting market volatility into financial advantage. Shell's second-quarter 2026 result offers a compelling case study in exactly this dynamic, where a US$9.84 billion adjusted earnings outcome was built not on price luck, but on deliberate mechanical execution across multiple operational layers simultaneously.
Understanding how this result was constructed, rather than simply acknowledging that it happened, reveals far more about Shell's strategic positioning and the levers that drive profitability at the supermajor scale. Furthermore, the crude oil price trends that shaped the operating environment add important context to Shell's outperformance.
When big ASX news breaks, our subscribers know first
Placing the Q2 2026 Result in Historical Context
Shell's Q2 2026 adjusted earnings of US$9.84 billion rank as the company's second-highest quarterly result on record, a benchmark that places it in the same conversation as the extraordinary windfall conditions that followed Russia's 2022 invasion of Ukraine. The difference this time is notable: the 2022 spike was largely commodity-price-driven, whereas the Q2 2026 result was produced in a more operationally constrained environment characterised by active Middle East supply disruptions and ongoing market volatility.
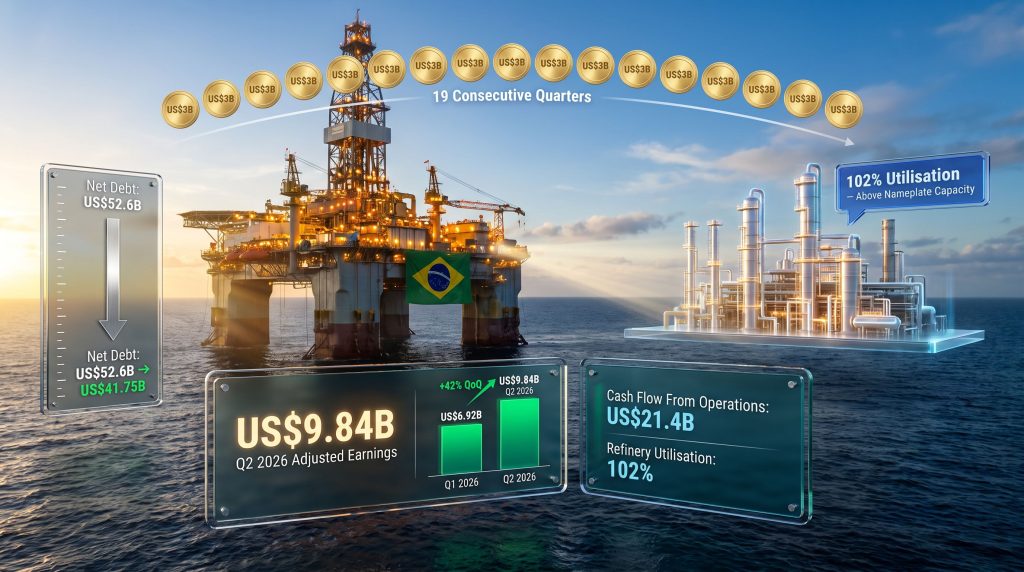
The quarter-on-quarter comparison is equally striking. Shell's Q1 2026 adjusted earnings came in at US$6.92 billion, meaning the Q2 result represents a 42% improvement in a single quarter. For Asia-Pacific energy market observers, the AU$14.8 billion equivalent figure underscores the sheer scale of value generation occurring within a single reporting period.
The Q2 2026 earnings outcome was not primarily a commodity price windfall. It was an operationally engineered result, achieved through concurrent outperformance across upstream production, refining throughput, and trading margins, even as external market conditions remained deeply uncertain.
Upstream Production: Brazil as the Anchor of Volume Growth
Shell's upstream segment delivered one of the most consequential contributions to the Q2 2026 profit surge, driven in particular by record production volumes in Brazil's deepwater basin. Brazilian deepwater operations have been a multi-year capital investment story for Shell, and Q2 2026 represented the moment that infrastructure reached peak output efficiency.
The strategic importance of Brazilian production extends beyond raw volume numbers. Brazil's pre-salt deepwater fields, operated primarily through the Buzios and Tupi clusters in the Santos Basin, produce high-quality crude oil at competitive lifting costs. The pre-salt geology, characterised by carbonate reservoirs beneath thick salt layers, was once considered technically marginal but has since become one of the most productive deepwater environments globally.
Critically, this Brazilian outperformance occurred at the same time that Middle East supply disruptions were creating uncertainty across regional markets. Rather than suffering from supply chain fragility, Shell's geographically diversified upstream portfolio acted as a natural hedge, with Brazilian volumes compensating for any exposure to Gulf region instability. This kind of oil market disruption reinforces why operational diversification matters at a supermajor scale.
Higher realised oil and LNG prices across the portfolio amplified the volume impact, with integrated gas trading gains providing an additional margin layer on top of production revenue. In addition, the LNG supply outlook for 2025 and beyond continues to support Shell's integrated gas positioning.
| Earnings Driver | Segment Impacted | Contribution Type |
|---|---|---|
| Record Brazil upstream output | Upstream | Volume-driven |
| Higher realised oil prices | Upstream / Integrated Gas | Price-driven |
| LNG and oil trading gains | Integrated Gas / Products | Margin-driven |
| Record refinery utilisation | Products / Chemicals | Efficiency-driven |
What a 102% Refinery Utilisation Rate Actually Signals
Of all the operational metrics Shell reported for Q2 2026, the 102% refinery utilisation rate is perhaps the most technically revealing. At face value, exceeding 100% of nameplate capacity appears paradoxical, but it reflects a well-understood set of industrial optimisation techniques.
Nameplate capacity figures are established at the time of facility design and represent a conservative baseline based on standard operating conditions. Refineries can exceed this baseline through several mechanisms:
- Debottlenecking involves identifying and relieving throughput constraints in specific processing units, allowing more feedstock to flow through the system without adding physical capacity
- Extended run lengths reduce the frequency and duration of planned shutdowns, increasing the number of operational days per quarter
- Feedstock blending optimisation allows refiners to process a wider range of crude types at higher total volumes, particularly when lighter crudes reduce processing unit stress
- Turnaround scheduling compression reduces the time facilities spend offline for maintenance, maximising revenue-generating uptime
A sustained 102% utilisation rate across a global refining network signals that unplanned downtime was minimal, feedstock management was precise, and turnaround execution was highly efficient. This matters for investors because refining is a largely fixed-cost business. Once a refinery is built, the marginal cost of processing additional barrels is relatively low, meaning higher throughput converts directly into improved margins without proportional cost increases.
A 102% refinery utilisation rate is not a rounding artefact. It reflects deliberate operational engineering that converts fixed-cost infrastructure into maximum variable revenue output, one of the highest-return levers available in downstream energy operations.
Combined with favourable crack spreads during the quarter, this throughput efficiency drove meaningful improvement in Shell's chemicals and refining margins, contributing materially to the overall earnings result.
Deconstructing the US$21.4 Billion Cash Flow from Operations
Shell's adjusted earnings of US$9.84 billion were impressive, but the cash flow from operations figure of US$21.4 billion tells an even more powerful story about the company's financial machinery. The divergence between earnings and cash flow reflects three distinct mechanisms operating simultaneously:
- Commodity price leverage on revenue conversion: Higher realised oil and gas prices increased revenue without a corresponding rise in the cash cost of production, given that Shell's structural cost base has been substantially reduced since 2022
- Working capital optimisation: A US$3.4 billion working capital inflow contributed significantly, reflecting improvements in receivables collection timing, inventory drawdowns, and payables management. Working capital movements of this magnitude are not accidental and typically reflect treasury and supply chain discipline built over multiple reporting cycles
- Structural cost base permanence: Shell has accumulated US$5.8 billion in structural cost reductions since 2022. These are not cyclical cost cuts tied to commodity price downturns but permanent reductions in the operating cost base, meaning each additional dollar of revenue converts into a higher proportion of free cash
The most tangible downstream consequence of this cash generation was a dramatic reduction in net debt. Shell reduced its net debt from US$52.6 billion at the end of Q1 2026 to US$41.75 billion by the close of Q2, representing a US$10.85 billion balance sheet improvement in a single quarter funded entirely through operational performance rather than asset sales or equity issuance.
How Does Shell's Performance Compare to Broader Commodity Trends?
Understanding the Shell profit increase driven by record-breaking operational performance requires situating it within the wider energy landscape. The commodity price impacts affecting energy producers globally have been uneven, making Shell's structural advantages all the more significant. Furthermore, movements in WTI and Brent futures during the quarter provided a constructive backdrop that Shell's operational machinery was well-positioned to exploit.
Capital Return Discipline: 19 Consecutive Quarters of Buybacks
Shell's capital return framework has become one of the most consistent in the global energy sector. The company announced a further US$3 billion share buyback programme following Q2 2026 results, alongside a US$1.2 billion rollover from a brief suspension that coincided with the ARC Resources acquisition process.
This marks 19 consecutive quarters in which Shell has committed to buybacks of at least US$3 billion per quarter, a streak that carries significant signalling value beyond the cash quantum itself. Sustaining this cadence requires not just strong earnings in any given quarter but a financial architecture designed to generate predictable excess cash across commodity cycles.
Over the trailing 12-month period, Shell's total shareholder distributions equated to 44% of cash flow from operations, a ratio that demonstrates genuine capital discipline rather than earnings-period generosity. According to Shell's investor relations disclosures, this consistency reflects a long-term commitment to shareholder value that persists across market conditions.
Simultaneously, Shell has maintained its 2026 capital expenditure guidance of US$24 to US$26 billion, an unchanged envelope despite the stronger earnings environment. This restraint is deliberate: expanding capex aggressively in response to short-term price tailwinds would undermine the fixed-cost discipline that generated the Q2 result in the first place.
| Metric | Q2 2026 Value | Context |
|---|---|---|
| Adjusted Earnings | US$9.84 billion | Up 42% from Q1 2026 |
| Cash Flow From Operations | US$21.4 billion | Includes US$3.4B working capital inflow |
| Net Debt | US$41.75 billion | Down from US$52.6B end of Q1 2026 |
| Refinery Utilisation Rate | 102% | Above nameplate capacity |
| Share Buyback Announced | US$3.0B + US$1.2B rollover | 19th consecutive quarter at or above US$3B |
| Shareholder Distributions (12M) | 44% of CFFO | Sustained capital return commitment |
| Structural Cost Savings Since 2022 | US$5.8 billion | Permanent reduction, not cyclical |
| 2026 Capex Guidance | US$24-26 billion | Unchanged despite strong results |
| ARC Resources Production CAGR Target | 4% through 2030 | Post-acquisition growth trajectory |
The next major ASX story will hit our subscribers first
The ARC Resources Acquisition and Portfolio High-Grading
Shell's growth trajectory beyond 2026 is being shaped significantly by the pending acquisition of ARC Resources, which received shareholder approval and is expected to close during Q3 2026. The strategic logic is clear: ARC Resources adds Canadian natural gas volumes that align directly with Shell's integrated LNG strategy, providing feedstock optionality for future liquefaction capacity and export opportunities into Asian markets.
Following completion, Shell projects production growth at a 4% compound annual growth rate through to 2030, a target that balances volume ambition with the capital efficiency discipline the company has embedded since 2022.
Concurrent with this growth acquisition, Shell is actively divesting assets that no longer meet its return threshold:
- Jiffy Lube (United States): An automotive services business with limited strategic connection to Shell's upstream and integrated energy core
- SPRNG Energy (India): A renewables platform that Shell has elected to exit as capital is refocused toward higher-margin hydrocarbon operations
- South African marketing business: A geographic rationalisation reflecting Shell's preference for markets where it can achieve scale advantages
This simultaneous acquire-and-divest strategy reflects a portfolio high-grading discipline that prioritises capital efficiency per asset over asset count or geographic breadth. The assets being sold share a common characteristic: each operates in a market segment where Shell's competitive advantage is limited relative to the capital required to sustain the position.
The Operational Framework Driving Consistent Outperformance
Shell CEO Wael Sawan has consistently articulated a strategy centred on delivering critical energy supplies during periods of market disruption while maintaining strict capital allocation discipline. The Q2 2026 result is best understood as the measurable output of that philosophy applied across multiple operational systems at once.
The key pillars underpinning the Shell profit increase driven by record-breaking operational performance can be summarised as follows:
- Geographic diversification as a structural risk buffer, with Brazilian deepwater production offsetting Middle East exposure
- Downstream asset intensity optimisation, achieving 102% refinery utilisation to maximise fixed-cost leverage
- Working capital engineering as a distinct cash generation mechanism beyond earnings
- Permanent cost base reduction, with US$5.8 billion in structural savings since 2022 creating a lower breakeven environment
- Capital allocation consistency, with 19 consecutive quarters of minimum US$3 billion buybacks functioning as a governance signal to investors
For energy sector analysts and long-term investors, the Q2 2026 result demonstrates that supermajor profitability in the current cycle is not simply a function of oil price levels. It is increasingly a function of operational engineering quality, capital discipline, and portfolio construction decisions made years before any single quarterly result is reported. Indeed, Shell's approach offers a benchmark against which global energy major strategies can be usefully evaluated.
For broader coverage of global energy major financial performance and capital strategy, explore related industry analysis at petroleumaustralia.com.au.
Disclaimer: This article contains forward-looking statements and financial projections based on publicly available information. Past performance is not indicative of future results. Readers should conduct their own independent research before making any investment decisions.
Want to Capitalise on the Next Major Resource Discovery Before the Broader Market Catches On?
While Shell's Q2 2026 result demonstrates the immense value that operational precision and long-term portfolio engineering can unlock, similar transformative moments occur regularly at the junior end of the ASX — and timing is everything. Discovery Alert's proprietary Discovery IQ model delivers real-time notifications on significant ASX mineral discoveries the moment they are announced, turning complex geological and market data into actionable insights for both short-term traders and long-term investors. Explore Discovery Alert's dedicated discoveries page to understand how historic finds have generated exceptional shareholder returns, and begin your 14-day free trial today to position yourself ahead of the market.